- Economic conditions: poor (based on poverty standards to be granted a poor household card) and normal or above normal.
* Gynecological history
- Genital tract infection (VSD): based on history with 3 main symptoms: pelvic pain, dirty, smelly vaginal discharge, possibly fever. Or based on medical records, prescriptions that have been examined and diagnosed before, if any.
- Time of VSD.
- Number of VSD episodes.
* Obstetric history
- Number of pregnancies: Total number of pregnancies including births, abortions, stillbirths, miscarriages
- History of NPT: including both pathological and unwanted pregnancies, including: number of NPTs, gestational age at the time of NPT, location of NPT, level of NPT practitioner, whether or not there were complications after NPT, whether or not antibiotics were used after NPT.
* History of pelvic surgery : Including pelvic surgeries such as cesarean section, appendectomy, gynecological tumor surgery. Excluding pelvic surgeries such as VTC reconstruction or ligation, VTC resection due to GEU.
* History of applying IUD by placing IUD : Number of IUD placements, time, location and person placing IUD
* Variables used to compare and evaluate the limitations of retrospective studies:
- Current infection status: assessed through examination, vaginal fluid microscopy to find pathogenic bacteria and Chlamydia testing by immunochromatography
- VTC status after NS surgery
2.2.5. Research questions
Is there a relationship between the following factors: history of genital tract infection, history of NPT, history of IUD placement, and history of pelvic surgery (except for incisions on the VTC) with VS due to VTC?
Hypotheses about associations will be considered statistically significant at the level of
95% confidence interval (CI), 5% type 1 error with two-tailed test. Risk factors are considered to be associated with disease when the p value is statistically significant (<0.05) and the hazard ratio (OR) >1.5
2.2.6. Face-validity and pilot study
The questionnaire used to collect data for the study was commented on by the instructor, and unanimously agreed to conduct the study.
The data collection tool was piloted on 20 cases and 10 controls to check the clarity and feasibility of the questions, especially the control group.
The analysis of the data from the experimental patient group also assessed the feasibility of analyzing the data with the hypotheses. The experiences drawn from the experimental results were applied to the revised data collection tool, and the acceptance and rejection rates, refusal and abandonment rates were also estimated to determine the sample size needed for the formal study.
2.2.7. Data entry, processing and analysis
- Data were analyzed with Stata 10.0 software (Stata Corporation, College Station, TX, USA).
- Using univariate analysis to investigate the association between groups of risk factors for infertility due to VTC by calculating and analyzing the odds ratio (Odd Ratio: OR) in the study.
- Using multivariate logistic regression to analyze related factors in each factor group to find statistically significant risk factors.
- Finally, multivariate logistic regression was used for all variables as risk factors to find the model related to the risk of VS due to VTC. Using the maximum likelihood estimation method in the logistic regression model and test likelihood ratio to test statistical significance, statistical tests were considered significant when the p value <0.05 [60] .
2.2.8. Ethical issues in research
- Subjects were explained the purpose of the research and agreed to participate in the research voluntarily.
- Ensure confidentiality of research subjects' identities and personal information.
- Research results are for research purposes only.
2.3. QUALITATIVE RESEARCH
2.3.1. Research design
Research design: In-depth interview
2.3.2. Sample size and research participants
* Research subjects : Women in the disease group participated in the study in phase 1.
Selection criteria :
- Purposeful selection of research subjects based on age and treatment results, interviews conducted between December 2009 and May 2010.
- Agree to be interviewed
Exclusion criteria
- Not participating in phase 1 research
- Refuse to be interviewed
* Sampling method: Non-probability sampling, research subjects are selected purposefully to have more information for in-depth research.
* Sampling strategy:
- Step one : group objects. Objects are grouped according to diagram 2.2
No treatment (n=68)
With treatment (n=122)
Pregnant (n=2)
Older age and no longer able to be treated (n=9)
No money (n=57)
Pregnant (n=39)
Treatment dropout (n=66)
Continued treatment (n=15)
Women with VS due to VTC in the case-control group of the study (n=190)
Diagram 2.2. Selection of research objects in phase 2
- Step 2 : Select interview subjects according to diagram 2.3
10 women out of the above were selected by purposive sampling method according to diagram 2.3
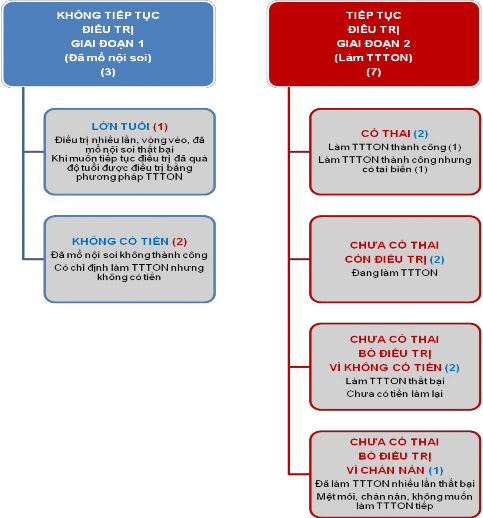
Figure 2.3. Selection of subjects for in-depth interviews
2.3.3. Data collection techniques
10 women selected according to diagram 2.3 were scheduled for a specific date and time arranged by the subjects, interviewed in a private room to ensure privacy and to make the subjects feel comfortable to be able to express all their emotions according to the semi-structured guide prepared. No recording of questions and answers requested by the interview subjects was made. During the interview, the door was closed and the phone was turned off to avoid interruptions. On average, an interview lasted 70 minutes, the longest was 95 minutes, the shortest was 55 minutes.
2.3.4. Collected variables:
The effects of pressure from women themselves
- Effects related to economic burden (treatment costs, income conditions compared to treatment costs, access to health services and other methods, time and number of treatment visits, outcomes)
- Physical effects (health, accidents, etc.)
- Mental effects (anxiety, inferiority complex, desire to have children and motivation to have children)
Effects of pressure from husband and family of women:
- Affects marital relationships over time (affection, violence, infidelity, divorce)
- Impact on family economy (due to burden of treatment costs, impact on work)
- Gender-related discrimination and domestic violence due to childlessness (frustration, curses due to infertility caused by the wife, family pressure forcing the husband to divorce)
Effects of public pressure:
- Attitude and influence of the community when knowing the cause of VS is due to wife (gender factor)
- Community views on women's reproductive function
The effects of socio-cultural and religious prejudice
- Social prejudice that reproductive responsibility belongs to women (gender factor)
- Avoid childless women due to immoral behavior and being punished for corruption
- Religion believes that children are a gift from God, and not being able to have children is a punishment from God.
2.3.5. Data entry and analysis
Interviews were recorded and transcribed for input and analysis using N-Vivo software based on tree nodes construction.
2.3.6. Ethical issues in research
- Participants voluntarily participate, their identity is protected and they have the right to refuse any questions from the interviewer.
- Women participating in the interview were invited to a private, discreet room, without the presence of any family members to increase the ability to share information, especially confidential and sensitive information.
- Research results are for research purposes only.
Chapter 3
RESEARCH RESULTS
3.1. QUANTITATIVE RESEARCH RESULTS
3.1.1. Some demographic characteristics of the case-control study subjects
Descriptive statistical analysis on Stata software, frequency distribution of demographic characteristics is shown as follows.
Table 3.1: Some demographic characteristics
Parameters
Disease (n=190) Frequency (%) | Evidence (n=190) Frequency (%) | Shared Frequency (%) | p-value | |
Average age | 30.7 (SD=5.4) | 30.5 (SD=5.3) | 30.6 (SD=5.4) | |
Age group <25 25-34 35-39 40 | 26 (13.7) 113 (59.5) 43 (22.6) 8 (4.2) | 27 (14.2) 116 (59.5) 38 (20.0) 9 (4.7) | 53 (13.9) 229 (60.3) 81 (21.3) 17 (4.5) | 0.94 |
Geographic location Urban Rural Mountainous | 55 (28.9) 99 (52.1) 36 (18.9) | 63 (33.2) 106 (55.8) 21 (11.1) | 118 (31.1) 205 (53.9) 57 (15.0) | 0.09 |
Job Civil servants and farmers Other professions | 68 (35.8) 75 (39.8) 47 (24.7) | 72 (37.9) 64 (33.7) 54 (28.4) | 140 (36.8) 139 (36.6) 101 (26.6) | 0.48 |
Education level Illiterate Primary Secondary School High school and above | 1 (0.5) 10 (5.3) 56 (29.5) 123 (64.7) | 2 (1.0) 8 (4.2) 50 (26.3) 130 (68.4) | 3 (0.8) 18 (4.7) 106 (27.9) 253 (70.3) | 0.70 |
Nation Minority Scripture | 170 (89.5) 20 (10.5) | 181 (95.3) 9 (4.7) | 351 (92.4) 29 (7.6) | 0.03* |
Economic conditions Poor Normal and above normal | 23 (12.1) 167 (87.9) | 20 (10.5) 170 (89.5) | 43 (11.3) 337 (88.7) | 0.63 |
Maybe you are interested!
-

 Study on the influence of some factors on specific energy cost and surface roughness when milling flat surfaces with face milling cutters on milling machine TUM 20VS - 1
 -
 Limiting social insurance debt of businesses by applying sanctions Case study of businesses in Thanh Xuan district, Hanoi city - 12
 -
 The relationship between travel motivation, destination image and destination choice - A case study of Binh Dinh province tourism destination - 1
 -
 Study on fabrication and gas sensitivity of heterostructure between SnO2 nanowires and some semiconducting metal oxides - 17
 -
 Applying Project-Based Learning to Organize Study Tours to the Hoa Lu Ancient Capital Cultural Heritage
(*: p-value is statistically significant)
The average age of patients in the study sample was 30.6, of which the average age of the control group was 30.5, the youngest was 18, the oldest was 42 (SD ± 5.3). The average age of the disease group was 30.7, the youngest was 19, the oldest was 44 (SD ± 5.4).
According to data analysis table 3.1, there is no significant difference between the two groups of patients and controls in terms of geographical location, occupation, education level, ethnicity and economic conditions with p>0.05. There is a statistically significant difference between Kinh people and ethnic minorities between the patient group and the control group. Ethnic minorities coming for treatment of VS due to VTC accounted for 10.5% of the patient group compared to 4.7% coming for prenatal examination at Thanh Hoa Obstetrics and Gynecology Hospital.
3.1.2. Analysis of the relationship between VS caused by VTC and risk factors
3.1.2.1. Analysis of the relationship between history of IUD placement and risk of VS due to VTC
Using univariate analysis for case-control studies to test the association between IUD placement and the risk of VTE due to VTE showed that women with IUD placement were not a risk factor for VTE due to VTE (Table 3.2).
Table 3.2: Association between IUD placement and risk of VTC-induced VS
TS set
DCTC
Sick (n=190)(%) | Proof (n=190)(%) | Total (n=380)(%) | Crude OR (95% KTC) | Price p value | |
Have | 64 (33.7) | 70 (36.8) | 134 (35.3) | 0.9 (0.57-1.32) | 0.52 |
Are not | 126 (66.3) | 120 (63.2) | 53 (71.7) |
(OR: Odds ratio; CI: Confidence interval)
Continuing multivariate analysis of a number of factors related to IUD placement and the risk of VS due to VTC showed that the number of IUD placements had a statistically significant association with the risk of VS due to VTC (Table 3.3).
The analysis results showed that factors such as health care provider qualifications and years of IUD placement were not associated with VTC-induced VS.
However, the number of times the IUD was placed was closely related to VS due to the