Samples were collected to determine dry biomass (CDW), evaluate growth, and determine the COD content synthesized from the fungal strain.
- Effect of nitrogen source
After obtaining a suitable carbon source, add 5% of the 36-hour activated fungal strain into a conical flask containing 25ml of biomass collection medium with different nitrogen sources: NaNO 3 , yeast extract, peptone, meat extract, KNO 3 , NH 4 Cl, NH 4 NO 3 , (NH 4 ) 2 SO 4 , NH 4 HCO 3 , MSG. Cultivate in a shaking cabinet and shake with
speed of 150 rpm at temperature of 25 0 C. After 6 days, determine CDW and function
amount of COD generated.
2.2.1.7. Evaluation of cytotoxic activity by MTT method
Hep-G2 (Hepatocellular carcinoma); PC-3 (Human Prostate Adenocarcinoma); Vero (kidney, African green monkey) cell lines were cultured at 37 o C, 5% CO 2 in suitable media: DMEM (Dulbecco's Modified Eagle Medium), EMEM (Eagle's Minimum Essential Medium, Sigma-Aldrich, USA) or RPMI 1640 (ThermoFisher, Waltham, Germany) supplemented with 2mM L-glutamine, antibiotics (Penicillin + Streptomycin sulfate) and 5-10% calf serum. The cell suspension was then pipetted onto 96-well microtiter plates and incubated with samples at concentrations ranging from 100 ∼ 6.25 µg/ml for the extract or 50 ∼ 1 µg/ml (µM) for the purified substance, each concentration repeated three times. Ellipticine or Paclitaxel (Taxol) in DMSO was used as a positive (+) standard. The crystalline formazan metabolite was dissolved in dimethyl sulfoxide (DMSO, Sigma-Aldrich) and the optical density was measured at λ = 540/720 nm on an Infinite F50 instrument (Tecan, Männedorf, Switzerland) [114, 120].
The ability to inhibit cancer cell proliferation at a certain concentration of the test substance is calculated as a % compared to the control according to the formula:
Cell inhibition rate (%) = [1-(OD [sample] /OD [control (-)] )] Standard deviation is calculated by the formula:
x i x ^ 2 / n 1
Samples showing activity (% inhibition ≥ 50%) were determined for IC 50 value (μg/ml or μM) which is the concentration of the sample at which 50% of cell viability is inhibited, using TableCurve AISN Sofware (Jandel Scientific, San Rafael, CA). The tests were performed at the Institute of Chemistry of Natural Products, Vietnam Academy of Science and Technology.
2.2.1.8. Method for evaluating antimicrobial activity
Antimicrobial activity testing was conducted to evaluate the antibiotic activity of the extracts on 96-well microtiter plate according to the modern method of McKane & Kandel [110, 185].
Tested microbial strains include: Escherichia coli ATCC 25922, Pseudomonas aeruginosa ATCC 25923, Bacillus subtillis ATCC 11774, Staphylococcus aureus subsp. Aureus ATCC 11632, Aspergillus niger 439, Fusarium oxysporum M42, Candida albicans ATCC 7754, Saccharomyces cerevisiae SH 20.
Positive control: Streptomycin for Gr (+) bacteria, Tetracycline for Gr (-) bacteria, Nystatin or Amphotericin B for filamentous fungi and yeasts. Antibiotics are mixed in 100% DMSO at appropriate concentrations. Negative control: Test microorganisms are not mixed with antibiotics and test substances.
Culture maintenance and preservation media: SDB for yeast and mold, TSB for bacteria. Experimental media: Eugon Broth (Difco, USA) for bacteria, Mycophil (Difco, USA) for fungi.
The test strains were activated and diluted according to McFarland standard 0.5 and then tested. The test plates were incubated at 37 o C/24 hours for bacteria and 30 o C/48 hours for filamentous fungi and yeasts.
The sample is diluted in descending concentrations to calculate the minimum inhibitory concentration (MIC), which is the concentration at which the microorganism is almost completely inhibited.
The tests were conducted at the Institute of Chemistry of Natural Products, Vietnam Academy of Science and Technology.
2.2.1.9. Evaluation of antioxidant activity
DPPH (1,1-diphenyl-2-picrylhydrazyl) radical scavenging ability analysis is a well-established method for rapid determination of antioxidant activity [27, 59, 88]. The test substance was dissolved in dimethyl sulfoxide (DMSO 100%) and DPPH was dissolved in ethanol 96%. The sample was dissolved in DMSO 100% at a concentration of 4 mg/ml for crude extract and 1 mg/ml for purified sample. 1 mM flavonoid or 5 mM ascorbic acid in DMSO 10% was used as a positive control. The sample was dropped onto a 96-well microplate with DPPH solution to obtain a final concentration of the sample in the reaction ranging from 200 μg/mL to 12.5 μg/mL (for crude extract) and from 50 μg/mL to 3.1 μg/mL (for purified sample). Incubation at 37 o C for 30 min and measure the optical density (OD) at
wavelength λ= 515 nm on a photometer (Infinite F50, Tecan, Switzerland).
Scavenging capacity (SC%): The average value of SC (%) at sample concentrations was entered into the Excel data processing program according to the formula:
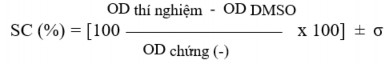
The standard deviation σ is calculated by Duncan's formula as follows:
SC 50 Determination : The sample (test substance) is diluted to decreasing concentrations, repeated 3 times at each concentration. The DPPH free radical trapping efficiency of each sample is calculated based on the % free radical neutralization compared to the blank sample (Blank).
and negative control. Samples showing antioxidant activity on the DPPH system were subjected to the following steps to find the IC 50 value (μg/mL, μM/mL). The IC 50 value is the concentration of the test substance at which 50% of free radicals are neutralized, determined by TableCurve AISN Sofware (Jandel Scientific, USA) through the SC% value and the corresponding test substance concentration range.
The tests were conducted at the Institute of Chemistry of Natural Products, Vietnam Academy of Science and Technology.
2.2.2. Molecular biological methods
2.2.2.1. Total DNA extraction
Cultivate the selected strain on liquid Sabouraud medium for 48 hours. Collect the fungal biomass and put it in eppendorf (200mg/strain), sonicate for 10-30 seconds depending on the strain. Add 600µl of SDS buffer to the sample tube, incubate at 60-70 0 C for 15-60'. Add 300µl of 3M Sodium acetate (pH 5.2). Centrifuge at 13000 rpm for 20' at 40C, transfer the supernatant to a new eppendorf. Add cold isopropanol (ratio 1:1). Centrifuge at 13000 rpm for 15 minutes, discard the supernatant, collect the precipitate. Wash the precipitate with 500 µl of 70% ethanol, let it dry for 10-15'. Add 50
µl TE buffer (Tris-EDTA, pH 8). Add 3 µl RNase (10mg/ml) and incubate at 60 o C for
30', store DNA at 0-4 o C [49].
2.2.2.2. DNA replication
Total DNA was used to conduct PCR reactions to amplify the ITS region with the primer pair ITS4 - ITS5 [142], the LSU region with the primer pair LROR-LR7 [188], and the Rpb1 region with the primer pair Crpb1A-RPB1Cr [33]. Using the kit “Dream Taq PCR Master Mix (2X)” (Thermo Fisher Scientific, USA). Denature the DNA at 95 o C for 3‟. Repeat 35 cycles with the thermal cycling for the PCR reaction: (1) DNA denaturation step at 95 o C for 30”. (2) Primer annealing step at 48 o C for 30”. (3) Extension step: 72 o C for 1‟40”.
The final extension was 8 minutes at 72 o C and 4 o C (∞). Check the PCR product on agarose gel with 80V voltage for 60 minutes and visualize the product under UV light.
2.2.2.3. Sequencing method
PCR products were sequenced (First BASE Company - Singapore). The results were analyzed using BioEdit 7.2 software [63] and compared with related DNA sequences obtained from the NCBI gene bank through the Blast search tool. The related sequences were aligned with the research sequence using ClustalX1.83 software [175] and used to analyze taxonomic and phylogenetic relationships. The results of gene sequence analysis will allow to determine and conclude the relationships between the research species, the evolutionary tree is displayed using Mega X software [89].
Table 2.2. Sequences used to construct phylogenetic trees on three gene regions ITS, LSU, Rpb1
Species name
Strain symbol | Gene segment | |||
ITS | LSU | Rpb1 | ||
C. catenianulata | CBS152.83 | - | NG067333.1 | - |
C. catenianulata | NTUCC18-108 | MT966056.1 | MT974270.1 | - |
C. catenianulata | NTUCC18-109 | - | MT974273.1 | - |
C. catenianulata | NTUCC18-110 | - | MT974275.1 | - |
C. catenianulata | NTUCC18-111 | - | MT974310.1 | - |
C. catenianulata | TBRC7258 | MF140753.1 | MF140729.1 | MF140767.1 |
C. farinose | CBS262.58 | AY624179.1 | MH869308.1 | MF416654.1 |
C. fumosorosea | BCC20180 | MH532834.1 | MH394654.1 | MH521837.1 |
C. militaris | NBRC9787 | JN943433.1 | JN941384.1 | JN992491.1 |
C. militaris | NBRC100741 | JN943437.1 | JN941386.1 | JN992489.1 |
C. nipponica | NBRC101406 | JN943301.1 | JN941388.1 | JN992487.1 |
C. nipponica | NBRC101407 | JN943392.1 | JN941389.1 | JN992486.1 |
C. takaomontana | BCC12688 | EU807996.1 | MF416545.1 | MF416646.1 |
C. tenuipes | BCC34337 | MH532861.1 | MH394665.1 | MH521839.1 |
C. tenuipes | NHJ12337 | JN942617.1 | - | - |
C. tenuipes | TBRC7265 | MF140741.1 | MF140707.1 | MF140776.1 |
H. atrovidis | NBRC8436 | JN943354.1 | JN941450.1 | JN992425.1 |
H. gelatinosa | NBRC9060 | JN943357.1 | JN941452.1 | JN992423.1 |
I. catenianulata | BCMUIF05 | AB263742.1 | ||
I. farinose | CBS111113 | AY624181.1 | MF416554.1 | MF416656.1 |
I. farinose | CBS240.32 | AY624178.1 | JF415979.1 | JN049895.1 |
I. farinose | CBS262.58 | AY624179.1 | ||
I. tenuipes | NHJ12337 | JN942617.1 | JN940905.1 | JN987883.1 |
O. myrmecophila | BCC82258 | MH028147.1 | MH028159.1 | MH028171.1 |
O. nutans | NBRC101749 | AB968408.1 | JN941429.1 | JN992446.1 |
O. sphecocephata | NBRC101416 | IN943348.1 | JN941443.1 | JN992432.1 |
S. hepialid | RCEF3666 | MW031744.1 | MW045188.1 | MW080845.1 |
S. hepialid | RCEF3890 | MW031745.1 | MW045189.1 | MW080846.1 |
Maybe you are interested!
-
 Study on synthesis and evaluation of cytotoxic activity of benzimidazole and indole-2 derivatives
 -
 Procedure for Toxicological Activity Survey Using Srb Method
 -
 Evaluation of Anti-Inflammatory Activity of Active Ingredients Isolated from the Ba Vi Snake Plant
 -
 Theoretical Basis of Traditional Costing Method and Activity Based Costing Method (Abc)
 -
 Applying the ABC activity-based pricing method at Camimex Ca Mau Seafood Processing and Import-Export Joint Stock Company - 1
2.2.3. Method for extraction and purification of cyclooligomer depsipeptide
2.2.3.1. Method of extracting compounds from fungal biomass
The analysis and separation of fungal biomass extracts were performed by different chromatographic methods such as thin layer chromatography (TLC), conventional column chromatography (CC) with silica gel (Merck) as the stationary phase, reversed phase column chromatography with YMC RP 18 (Merck) as the stationary phase, and molecular chromatography with sephadex LH-20 (Merck) as the stationary phase.
Thin layer chromatography (TLC): pre-coated DC-Alufolien 60 F254 (0.25 mm; Merck) and RP-18 F254S (0.25 mm; Merck) plates.
Column chromatography (CC): Normal column chromatography with stationary phase silica gel 60, particle size 0.040 - 0.063 mm (230 - 400 mesh) from Merck. Molecular chromatography with stationary phase sephadex LH-20. Reverse phase column chromatography uses YMC RP-18 with particle size 30-50 μm (Fuji Silysia Chemical Ltd.).
HPLC-MSD: Agilent 1200 Ion Trap from the Institute of Natural Products Chemistry
2.2.3.2. Method for determining the chemical structure of pure compounds
Methods for determining the chemical structure of compounds use modern equipment. The equipment and methods used include:
Melting point (mp ) : Measured on Kofler micro-hotstage machine of Institute of Chemistry of Natural Compounds - Vietnam Academy of Science and Technology.
Polar rotation ([α] D ): Measured on JASCO DIP-1000 KUY instrument of Institute of Chemistry of Natural Compounds - Vietnam Academy of Science and Technology.
Mass spectrometry (MS): ESI-MS (electron spray) mass spectrometry was measured on an Agilent 1200 TRAP. HR-ESI-MS high resolution mass spectrometry was measured on an FT-ICR-Mass spectrophotometer at the Institute of Chemistry - Vietnam Academy of Science and Technology.
Nuclear magnetic resonance (NMR) spectrum: Measured on Bruker Avance 500 MHz (Internal standard is TMS), at Institute of Chemistry - Vietnam Academy of Science and Technology.
Nuclear magnetic resonance spectroscopy techniques used:
One-dimensional nuclear magnetic resonance spectra: 1 H-NMR, 13 C-NMR and DEPT. Two-dimensional nuclear magnetic resonance spectra: HSQC, HMBC,….
Solvents used included DMSO-d 6 , CD 3 OD and CDCl 3 solvents .
2.2.3.3. Experimental extraction and purification of COD compound from C. cateniannulata CPA14V mushroom biomass
Table 2.3. Experimental methods for survey and post-survey experiments for COD extraction and purification
Survey Experiment
Experiment after survey | |
Step 1: After being activated, the C. cateniannulata CPA14V strain was cultured in CzD medium using glucose as carbon source, NaNO 3 as nitrogen source , pH of medium was 8 for 6 days, shaking at 150 rpm at 25 o C. The fungal biomass was washed with filtered water and then freeze-dried using a freeze-dryer. Flexi Dry (USA) | Step 1: After being activated, the C. cateniannulata CPA14V strain was cultured in CzD medium using glucose as carbon source, NaNO 3 as nitrogen source , pH of medium was 8 for 6 days, shaking at 150 rpm at 25 o C. The fungal biomass was washed with filtered water and then freeze-dried using a freeze-dryer. Flexi Dry (USA) |
Step 2: Extract 25g of dry biomass of C. cateniannulata CPA14V mushroom with ethanol solvent in an ultrasonic device at room temperature. The total extract obtained is distilled to remove all solvent under reduced pressure, temperature < 50 o C to obtain total ethanol extract ( CCM ) for use. as raw material for isolation and purification | Step 2: Biomass (25g) is extracted 5 times with dichloromethane solvent in an ultrasonic device at room temperature. The total dichloromethane solution obtained is distilled off the solvent using an IKA RV 06-MT rotary vacuum evaporator under reduced pressure, temperature < 50 o C. total dichloromethane extract |