Table 4.22 Estimated values of the model's relationship in confirmatory factor analysis (CFA) of independent factor scales.
Relationship
Not standardized | Standardized | ||||||
Weight | SE | CR | P-value | Weight | |||
HDTN1 | <--- | HDTN | 1 | 0.891 | |||
HDTN2 | <--- | HDTN | 0.894 | 0.043 | 20,696 | *** | 0.811 |
HDTN3 | <--- | HDTN | 0.834 | 0.041 | 20,191 | *** | 0.797 |
HDTN4 | <--- | HDTN | 0.858 | 0.043 | 20,048 | *** | 0.861 |
HDKDDL1 | <--- | HDKDDL | 1 | 0.965 | |||
HDKDDL2 | <--- | HDKDDL | 0.996 | 0.02 | 48,811 | *** | 0.97 |
HDKDDL3 | <--- | HDKDDL | 0.663 | 0.041 | 16,273 | *** | 0.626 |
HDKDDL4 | <--- | HDKDDL | 0.811 | 0.031 | 26,533 | *** | 0.808 |
MTDD1 | <--- | MTDD | 1 | 0.915 | |||
MTDD2 | <--- | MTDD | 0.912 | 0.037 | 24,896 | *** | 0.835 |
MTDD3 | <--- | MTDD | 0.881 | 0.036 | 24,771 | *** | 0.833 |
MTDD4 | <--- | MTDD | 0.961 | 0.037 | 26,197 | *** | 0.857 |
MTDD5 | <--- | MTDD | 0.851 | 0.038 | 22,227 | *** | 0.792 |
PTSP1 | <--- | PTSP | 1 | 0.707 | |||
PTSP2 | <--- | PTSP | 1,283 | 0.072 | 17,777 | *** | 0.901 |
PTSP3 | <--- | PTSP | 1,232 | 0.074 | 16,578 | *** | 0.831 |
PTSP4 | <--- | PTSP | 1,141 | 0.066 | 17,163 | *** | 0.863 |
PTSP5 | <--- | PTSP | 0.885 | 0.067 | 13,223 | *** | 0.661 |
THKDL1 | <--- | THKDL | 1 | 0.855 | |||
THKDL2 | <--- | THKDL | 0.996 | 0.042 | 23,832 | *** | 0.875 |
THKDL3 | <--- | THKDL | 0.99 | 0.044 | 22,321 | *** | 0.845 |
THKDL4 | <--- | THKDL | 0.945 | 0.043 | 21,884 | *** | 0.813 |
THKDL5 | <--- | THKDL | 0.798 | 0.04 | 20,174 | *** | 0.774 |
SKDD1 | <--- | SKDD | 1 | 0.897 | |||
SKDD2 | <--- | SKDD | 0.843 | 0.043 | 19,479 | *** | 0.766 |
SKDD3 | <--- | SKDD | 0.966 | 0.042 | 23,048 | *** | 0.86 |
SKDD4 | <--- | SKDD | 0.738 | 0.049 | 14,971 | *** | 0.717 |
XDTH1 | <--- | XDTH | 1 | 0.711 | |||
XDTH2 | <--- | XDTH | 1,019 | 0.062 | 16,424 | *** | 0.713 |
XDTH3 | <--- | XDTH | 1,326 | 0.074 | 17.86 | *** | 0.947 |
Maybe you are interested!
-

 Theoretical Basis for Evaluating Boarding School Models for Ethnic Minority Students.
 -
 Some Theoretical Models on Economic Sector Structure Shift
 -
 Evaluating the effectiveness of agricultural and forestry farming models on limestone terrain in Yen Minh district, Ha Giang province as a basis for planning the district's agricultural and forestry development - 10
 -
 Evaluating Tourist Satisfaction with the Type of Ecotourism "Garden - River" in Tien Giang.
 -
 Evaluating the effectiveness of some forest planting models in Bao Lac district, Cao Bang province - 1
Relationship
Not standardized | Standardized | ||||||
Weight | SE | CR | P-value | Weight | |||
XDTH4 | <--- | XDTH | 1.14 | 0.068 | 16,758 | *** | 0.825 |
XDTH5 | <--- | XDTH | 0.932 | 0.063 | 14,901 | *** | 0.734 |
NCKDL2 | <--- | NCKDL | 1 | 0.575 | |||
NCKDL3 | <--- | NCKDL | 1,552 | 0.114 | 13,609 | *** | 0.852 |
NCKDL4 | <--- | NCKDL | 1,785 | 0.125 | 14,233 | *** | 0.995 |
NCKDL5 | <--- | NCKDL | 1,317 | 0.089 | 14,774 | *** | 0.804 |
HDLS1 | <--- | HDLS | 1 | 0.826 | |||
HDLS2 | <--- | HDLS | 1,165 | 0.048 | 24,085 | *** | 0.988 |
HDLS3 | <--- | HDLS | 0.563 | 0.044 | 12.74 | *** | 0.506 |
HDLS4 | <--- | HDLS | 0.904 | 0.045 | 20,113 | *** | 0.786 |
QLDD1 | <--- | QLDD | 1 | 0.872 | |||
QLDD2 | <--- | QLDD | 0.941 | 0.049 | 19,304 | *** | 0.774 |
QLDD3 | <--- | QLDD | 0.957 | 0.046 | 20,903 | *** | 0.817 |
QLDD4 | <--- | QLDD | 0.868 | 0.045 | 19,175 | *** | 0.77 |
NLCT2 | <--- | NLCT | 1 | 0.904 | |||
NLCT3 | <--- | NLCT | 0.982 | 0.036 | 27,535 | *** | 0.882 |
NLCT4 | <--- | NLCT | 0.963 | 0.035 | 27,638 | *** | 0.883 |
NLCT5 | <--- | NLCT | 0.942 | 0.038 | 24,508 | *** | 0.834 |
NNL1 | <--- | NNL | 1 | 0.643 | |||
NNL5 | <--- | NNL | 1,239 | 0.131 | 9.48 | *** | 0.647 |
NNL6 | <--- | NNL | 1,166 | 0.122 | 9,563 | *** | 0.662 |
KCHT1 | <--- | KCHT | 1 | 0.609 | |||
KCHT2 | <--- | KCHT | 1,451 | 0.116 | 12,531 | *** | 0.783 |
KCHT3 | <--- | KCHT | 1,208 | 0.089 | 13,613 | *** | 0.7 |
KCHT4 | <--- | KCHT | 1,455 | 0.112 | 12,978 | *** | 0.838 |
NNL4 | <--- | NNL | 0.871 | 0.099 | 8,762 | *** | 0.564 |
Source: Calculation results from a direct survey of 450 tourists in Bac Lieu in 2018.
Note: ***: Significance level 1%..
4.4.4 Structural Equation Modeling (SEM)
4.4.4.1 Assessment of the suitability of the theoretical model using structural equation modeling (SEM)
After CFA analysis, the study used SEM structural model to determine the influencing factors and the level of influence of the component factors on the aspects of enhancing destination competitiveness. SEM analysis was conducted starting from the initially proposed research model, then the model was adjusted to obtain a better model. Using linear structural model (SEM) to test the proposed research model.
In testing hypotheses and research models, the SEM linear structural model has many advantages over traditional multivariate analysis methods such as multiple regression and multivariate regression because it can calculate measurement errors and estimate research hypotheses as well as complex research models.
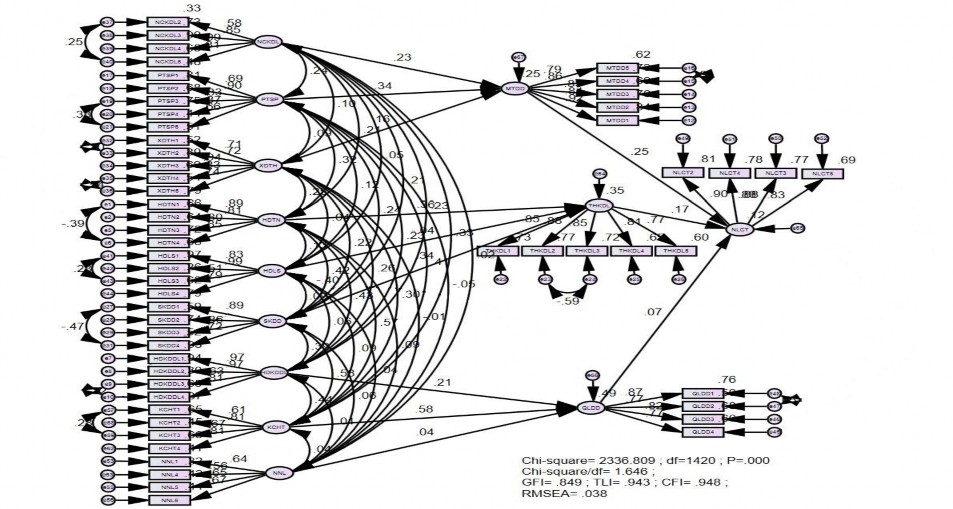
Results of testing the research model using SEM for the first time:
The results of the first SEM research model testing show that:
- The model has 1420 degrees of freedom (df = 1420).
- The model is suitable for market data, because:
+ GFI = 0.849; TLI = 0.943 (> 0.9); and CFI = 0.948 (> 0.9);
+ RMSEA = 0.038 (< 0.08);
+ CMIN/df = 1,646 (< 2).
Table 4.23 Estimated values of the model relationships in the first SEM analysis.
Relationship
Not standardized
SECR P-value weight
MTDD
<--- | NCKDL | 0.302 | 0.064 | 4,752 | *** | |
MTDD | <--- | PTSP | 0.463 | 0.069 | 6,749 | *** |
MTDD | <--- | XDTH | 0.193 | 0.058 | 3,356 | *** |
THKDL | <--- | HDTN | 0.344 | 0.046 | 7,435 | *** |
THKDL | <--- | HDLS | -0.043 | 0.04 | -1,087 | 0.277 |
THKDL | <--- | SKDD | 0.344 | 0.049 | 7.08 | *** |
QLDD | <--- | HDKDDL | 0.157 | 0.036 | 4,329 | *** |
QLDD | <--- | KCHT | 0.844 | 0.098 | 8,576 | *** |
QLDD | <--- | NNL | 0.056 | 0.063 | 0.891 | 0.373 |
NLCT | <--- | QLDD | 0.089 | 0.063 | 1,396 | 0.163 |
NLCT | <--- | THKDL | 0.178 | 0.052 | 3,404 | *** |
NLCT | <--- | MTDD | 0.248 | 0.05 | 4,972 | *** |
Source: Calculation results from a direct survey of 450 tourists in Bac Lieu in 2018.
Note: ***: 1% significance level.
Source: Calculation results from a direct survey of 450 tourists in Bac Lieu in 2018.
Figure 4.10 Model testing results.
153
- The unstandardized weights are all statistically significant (p-value) at 1%, except for the weights of the NNL factor and the HDLS factor which are not statistically significant at p-value = 1%. Therefore, we will remove these factors one by one to run the SEM test again for the second time. Specifically, when running the SEM test for the second time, we will remove the NNL factor.
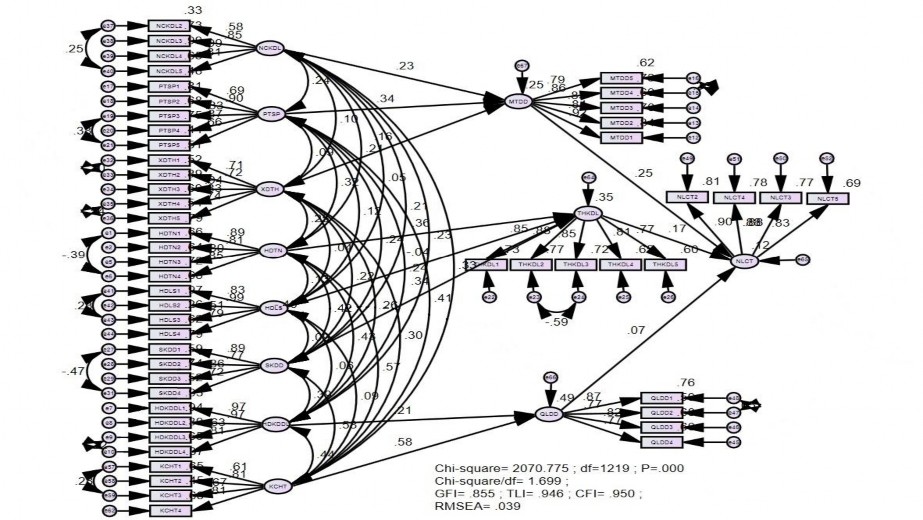
Results of testing the research model using SEM for the second time:
The results of the second SEM test of the research model show that:
- The model has 1219 degrees of freedom (df = 1219).
- The model is suitable for market data, because:
+ GFI = 0.855; TLI = 0.946 (> 0.9); and CFI = 0.950 (> 0.9);
+ RMSEA = 0.039 (< 0.08);
+ CMIN/df = 1,699 (< 2).
Table 4.24 Estimated values of the model relationships in the second SEM analysis.
Relationship
Not standardized
SECR P-value weight
MTDD
<--- | NCKDL | 0.302 | 0.064 | 4,751 | *** | |
MTDD | <--- | PTSP | 0.463 | 0.069 | 6.75 | *** |
MTDD | <--- | XDTH | 0.193 | 0.058 | 3,357 | *** |
THKDL | <--- | HDTN | 0.343 | 0.046 | 7,424 | *** |
THKDL | <--- | HDLS | -0.043 | 0.04 | -1,086 | 0.277 |
THKDL | <--- | SKDD | 0.344 | 0.049 | 7,077 | *** |
QLDD | <--- | HDKDDL | 0.156 | 0.036 | 4,316 | *** |
QLDD | <--- | KCHT | 0.848 | 0.099 | 8,593 | *** |
NLCT | <--- | QLDD | 0.089 | 0.063 | 1.4 | 0.162 |
NLCT | <--- | THKDL | 0.178 | 0.052 | 3,403 | *** |
NLCT | <--- | MTDD | 0.248 | 0.05 | 4.97 | *** |
Source: Calculation results from a direct survey of 450 tourists in Bac Lieu in 2018.
Note: ***: 1% significance level.
- The unstandardized weights are all statistically significant (p-value) at 1%, except for the weight of the HDLS factor which is not statistically significant at p-value = 1%. Therefore, when running the third SEM test, the HDLS factor will be eliminated.
154
Source: Calculation results from a direct survey of 450 tourists in Bac Lieu in 2018.
Figure 4.11 Results of testing the research model using SEM (standardized) for the second time.
155
see:
Results of the third (final) SEM research model testing:
The results of the third (final) SEM test of the research model show that
- The model has 1034 degrees of freedom (df = 1034).
- The model is suitable for market data, because:
+ GFI = 0.868; TLI = 0.954 (> 0.9); and CFI = 0.958 (> 0.9);
+ RMSEA = 0.038 (< 0.08);
+ CMIN/df = 1,654 (< 2).
Table 4.25 Estimated values of the model relationships in the third (final) SEM analysis.
Not standardized
Standardized | |||||||
Relationship | |||||||
Weight number | SE | CR | P- value | Weight | |||
MTDD | <--- | NCKDL | 0.302 | 0.064 | 4,746 | *** | 0.228 |
MTDD | <--- | PTSP | 0.46 | 0.069 | 6,717 | *** | 0.337 |
MTDD | <--- | XDTH | 0.193 | 0.058 | 3,349 | *** | 0.155 |
THKDL | <--- | HDTN | 0.339 | 0.046 | 7.36 | *** | 0.358 |
THKDL | <--- | SKDD | 0.341 | 0.049 | 7,023 | *** | 0.34 |
QLDD | <--- | HDKDDL | 0.185 | 0.042 | 4,432 | *** | 0.211 |
QLDD | <--- | KCHT | 1,021 | 0.112 | 9,118 | *** | 0.593 |
NLCT | <--- | QLDD | 0.173 | 0.057 | 3,052 | *** | 0.171 |
NLCT | <--- | THKDL | 0.173 | 0.051 | 3,373 | *** | 0.167 |
NLCT | <--- | MTDD | 0.198 | 0.049 | 4,065 | *** | 0.196 |
Source: Calculation results from a direct survey of 450 tourists in Bac Lieu in 2018.
Note: ***: 1% significance level.
156