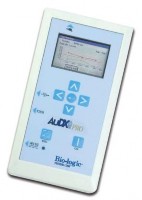
Figure 2.8. American AuDX cochlear sound meter
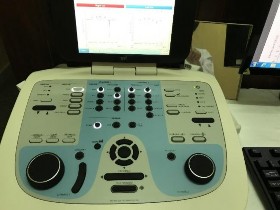
Figure 2.9. GSI Pello Base audiometer (USA)
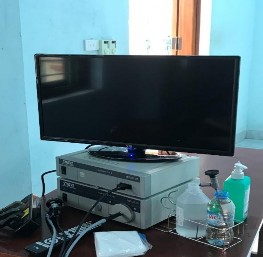
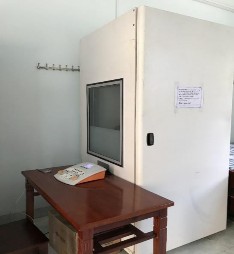
Figure 2.10. Karl – Storz (Germany) ENT endoscopy system
Figure 2.11. 350S Acoustic Booth - Amplivox (UK)
2.1.8.2. Standards for classifying hearing loss levels [35],[93]
dB intensity
Classify | |
≤ 20 | Normal hearing level |
21 – 40 | Mild hearing loss |
41 - 60 | Moderate hearing loss |
61 - 80 | Severe hearing loss |
≥ 81 | profound deafness |
Maybe you are interested!
-
 Current status of hearing loss, some related factors and preventive effectiveness of Mg-B6 supplementation in armored troops in 2017-2018 - 1
 -
 Status of Hearing Loss and Some Related Factors in Armored Corps in 2017
 -
 Some characteristics and risk factors of hearing loss in children from 2 to 5 years old in inner-city kindergartens in Hanoi - 1
 -
 Epidemiological, molecular biological, clinical, paraclinical characteristics and factors affecting the effectiveness of treatment of chronic hepatitis B virus with antiviral drugs - 21
 -
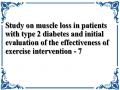 Study on muscle loss in patients with type 2 diabetes and initial evaluation of the effectiveness of exercise intervention - 7
2.1.8.3. Complete monotone audiometry
a) Pure-tone audiometry produces an audiogram: a graph showing the pure-tone hearing threshold (minimum audible sound intensity) at different frequencies by air and bone conduction.
b) Equipment: Using the American GSI Pello Base 2-channel audiometer. 350S Acoustic Booth- Amplivox (UK) mobile soundproof booth
c) Measurement principle:
Subjects undergoing audiometry were stopped from exposure to noise for at least 24 hours and the purpose and response requirements were clearly explained.
d) Assessment of results:
- Hearing status:
Normal: bone and air conduction hearing thresholds at frequencies oscillate around the 0dB axis, never exceeding 20dB
Impairment: air and/or bone conduction hearing threshold higher than 20dB
- Hearing loss category:
Conduction: reduced airway, normal bone conduction
Reception: air and bone conduction decrease in parallel with no difference of more than 10dB
Mixed: air and bone conduction are not parallel and differ by more than 10dB
- Hearing loss level in dB
One ear
Two ears
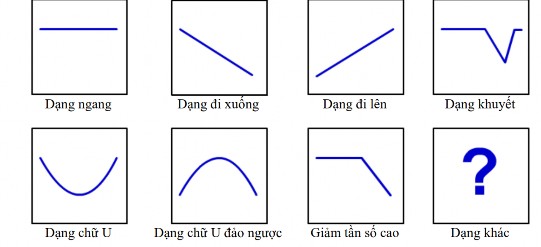
Figure 2.12. Audiogram patterns [45]
e) Audiogram characteristics in noise-induced hearing loss
- To confirm the diagnosis of SGTL and monitor the progression of the disease, a complete pure tone audiogram must be performed. Noise-induced SGTL develops slowly over many years of exposure. Sensitivity varies widely, but generally more than 10 years of exposure are required to cause significant hearing loss. In 1990, Dobie listed the criteria for diagnosing occupational deafness as follows:
DNN is always nerve deafness.
NE is almost always bilateral.
High frequencies rarely exceed 75 dB and low frequencies rarely exceed 40 dB.
Deafness does not progress after stopping exposure to noise.
Audiogram shows increased hearing threshold at 3000-6000 Hz compared to 500-2000 Hz. The increase in hearing threshold is usually greatest at 4000 Hz. The 4000 Hz defect usually remains the same even in later stages.
- Under conditions of continued exposure to harmful noise, the increase in hearing threshold will spread to the frequencies of 3000, 4000 and 6000 Hz, usually reaching a maximum after 10 - 15 years [88].
- In noise-induced SGTL, the cochlear hair cells are damaged by exposure to excessively loud sounds. The basilar membrane is sensitive to low frequencies arranged at the top and high frequencies at the bottom [87]. On the basilar membrane, the outer hair cell region corresponding to the frequency of 4 kHz and the neighboring regions of 3 and 6 kHz are most vulnerable [67], [86]. In terms of audiology, Fowler [38] was the first to note the 4 kHz defect due to noise.
2.1.8.4. Tympanometry
a) Tympanometry is a method to evaluate middle ear function. The results of tympanometry are shown in a graph called a tympanogram. Tympanogram shows the relationship between external air pressure and the impedance of the middle ear system.
- Equipment: using GSI 39 tympanometer, USA
- Measurement technique: before measuring tympanometry, the patient's ear canal is examined and cleaned. Select a probe with a suitable earplug that fits snugly into the subject's ear canal, the machine automatically prints the result chart.
- Evaluation of tympanogram results: evaluation of cases with abnormal middle ear conditions (tympanic membrane, ossicular chain, eustachian tube) that have not been detected through routine ENT clinical examination.
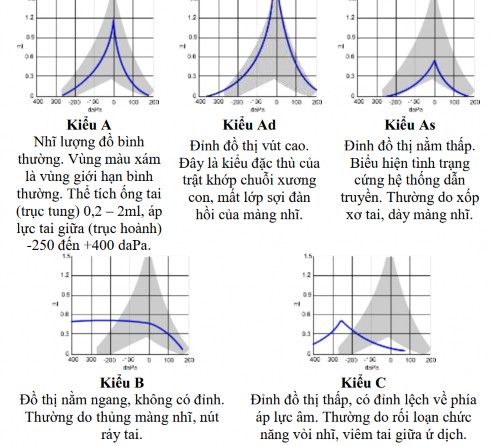
Figure 2.13. Tympanometry classification according to Jerger [59]
2.1.9. Implementation organization
Coordinate with military medical units to organize examinations at the infirmary 500m away from the unit, with separate examination rooms arranged in the order of administrative recording area - form recording area - ENT endoscopy examination area - hearing examination area. Doctors in the research group will answer any unclear points when the research subjects answer the form themselves, directly with the ENT endoscopy examiner, and the audiometric technician of the ENT department.
– 108th Military Central Hospital.
2.2. The effectiveness of Mg-B6 in preventing hearing loss in armored cadets in 2017-2018
2.2.1. Research subjects
a) Criteria for selecting research groups
- Male soldiers, new recruits working in units of the Armored Corps participating in crew training courses.
- No ear diseases
- Pure tone hearing test, normal tympanic volume
Exclusion criteria
ENT examination for chronic ENT diseases
b) Criteria for selecting control group
Similar to the research group, stay in the same training course.
c) Definition of hearing loss after training:
- Has a hearing threshold > 20dB at any frequency 500, 1000, 2000 and 4000Hz.
- Examination of the outer and middle ear is normal, tympanometry is normal.
2.2.2 Time and place of research
The study was conducted from June 2017 to December 2017 at the Armored Corps School.
2.2.3. Research design
Double-blind, controlled, community intervention study.
2.2.4. Sample size and sampling method
2.2.4.1. Sample size
Apply the formula to estimate the difference between two proportions, according to WHO as follows:
(𝑍α √2p(1−p)+ 𝑍 1−β √𝑝 1 (1−𝑝 1 )+𝑝 2 (1−𝑝 2 )) 2
n 1 = n 2 =
1− 2
(𝑝 1 −𝑝 2 ) 2
In which: n is the minimum sample size of each intervention group and control group; p1 is the hearing loss rate of the control group after the intervention, p1= 0.15 results from a study by Gordon on SGTL on conscripts after training [44], p2 is the hearing loss rate of the intervention group at the time after the intervention, estimated at 0.03, p is the average change in the hearing loss rate
𝑝 1 + 𝑝 2
p= ; 𝑍 1−α= 1.96 (corresponding to 95% confidence level), Z 1−β = 0.80 (corresponding to sample force
2
2
80%).
Filling in the values, we get the calculated sample size for each group as 89 subjects. In the study we took 100 students per group.
2.2.4.2. Sampling method
- Of the 2 armored cadet battalions, randomly select 1 battalion for the intervention group and 1 battalion for the control group.
- In each selected battalion, a list of new recruits is made, then 100 recruits are randomly selected by computer in each group.
2.2.4.3. Intervention
- Intervention group (100 people): use Mg-B6, take 4 pills per day, divided into 2 times for the first 10 days of each month during the 6-month training course. Mg-B6 is manufactured by MEKOPHAR Company, meeting GMP-WHO standards, company address: 297/5 Ly Thuong Kiet, District 11, Ho Chi Minh City, Vietnam.
- Control group (100 people): use placebo, take 4 pills per day, divided into two times for the first 10 days of each month during the 6-month training course. The placebo produced by MEKOPHAR Company does not contain any medicinal ingredients inside.
- Oral medication regimen is supervised and inspected by the unit's medical staff.
- The drugs used in the control and intervention groups were removed from the blister packs and distributed in sealed, moisture-proof plastic packages, differing only in the symbols A and B. Both the recruits and the researchers were blinded to who was in the intervention or control group. At the end of the study and after data processing, the label symbols were opened from the sealed envelopes kept by the manufacturer.
2.2.5. Data collection method
Information was collected before and after the intervention corresponding to the start of the training course in June 2017 and the end of the training course in December 2017, basically similar to that for objective 1.
- Collecting personal information: Information on subjective symptoms and related factors using a pre-designed unified questionnaire. The research subjects answered the questionnaire themselves, and the researcher explained any unclear points.
- Measure hearing at 4 frequencies 500, 1000, 2000 and 4000Hz in a mobile soundproof booth at the time the student rests without exposure to noise for 24 - 48 hours.
- ENT examination equipment: Karl Storz ENT endoscope (Germany);
- Audiometric equipment: GSI Pello monotone audiometer (USA); GSI 39 tympanometer (USA); 350S Acoustic Booth- Amplivox (UK) mobile soundproof booth.
- All subjects underwent ENT endoscopy and had blood drawn to quantify basic biochemical indices and blood Mg concentration.
- Paraclinical test results were performed by the biochemistry department of 108 Central Military Hospital.