The information about the individual respondents is the basis for the one-sample T-test and in-depth ANOVA analysis in the next chapter.
Thus, the number of valid samples collected in this survey is 183 votes, which is suitable for the minimum sample size condition. Therefore, the collected sample ensures reliable representation of the overall crowd.
Before going into the data processing, the personal descriptions of the respondents also need to be presented and summarized.
Regarding gender, female respondents accounted for 82.5% (151 votes), the remaining 17.5% (32 votes) were male.
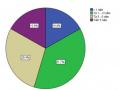
In terms of age, respondents under 26 years old accounted for nearly half with a corresponding rate of 49.1% (86 votes). Next were respondents from 26 to 31 years old accounting for 19.4% (34 votes). The remaining respondents over 31 years old accounted for 36% (63 votes).
Regarding professional qualifications, 53.7% (94 votes) of respondents had high school qualifications, 8.6% (15 votes) had intermediate/vocational secondary qualifications, 18.3% (32 votes) had college qualifications and 24% (42 votes) had university qualifications.
Regarding seniority at EAV, the majority of respondents (122 votes, 69.7%) have worked for EAV for less than 2 years, 42 votes (24%) have worked for 2-4 years and 10.9% (19 votes) have worked for more than 4 years.
Regarding job titles in the company, operational staff accounted for 58.9% (103 votes). Team leaders and controllers accounted for 41.1% (72 votes). Department heads/deputy heads accounted for 4.6% (8 votes).
The descriptive statistics results of the survey sample are summarized in the following table:
Table 5-1: Survey sample description information
Personal characteristics (n = 183 )
Frequency | % | % accumulated | |
Sex | |||
Female | 151 | 82.5% | 82.5% |
Male | 32 | 17.5% | 100.0% |
Degree of repair | |||
< 26 | 86 | 49.1% | 49.1% |
26 - 31 | 34 | 19.4% | 68.6% |
> 31 | 63 | 36.0% | 104.6% |
Education level | |||
PTTH | 94 | 53.7% | 53.7% |
Intermediate | 15 | 8.6% | 62.3% |
College | 32 | 18.3% | 80.6% |
University | 42 | 24.0% | 104.6% |
Years of service at the company | |||
< 2 years | 122 | 69.7% | 69.7% |
2 - 4 years | 42 | 24.0% | 93.7% |
> 4 years | 19 | 10.9% | 104.6% |
Current position | |||
Operational staff | 103 | 58.9% | 58.9% |
Line Manager/Supervisor | 72 | 41.1% | 100.0% |
Head/Deputy Head of Department | 8 | 4.6% | 104.6% |
Maybe you are interested!
-
 Descriptive Statistics of Observed Variables Tangible Media Factor
 -
 Descriptive Statistics on Banking Service Usage
 -
 Commonly Used Variables Reflecting the Descriptive Criteria of the Dimensions of the Space Matrix
 -
 Descriptive Statistics of Number of Loans of Families with Student Loans
 -
 Descriptive Statistical Analysis of Independent and Dependent Variables
5.1.2 Results of descriptive statistical analysis
5.1.2.1 Descriptive statistics of component factors
The analysis results show that Esquel employees rate the main factors at an average level, in which the factor “Nature of work” has the highest mean value (3.5451). However, there is no significant difference between the mean values of the factors. This shows that employees rate the importance of
relatively similar factors due to working in the same environment (See Appendix 17.1).
5.1.2.2 Descriptive statistics of observed variables of each factor
All observed variables were rated at an average of above 3 on a 5-point Likert scale.
For the factor “Nature of the job”, the observation variable cv1 “The job is suitable for my ability” reached the highest level in the group and also the highest in the scale (3.5847). This shows that employees have been recruited and assigned work reasonably.
Regarding “Salary & Benefits”, although admitting that “My current salary is commensurate with my ability” (lg1 – at 3.4809), according to many exit interviews, employees in the “line manager/supervisor” group in the front office area are not very satisfied with their salary because of the huge difference compared to the responsibilities and duties they have to undertake compared to the “Employee” group.
As for “Recognition & Reward”, all observed variables show the good side of this factor, but through the lowest rating in the group of 3.1694 for kt1 “The company promptly recognizes the contributions of employees”, it shows that the company should improve this because when an event is left for a while, its effect will be greatly reduced.
The factor “Training & Development”, through the highest and lowest evaluation scores for the two observed variables dt3 and dt2, reflects that although Esquel has organized and created many opportunities for employees to learn and develop, the courses may still be scattered, not focused on each specific target group, so many people still do not have enough necessary skills for their specific jobs. Esquel needs to focus on this issue in its human resource development strategy in 2013.
Finally, for “Loyalty”, the observed variables have the lowest average rating compared to other components, but it cannot be concluded that Esquel employees do not want to work for the Company for a long time because the average value is still above the average. Variable tt6 “If the company is in trouble, I will try my best to serve” has the lowest rating in the group (3.0601), showing that the general trend of employees is that they often do not value “I am for everyone” but often have an attitude of “fair exchange”. However, it would be great if the Esquel Board of Directors knew that employees here highly appreciate tt1 “I feel proud to introduce this company to others”. And this further motivates the HR department staff to promote the “Labor introduction” policy among the company’s employees.
5.1.3 Preliminary test of scale reliability
5.1.3.1 Summary of conditions in assessing the reliability of the scale
Many researchers agree that Cronbach's Alpha from 0.8 or above is close to
1.0 is a good measurement scale, from 0.7 to close to 0.8 is usable. Some researchers also suggest that Cronbach's Alpha from 0.6 or higher is usable in cases where the concept under study is new or new to the respondents in the research context [8].
According to Hair (1998), the item-total correlation coefficient should be > 0.5 and Cronbach's Alpha should be ≥ 0.7. For Cronbach's Alpha test in this study, the following conditions for accepting observed variables are recommended:
Cronbach's Alpha value must be ≥ 0.7
The lowest variable-total correlation coefficient in the component must be > 0.5
5.1.3.2 Preliminary test of Cronbach's Alpha reliability for the scale
As introduced in the theoretical basis section, the scale of employee loyalty
Esquel Vietnam employee satisfaction survey consists of 34 variables measuring 7 components: Nature of work, Salary and benefits, Working environment, Recognition and rewards, Training and development, Leadership/superior, Loyalty. A 5-level Likert scale is used, in which level 1 is Strongly disagree and level 5 is Strongly agree. The test results of each component are shown in the following table:
Table 5-2: Summary of preliminary Cronbach's Alpha test results for the scales
STT
Ingredient | Number of variables | Cronbach's Alpha ( ≥ 0.7) | |
1 | Nature of work | 4 | .881 |
2 | Salary and benefits | 5 | .896 |
3 | Working environment | 5 | .893 |
4 | Recognition and rewards | 4 | .897 |
5 | Training and development | 5 | .841 |
6 | Leadership/Superior | 4 | .813 |
7 | Loyalty | 5 | .851 |
The Cronbach's Alpha reliability coefficient of the observed variables shown in Table 5-2 above shows that the component variables intended to be measured all have Cronbach's Alpha coefficients > 0.7. On the other hand, the item-total correlation coefficient in each component is higher than 0.5, except for the Leadership/Superior component with variable ld5 ("I receive the trust of my superiors when assigning work.") with an item-total correlation coefficient of only 0.346.< 0.5 and the Loyalty component with variable tt5 (“I am willing to sacrifice personal interests when necessary to help the company succeed”) has a variable-total correlation coefficient of only 0.304< 0.5 (very low, not meeting the initial conditions) (See Appendix 10)
After eliminating the above two variables, the test results showed that the Cronbach's Alpha of the two groups was 0.853 respectively.and 0.892 , higher than the initial 0.813 and
0.851 (See Appendix 10) and the remaining observed variables of the components continued to be included in factor analysis.
5.1.4 Exploratory Factor Analysis (EFA)
5.1.4.1 Summary of conditions in EFA assessment
When analyzing exploratory factors, researchers often pay attention to some criteria to check the suitability of the model as follows [8]:
The KMO coefficient ( Kaiser-Meyer-Olkin ) must be ≥ 0.5 and the significance level of the Bartlett test must be ≤ 0.05.
According to Gerbing & Anderson, the scale is accepted when the total variance extracted from the model (Total Variance Explained) must be ≥ 50% and the extracted factors must have Eigenvalue greater than 1.
Factor loading must be > 0.5. If any observed variable has the highest factor loading ≤ 0.5, it will be eliminated.
The final condition is that the difference in the highest factor loading coefficient of an observed variable on the factor it measures compared to the remaining factors must be ≥ 0.3 to ensure discriminant value between the factors (meaning it must load strongly on the factor that the variable measures).
When analyzing EFA for the independent variable scale and dependent variable scale, the Principal Component Analysis (PCA) method with Varimax orthogonal rotation and the stopping point criterion when extracting factors with Eigenvalue > 1 were used to interpret the EFA results.
5.1.4.2 Factor analysis for independent variables
The Cronbach's Alpha test results in the previous step showed that the variable ld5 had a variable-total correlation coefficient of only 0.346.< 0.5 should be eliminated. Therefore, only 27 variables continue to be included in EFA analysis to preliminarily test the scale by Principal Component extraction method with Varimax rotation. Variables with factor loading coefficients less than 0.5 or with factor loading coefficients between factors
Equal numbers will be eliminated one by one.
Table 5-3: Factor rotation matrix
Adjusted factor rotation matrix (with variable dt4 removed) for the scale
Observation variable | Extractable factors | |||||
1 | 2 | 3 | 4 | 5 | 6 | |
mt2 | .812 | |||||
mt5 | .796 | |||||
mt4 | .761 | |||||
mt3 | .760 | |||||
mt1 | .759 | |||||
kt1 | .812 | |||||
KT2 | .810 | |||||
KT3 | .780 | |||||
KT4 | .721 | |||||
cv4 | .871 | |||||
cv1 | .813 | |||||
cv3 | .742 | |||||
cv2 | .638 | |||||
lg2 | .773 | |||||
lg4 | .707 | |||||
lg1 | .665 | |||||
lg3 | .646 | |||||
dt1 | .821 | |||||
dt5 | .652 | |||||
dt3 | .630 | |||||
dt2 | .580 | |||||
ld3 | .796 | |||||
ld1 | .779 | |||||
ld2 | .658 | |||||
ld4 | .567 | |||||
Extraction Method: Principal Component Analysis. Rotation Method: Varimax with Kaiser Normalization. | ||||||
a Rotation converged in 6 iterations. | ||||||
The preliminary EFA test results (see Table 5-3) show that, after 2 tests, 2 observed variables (lg5 and dt4) were eliminated. After eliminating these 2 variables to re-perform the adjusted EFA (see Appendix 11), we can conclude that the scale in the topic
This after removing the variable is suitable because it satisfies the conditions:
KMO coefficient = 0.877 is acceptable because > 0.5.
All 4 extracted factors have Eigenvalue > 1 and the total variance extracted from the model is 74,011, meaning that the 6 new factors explained more than 74% of the model.
All variables have the highest loading factor > 0.5 and the variables are in the same group.
all load strongly on the factor it is intended to measure.
The remaining loading factors on each variable are lower than the highest loading factor of the variable.
with a difference of > 0.3.
Also from Table 5-3, we see that the variables mt1, mt2, mt3, mt4 and mt5 have the highest loading factor concentrated in column 1. This shows that they have created a separate factor from the remaining variables. Such results are consistent with our initial prediction before testing the scale. We can name this factor "Working environment". Next, the variables kt1, kt2, kt3 and kt4 form the factor "Recognition and rewards". Next, the variables cv1, cv2, cv3 and cv4 form the factor "Nature of work". The variables lg1, lg2, lg3 and lg 4 form the factor "Salary and benefits". The variables dt1, dt2, dt3 and dt5 form "Training and development". Finally, the variables ld1, ld2, ld3 and ld4 form the factor “Leadership/superior”.
So the scale for the independent variable still has the following questions: