Table 1.1: Overview of EMA environmental costs
Environmental information
Air/climate | Waste water | Water | Soil/groundwater | Noise/Vibration | Biodiversity/ landscape mandarin | Radiation | Other environmental costs | Total | |
1. Water and waste treatment | |||||||||
2. Prevention and management work environmental | |||||||||
3. Cost of purchasing raw materials non-product output | |||||||||
4. Cost of processing non-product output product | |||||||||
Total environmental cost | |||||||||
5. Environmental revenue |
Maybe you are interested!
-
 Suitable waste business management model for Vietnam - 13
 -
 Inspiration and religious material in the poetry of Han Mac Tu and Huy Can - 1
 -
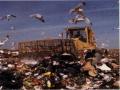 Impact of Improper Solid Waste Disposal
 -
 Improving the efficiency of raw material import activities at C&T Construction and Materials Trading Joint Stock Company - 2
 -
 Current status of material accounting at Viet Tri Viglacera Joint Stock Company - 11
(Source: C. Jasch, Environmental and Material Flow Cost Accounting: Principles and Procedures, Eco-Efficiency in Industry and Science 25)
The EMA procedure is to calculate and report the cost or rate for each cost item according to those 8 categories. If there is no activity or maintenance associated with a category, then that category is excluded from the analysis. A detailed study of the cost (or revenue) for each of these categories is provided in the UNDSD report [34].
The UNDSD EMA reporting scheme divides four types of environmental costs and one type of environmental revenue as follows:
3.1. Item 1: Waste treatment costs.
This category includes many costs traditionally referred to as “end-of-pipe costs”. UNDSD proposes that the consolidation and allocation of costs fall into the following seven categories [34]:
- Equipment depreciation: Includes end-of-pipe treatment equipment to minimize the environmental impact of waste and emissions. Treatment equipment such as: garbage containers, wastewater treatment plants and waste in pipeline technology, waste treatment equipment (solid waste separation, transportation and compression equipment), on-site waste treatment equipment, waste and emission treatment equipment (wastewater treatment systems, desulfurization, NOx removal, noise reduction equipment). When calculating the depreciation of this equipment, it is necessary to consider whether the equipment is closely integrated with production equipment. If this equipment is separate, the depreciation is based on the initial investment cost, if integrated with production equipment, it is necessary to calculate the percentage of investment costs related to environmental protection equipment.
- Maintenance and operation of resources and services: These materials are determined after specifying the environmental treatment facilities related to equipment depreciation. Annual costs for materials, maintenance and inspection operations and other costs to operate the treatment equipment are included in this account.
- Labor-related costs: This sub-account includes all labor costs for manual waste and emissions handling time in investment activities, maintenance (maintenance of wastewater treatment plants), waste treatment (waste segregation, collection, inspection, internal transportation), waste and emissions handling (operation of wastewater treatment plants and incinerators), on-site landfill management, regulatory compliance (monitoring, recording, inspection, notification and training). This cost is paid for all full-time workers who collect and process waste directly, the salary of the management department, supervision of waste handling activities and work are also included in this sub-account, based on estimates.
- Wages, bonuses, taxes: This account includes all costs of garbage collection and sewer cleaning and licensing costs, environmental taxes (if any).
- Fines: This account includes fines paid for non-compliance with regulations.
- Insurance for environmental risks: This sub-account includes the amount of insurance premiums for risks related to the environment, insurance for the accidental creation of hazardous materials. The annual costs for insurance are recorded in
profit and loss accounts. But if insurance is paid, companies must regularly refer to the bills. So even with insurance risks, there may still be losses for the company. This type of cost is suitable for specific industries, mainly related to the transport of dangerous goods or the increased risk of certain energy efficiency.
- Provisions for cleaning and repair costs, compensation: The purpose of provisions is to calculate and anticipate costs arising from the company's activities related to the environment (for example, oil spills, chemical leaks).
The US Environmental Protection Agency (EPA) has proposed the implementation of full cost accounting (FCA) in which FCA is the allocation of all direct and indirect costs to a product or product line [36]. The EPA provides an example [5]: the recalculation of costs in the appropriate service categories in the Department of Public Works of Columbia, Missouri, was higher than the total cost. The full costs of recycling, composting, household waste, commercial waste, segregated waste, university waste, and mixed waste disposal were 29%, 17%, 28%, 22%, 19%, 53%, and 124% higher than previously calculated, respectively [38]. Canon followed the environmental accounting guidelines of the Japanese Ministry of the Environment [23]. The guidelines include the following cost categories: commercial area; input/output analysis; administration, R&D, social activities, reconciliation and other expenses. Canon reported 17.1 billion yen in environmental costs in 2003 and 23 billion yen in savings [38],
The 5.9 billion yen difference is evidence of positive economic and environmental effects. The most difficult item in this category is environmental risk insurance, which will secure future investments.
3.2. Category 2: environmental prevention and management
This cost category covers the prevention of environmental impacts and the management of environmental programs. This type of cost includes:
- Outsourced services for environmental management: This cost includes payments for environmental consulting, training, testing, auditing and communication services.
- Personnel for general environmental management activities: Compensation for employees working in environmental programs such as training, auditing, implementation and advocacy activities.
- Research and development: Both outsourcing contracts and in-house employee remuneration for environmentally relevant research and development activities are accounted for separately. Research and development activities are enhanced if there is an improvement in the environment and will be recorded in the reports under this item.
- Additional costs for cleaning technology: Are additional investments to install cleaning technology that allows for more efficient production processes, reduces or prevents emissions to the environment. Includes depreciation costs of environmental equipment, operating materials, water and energy related to new cleaning technology.
- Other environmental management costs: Other costs related to environmental management recorded here include: costs for environmental activities such as coordinating funding for environmental activities and issuing environmental reports, contributing to environmental initiatives or nature conservation in the company's policy or social responsibility organization. Examples of prevention-related fees are: registration fees for labeling according to environmental projects, fees for issuing environmental standard certificates.
Although a separate category, environmental prevention and management costs are often misunderstood because they are often combined with waste and waste disposal costs (category 1). For example, at the 400-bed Dartmouth Hitchcock Medical Center in the United States, it was found that all waste disposal costs [22] were allocated to the Environmental, Health, and Safety (E, H&S) function and not to the department that generated the waste. Responsibility for the safe and correct disposal of medical waste was assigned to E, H&S to ensure that waste generators did not mishandle waste in order to reduce costs [22]. Environmental management responsibilities therefore often conflict with financial management responsibilities at the
implemented if the relevant departments do not clearly understand the costs of their waste and emissions.
3.3. Category 3: Material purchase value of waste and emissions
All non-product waste is assessed through a material flow balance and waste materials are valued at their purchase value. The notion that the inputs to a commercial product will either be environmentally friendly or become inefficient waste is an important insight that challenges traditional notions of what is acceptable for sale and what is acceptable for inefficiency. This cost account has the following subaccounts:
- Raw materials: This type of cost includes all types of raw materials that go into the production process but do not become finished products but are eliminated as solid waste, wastewater or exhaust gas.
- Packaging: The purchase value of waste packaging materials is included in this cost category.
- Indirect materials: Indirect materials are part of the product but are not the main ingredient. This type of cost refers to the auxiliary materials that are discarded during the production process.
- Operating materials: This type of cost includes all materials used in the company's operations (office waste) but are not components of the product. For example, chemicals, solvents, detergents and other types that go along with the waste.
- Energy: Includes the proportion of energy conversion processes that are not useful in production activities.
- Water: This cost type synthesizes all other raw materials, transferred to wastewater treatment equipment including the cost of purchasing water sources there.
EPA research [38] found that the resulting cost of wasted materials in electroplating (coating materials, catalysts, additives, cleaning agents, and water) is the hidden cost of material waste that can be divided into two sources – the difference between the amount of coating material purchased and the amount of metal consumed, and the difference between the amount of metal consumed and the amount actually required to plate the product [37]
3.4. Item 4: waste treatment costs
This category is only available to businesses that have production and resource exploitation activities. Includes sub-categories:
Products and by-products: Products include all physical products and packaging. By-products are incidental products produced during the production of main products.
Non-product outputs include: waste, wastewater, exhaust gas….Any output that is not a product is called a non-product output (NPO). The wastes are in the form of solid, water or gas.
This cost includes wasted labor, depreciation and consumable operating materials in the amount of raw materials used in production but not created into finished products and become waste.
A study of the Australian company GH Michell & Sons is instructive [24]. Michell generates over A$500 million in annual revenue, producing 30 to 35 million kg of wool products at several mills across Australia each year. The poorer quality of wool at Michell is due to the carbonization of wool, which removes dirt, fibre and soluble salts. The inputs to the process are water, bleach, acid, sodium… labour and machinery. By-products are lanolin, sludge, wastewater and damaged fibres. The study found that the consumption of “dirty wool” is subsidised by “clean wool”. However, the amount of dirty wool recovered is not related to the costs of processing wool. Since the price paid by the wool trader depends on the process costs, the decision to purchase and process wool is very important for the final stage. “Dirty wool” incurs more process costs. However, none of these costs are related to the amount of wool recovered from each bale processed. If these costs were recalculated to reflect the recovery price, the planned balance would change and would affect business decisions.
3.5. Category 5: environmental revenue
This category includes actual income from recycled materials, subsidies and cash awards for environmental activities.
- Subsidies and bonuses: This type of income includes subsidies, tax exemptions, bonuses and other types of income received as a result of achieving environmental performance standards.
- Other income: Income from the sale of recycled products and surplus in waste treatment fall into this category of expenses.
Companies are expected to report revenue from recycling, but this is a difficult category to measure. Low revenue may be a reason for the silence. For example, Tellus reported that recycling utilization in one type of equipment generated a profit of $500 from mixed paper and $62 from plastics and glass. Compared to the total cost savings of $23,859 from the plan, the profit was only 2.4% of the savings, the majority of which came from reducing waste disposal costs (category 1). This result may suggest that recycling often leads to cost savings rather than profits. While cost savings may seem similar to profits, the focus of the environmental revenue category is on external sources of profit. An example of environmental revenue is the consumption of by-products. According to Deegan the carbonisation process produces poor quality wool at Michell resulting in large amounts of by-products such as oily wool and broken warp fibres. Michell can either dispose of these by-products as waste and pay to bury them or they can sell them. The oily wool sells for around $2 AUD/kg and has many uses. The broken warp fibres are sold as a lower grade wool product for many other processes and products.
4. Integrating Environmental Management Accounting with Eco-efficiency
In general, efficiency measures the relationship between the outputs and inputs to a process. For a given input, the higher the output and the lower the input, the more efficient the business's production operations are.
Efficiency is a multidimensional concept. The output and input factors of the unit being evaluated may be different. If output and input are viewed in financial terms, efficiency usually refers to profitability or financial performance. Typical profitability measures include return on sales, return on equity on tax assets, etc. Economic efficiency indicates whether social activities are sustainable in the long run and in the
How long. Technically, it is usually focused on tangible measures such as kg…. Productivity measures include: output per hour, output per worker. The difference between the best possible efficiency rate and the actual efficiency rate achieved is the X-Efficiency. The concept of X-Efficiency is very useful. It shows that in practice, organizations minimize costs (using the latest technology) rather than imitate their competitors in adopting different policies and complying with industry standards and targets. This happens when these organizations are inefficient. X-Efficiency calculates the range of low technical performance. Because like the ratio between output and input parameters, efficiency does not depend on financial or technical parameters.
While efficiency is the ratio of output to input, eco-efficiency can be considered as the relationship between input assessment criteria and environmental impact output assessment criteria [23]:
Eco-efficiency = Output / Incremental environmental impact
The incremental environmental impact is a criterion by which all environmental impacts have been assessed according to their respective environmental impacts [22].
Ecological efficiency can also be understood as the ratio between added value and added environmental impact, or the ratio between an economic performance index and an ecological performance index.
The following are eco-efficiency indices - measures of eco-efficiency:
- Waste volume / revenue (Kg/$)
- Waste reduction/ new technology investment costs (m 3 /$)
- Raw material quantity (production process)/ Energy requirement (production process) (kg/$)
- CO 2 emissions / Profit before tax (kg/ $)
- Net Present Value (NPV)/ Global Climate Change Potential ($/ kg CO 2 – eq)
- Product X revenue/ Total product X waste ($/ton)
- Marginal Growth/ Hazardous Waste Potential ($/ HTP)