Job security, Nature of work, Organizational culture and Job satisfaction (See Appendix 2 for details).
3.3.2. Selecting research samples
Research data was collected by the author from survey questionnaires for officers and employees working at statistical agencies.
According to Hoang Trong and Chu Nguyen Mong Ngoc, "the sample size must be at least 5 times the number of observed variables". Thus, in this study, the author used a minimum number of research questionnaires corresponding to 34 observed variables: 5 x 34 = 170 observations. However, to ensure the persuasiveness and quality of the model results, the author conducted a survey of 250 questionnaires and collected 242 questionnaires, of which 234 were valid, so the author conducted a survey to include 234 valid questionnaires in the model analysis.
3.3.3. Data collection method
The data collection process was by distributing pre-printed questionnaires to respondents and receiving the results after completion. The distribution of the questionnaires was carried out at the Statistical Offices. The data collection and processing period was from July to September 2017.
The data collection process was carried out by the author as follows:
(1) Select 250 individuals to be surveyed.
(2) Send the survey form to the subjects who are officers and employees working at the Statistical Agencies through the direct sending method, and clearly explain how to answer.
(3) Receive back the completed surveys. In cases where the meaning of the results is unclear, the author will meet directly to ask for opinions.
(4) The total number of collected survey forms was 242 (250 forms were issued) and the valid and invalid forms were screened. Finally, the total number of valid forms was 234.
3.3.4. Data analysis method
3.3.4.1. Data checking and cleaning
The author's research method focuses on the overall analysis of survey data obtained from field surveys. The purpose of checking and cleaning data is to
Data cleaning and preliminary description (data arrangement, diagrams, calculation of initial statistics, mean, standard deviation, extreme values, quintiles, cross-tabulation), review of overall satisfaction, data display, data structure, classification according to survey method.
Because data sets can have errors, mistakes or omissions. Questions are not always easy to understand, interviewees do not always know how to give the necessary answers, the spirit of the investigation, the nature of the question is not always understood. After being coded in digital form, it is easy to lead to incorrect coding or missing data. Therefore, the author needs to check and review all data before using it for his analysis.
3.3.4.2. Sample descriptive statistics
Descriptive statistics are used to describe the basic characteristics of data collected from experimental studies in various ways. Both descriptive and inferential statistics provide simple summaries of samples and measures. Together with simple graphical analysis, they form the basis of any quantitative analysis of data. To understand phenomena and make informed decisions, it is necessary to understand the basic methods of data description. There are many commonly used techniques. These techniques can be classified as follows: Graphical representation of data in which graphs describe data or help compare data; data representation in tables summarizing the data; Summary statistics (in the form of single statistical values) describe data. Used to describe again. Tools of the method: Mean, percentage, or absolute numbers, relative numbers, averages.
For this study, the author based on the number of collected and valid observation samples, conducted descriptive statistics on criteria such as: gender, age, education level, position, and seniority.
(1) Gender: Male and Female.
(2) Position: Employee, Manager.
(3) Age: Under 30, From 30 to 44 years old, From 45 to 55 years old, Over 55 years old
(4) Years of service: Under 5 years, From 5 to 10 years, Over 10 years.
Doctor.
(5) Education level: High school, Intermediate, University and College, Master, Doctorate
3.3.4.3. Reliability check
To assess the reliability of the scales, the author conducted coefficient analysis.
Cronbach's Alpha was used first to eliminate inappropriate variables.
Many researchers agree that:
i) Cronbach's Alpha coefficient from 0.8 or higher to close to 1 means the measurement scale is good.
ii) From 0.7 to close to 0.8 is usable.
iii) Some researchers also suggest that Cronbach's Alpha from 0.6 or higher can be used in cases where the concept under study is new or new to the respondents in the research context (Hoang Trong and Chu Nguyen Mong Ngoc, 2008).
Therefore, for this study, Cronbach's Alpha from 0.6 or higher is acceptable. Variables with a total item correlation coefficient less than 0.30 and scale components with a Cronbach's Alpha coefficient less than 0.60 will be considered for elimination (Hoang Trong and Chu Nguyen Mong Ngoc, 2005).
3.3.4.4. EFA factor analysis
After preliminary evaluation of the scale using Cronbach's Alpha coefficient, the extraction method chosen for factor analysis is Principal Components Analysis with Promax rotation. The next step in analyzing the factors in this study, the author conducts a test of the appropriateness of exploratory factor analysis EFA through the Kaiser-Meyer-Olkin (KMO) coefficient. To use EFA, KMO must be greater than 0.5 (0.5 ≤ KMO ≤ 1). In case KMO < 0.5, the data may not be suitable for exploratory factor analysis (Nguyen Dinh Tho, 2011).
The Eigenvalue criterion is a commonly used criterion in determining the number of factors extracted in EFA analysis. With this criterion, the number of factors is determined at the factor with a minimum Eigenvalue of 1. In addition, the total variance extracted (TVE) needs to be considered, this total must be greater than 0.5 (50%), meaning that the common part must be greater than the specific part (Nguyen Dinh Tho, 2011).
Factor loadings or factor weights represent simple correlations between variables and factors, used to assess the significance of
EFA. According to Hair et al. (1998), Factor loading > 0.3 is considered to be the minimum level; Factor loading > 0.4 is considered important; Factor loading > 0.5 is considered to have practical significance. In addition, the difference between factor loading coefficients of an observed variable must be greater than 0.3. However, similar to Cronbach's Alpha, the removal of observed variables requires consideration of the content contribution of that variable to the research concept (Nguyen Dinh Tho, 2011).
3.3.4.5. Correlation analysis
The author uses the correlation method with the Pearson correlation coefficient, denoted by the letter “r”, the value is in the range -1 ≤ r ≤ +1. If r > 0 shows a positive correlation, otherwise, r < 0 shows a negative correlation. The value r = 0 indicates that the two variables do not have a linear relationship.
i) r 1: the relationship between two variables is stronger
ii) r 0: the relationship between two variables is weaker
The significance level “sig” of the correlation coefficient is as follows:
i) Sig. < 5 % : quite close correlation
ii) Sig. < 1 % : very strong correlation
iii) Sig. > 5 % : no correlation
3.3.4.6. Regression analysis
Regression analysis is an important step in determining factors that affect job satisfaction after assessing the reliability of the scale, factor analysis, and correlation analysis. With the results obtained from regression analysis, the author analyzes the suitability of the model, concludes the impact of factors on job satisfaction, and checks for autocorrelation and multicollinearity.
Chapter 3 Summary
In chapter 3, the author has shown the research process of the topic, the research model, as well as the necessary issues in collecting data from the survey and the analysis steps such as: questionnaire design, investigation steps, descriptive statistics of data and performing the necessary analysis when running the regression model to show the level of influence of the factors.
CHAPTER 4
RESEARCH RESULTS
Chapter 4 presents the results of quantitative research, information about the survey sample, testing the measurement scale, and conducting regression analysis to examine the factors affecting employee satisfaction with work. At the same time, conducting the verification of the research hypotheses that have been set out through SPSS software.
4.1. OVERVIEW OF STATISTICAL AGENCIES
Currently, the General Statistics Office is an agency under the Ministry of Planning and Investment, performing the function of advising and assisting the Minister of Planning and Investment in state management of statistics; organizing statistical activities and providing socio-economic statistical information to domestic and international agencies, organizations and individuals in accordance with the provisions of law. The General Statistics Office is organized vertically from the central to local levels according to administrative units: the General Statistics Office at the central level with 16 administrative units and 9 public service units; local statistical agencies with 63 provincial and municipal statistical offices and 713 district and county statistical offices; with a total of over 5,300 civil servants and public employees, of which women account for approximately 43%, 66% of civil servants and public employees have university and post-graduate degrees.
After 2/3 of a century of establishment and development, the Vietnam Statistics sector has affirmed its important role in providing statistical information to serve the leaders of the Party, the State and the authorities at all levels to assess and forecast the situation, plan strategies and policies, build socio-economic development plans and meet the statistical information needs of organizations and individuals. The statistical information published and provided by the General Statistics Office is an official source of information, with legal validity, trusted and used by all levels, sectors, organizations and individuals domestically and internationally.
On May 6, 1946, President Ho Chi Minh signed Decree No. 61/SL to establish the Vietnam Statistics Office under the Ministry of National Economy - the predecessor of the industry.
Statistics and General Statistics Office today and May 6 every year becomes the traditional day of Vietnam Statistics Sector.
In recent years of innovation, our country's statistical work has made new developments and achieved many results and progress in all aspects: The legal environment for statistical work has been strengthened, the Law on Statistics and documents guiding the implementation of the Law have been issued and have had positive effects; The system of State statistical organizations has continued to be consolidated and improved; Statistical methodologies according to international standards have been gradually innovated and successfully applied; Modern technology in information processing and transmission has been increasingly widely applied; Statistical information dissemination activities have been gradually innovated with many diverse forms; The field of international cooperation has also achieved many results through the General Statistics Office actively and proactively integrating and participating in international statistical activities... Thereby, the position of Vietnam Statistics in the region and in the world has gradually been raised.
However, to better meet the requirements of integration and development, the Vietnamese Statistics sector needs to have important innovations. On March 2, 2010, the Prime Minister signed Decision No. 312/QD-TTg approving the Project on Synchronous Innovation of Statistical Indicator Systems; Following that, on October 18, 2011, the Prime Minister signed Decision No. 1803/QD-TTg approving the Vietnam Statistics Development Strategy for the period 2011 - 2020 and vision to 2030. These are important bases for the Vietnam Statistics sector to continue to improve its capacity, develop more strongly and deeply in the process of integration with world statistics, especially to better meet and perform the political tasks assigned by the Party and the State with the goal: " Vietnam Statistics develops rapidly and sustainably on the basis of perfecting the organizational system, ensuring sufficient quantity and improving the quality of human resources, synchronously applying advanced statistical methods and increasing the use of modern technology; Forming a centralized, unified, transparent and effective national statistical information system with increasingly complete information quantity and increasingly high quality information; Strive for Vietnam's statistics to reach a fairly good level by 2020 and an advanced level in the region by 2030."
4.2. DESCRIPTION OF SAMPLE
The author received the survey form, checked for invalid forms, cleaned the information, coded the necessary information in the response form, entered and analyzed the data using SPSS 20.0 software. The survey was conducted to collect data from individuals working at the Statistical Offices.
The survey was conducted using a questionnaire with a score on a 5-point scale sent directly to the staff of the statistical agencies. The total number of questionnaires sent for the survey was 250. The results received 242 questionnaires, reaching a rate of 96.80%, of which 234 were valid. Invalid questionnaires were discarded before being entered into SPSS software. Finally, 234 questionnaires were used for the study, reaching a rate of 96.69%. Therefore, the selected survey sample was 234 valid and complete survey questionnaires, suitable for the requirements and representative of the sample, ensuring the implementation of the study.
Summarizing the personal information of the survey subjects, we get the following results:
Table 4.1. Statistics of survey subjects
Variable
Frequency | Percentage | ||
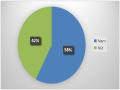
Sex | Male | 131 | 56.0 |
Female | 103 | 44.0 | |
Position | Staff | 187 | 80.0 |
Management staff | 47 | 20.0 | |
Under 30 years old | 60 | 25.7 | |
Age | 30 to 44 years old | 107 | 45.7 |
45 to 55 years old | 54 | 22.9 | |
Over 55 years old | 13 | 5.7 | |
High School | 7 | 2.9 | |
Education/professional qualifications | Intermediate | 68 | 29.1 |
College, university | 144 | 61.7 | |
Master | 15 | 6.3 | |
Under 5 years | 59 | 25.1 | |
Years of service | From 5 to under 10 year | 104 | 44.6 |
Over 10 years | 71 | 30.3 | |
Maybe you are interested!
-

 Testing of Scales – Cronbach'S Alpha Reliability Coefficient.
 -
 Cronbach's Alpha Reliability Coefficient Table of Scales After Removing Junk Variables
 -
 Results of Reliability Assessment of Factor Scales After Second Factor Analysis
 -
 Assessing Patient Satisfaction with Communication Channels, Providing Medical Information and Health Education Used by Social Work Staff.
 -
 Summary of Cronbach'S Alpha Reliability Coefficients of the Scales
Source: Data analysis results using SPSS
The results from above show that the study has 234 observations. When considering each variable, the results are as follows:
Gender: In 234 observations, there were 103 females (44%) and 131 males (56%). This result shows that with 234 random observations, the number of males is greater than that of females.
Position: With the title of employee, there were 187 observations surveyed, accounting for 80% and the title of manager was 87 observations, accounting for 20%.
Age: Under 30 years old, there were 60 observations, accounting for 25.7%, between 31 and 44 years old, there were 107 observations, accounting for 45.7%, between 45 and 55 years old, there were 55 observations, accounting for 22.9% and over 55 years old, there were 13 observations, accounting for 5.7%.
Education level: High school level is 7 observations, accounting for 2.9%, intermediate level is 68 observations, accounting for 29.1%, college and university are 144 observations, accounting for 61.7%, master's degree is 15 observations, accounting for 6.3%.
Working experience: Working experience under 5 years is 59 observations, accounting for 25.1%, from 5 to 10 years of work experience accounts for 44.6% with 104 observations and over 10 years of working experience is 71 observations, accounting for 30.3%.
4.3. ASSESSING THE RELIABILITY OF THE SCALE THROUGH CRONBACH'S ALPHA ANALYSIS
Assessing the reliability of the scale is essential in the analysis, and to assess the reliability of the scale of factors in the study "Factors affecting employee satisfaction with work at Statistical Agencies", the author calculated the Cronbach's Alpha coefficient and examined the total variable correlation coefficients.
Many researchers agree that Cronbach's Alpha coefficient in assessing the reliability of scales from 0.8 or higher to nearly 1 is a good measurement scale, from 0.7 to 0.8 is a usable scale. And many researchers also believe that Cronbach's Alpha coefficient of scales from 0.6 or higher can also be used in cases where the concept in the research is new or new to the respondents in the research context (Hoang Trong - Chu Nguyen Mong Ngoc, 2008). Therefore, for this study, Cronbach's Alpha coefficient from 0.6 or higher is usable.
Table 4.2. Scale testing using Cronbach's Alpha coefficient for the second time