Soil porosity. Porosity and moisture determine the air permeability and activity of soil microorganisms as well as the development of plant roots. To evaluate and classify the ecological adaptability of plants (coffee, tea, lychee, custard apple and longan), the TPCG index of soil in the study area is divided into 4 levels: sandy loam (Cg1); light loam (Cg2); medium loam (Cg3); heavy loam (Cg4).
+ Soil fertility (OC): is a very important factor in soil assessment as well as in landscape assessment to serve the planning and orientation of agricultural and forestry development. Soil fertility is an important component that determines the nutritional foundation of landscape units. Fertility is a synthesis of many indicators such as: pH KCl , total soil organic matter (OM -%), total nitrogen (N -%), total phosphorus (P 2 O 5
- %), total potassium (K 2 O - %), absorption capacity (CEC - me/100g.soil)... However,
These indicators vary considerably within the same soil type and across different landscape units. To facilitate the classification of soil fertility, in the study area, two main indicators are determined that are synthetic and represent many soil properties: soil organic matter content (OM) and soil adsorption capacity (CEC) (Table 3.1). The classification of soil fertility is based on the general classification and assessment principles of the Vietnam Soil Science Association [20].
Table 3.1. Table of general assessment criteria for soil fertility
Target
Rating hierarchy | |||
Fairly obese (OC1) | Average obesity (OC2) | Low Obesity (OC3) | |
Organic content (OM) % | > 3 | 1 - 3 | < 1 |
Adsorption capacity (CEC) tamarind/100g soil | > 20 | 10 - 20 | < 10 |
Maybe you are interested!
-

 Identify Rating Levels and Rating Scales
zt2i3t4l5ee
zt2a3gstourism,quan lan,quang ninh,ecology,ecotourism,minh chau,van don,geography,geographical basis,tourism development,science
zt2a3ge
zc2o3n4t5e6n7ts
of the islanders. Therefore, this indicator will be divided into two sub-indicators:
a1. Natural tourism attractiveness a2. Cultural tourism attractiveness
b. Tourist capacity
The two island communes in Quan Lan have different capacities to receive tourists. Minh Chau Commune is home to many standard hotels and resorts, attracting high-income domestic and international tourists. Meanwhile, Quan Lan Commune has many motels mainly built and operated by local people, so the scale and quality are not high, and will be suitable for ordinary tourists such as students.
c. Time of exploitation of Quan Lan Island Commune:
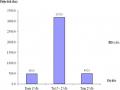
Quan Lan tourism is seasonal due to weather and climate conditions and festivals only take place on certain days of the year, specifically in spring. In Quan Lan commune, the period from April to June and from September to November is considered the best time to visit Quan Lan because the cultural tourism activities are mainly associated with festivals taking place during this time.
Minh Chau island commune:
Tourism exploitation time is all year round, because this is a place with a number of tourist attractions with diverse ecosystems such as Bai Tu Long National Park Research Center, Tram forest, Turtle Laying Beach, so besides coming to the beach for tourism and vacation in the summer, Minh Chau will attract research groups to come for tourism combined with research at other times of the year.
d. Sustainability
The sustainability of ecotourism sites in Quan Lan and Minh Chau communes depends on the sensitivity of the ecosystems to climate changes.
landscape. In general, these tourist destinations have a fairly high level of sustainability, because they are natural ecosystems, planned and protected. However, if a large number of tourists gather at certain times, it can exceed the carrying capacity and affect the sustainability of the environment (polluted beaches, damaged trees, animals moving away from their habitats, etc.), then the sustainability of the above ecosystems (natural ecosystems, human ecosystems) will also be affected and become less sustainable.
e. Location and accessibility
Both island communes have ports to take tourists to visit from Van Don wharf:
- Quan Lan – Van Don traffic route:
Phuc Thinh – Viet Anh high-speed boat and Quang Minh high-speed boat, depart at 8am and 2pm from Van Don to Quan Lan, and at 7am and 1pm from Quan Lan to Van Don. There are also wooden boats departing at 7am and 1pm.
- Van Don - Minh Chau traffic route:
Chung Huong high-speed train, Minh Chau train, morning 7:30 and afternoon 13:30 from Van Don to Minh Chau, morning 6:30 and afternoon 13:00 from Minh Chau to Van Don.
f. Infrastructure
Despite receiving investment attention, the issue of infrastructure and technical facilities for tourism on Quan Lan Island is still an issue that needs to be resolved because it has a direct impact on the implementation of ecotourism activities. The minimum conditions for serving tourists such as accommodation, electricity, water, communication, especially medical services, and security work need to be given top priority. Ecotourism spots in Minh Chau commune are assessed to have better infrastructure and technical facilities for tourism because there are quite complete and synchronous conditions for serving tourists, meeting many needs of domestic and foreign tourists.
3.2.1.4. Determine assessment levels and assessment scales
Corresponding to the levels of each criterion, the index is the score of those levels in the order of 4, 3, 2, 1 decreasing according to the standard of each level: very attractive (4), attractive (3), average (2), less attractive (1).
3.2.1.5. Determining the coefficients of the criteria
For the assessment of DLST in the two communes of Quan Lan and Minh Chau islands, the students added evaluation coefficients to show the importance of the criteria and indicators as follows:
Coefficient 3 with criteria: Attractiveness, Exploitation time. These are the 2 most important criteria for attracting tourists to tourism in general and eco-tourism in particular, so they have the highest coefficient.
Coefficient 2 with criteria: Capacity, Infrastructure, Location and accessibility . Because the assessment area is an island commune of Van Don district, the above criteria are selected by the author with appropriate coefficients at the average level.
Coefficient 1 with criteria: Sustainability. Quan Lan has natural and human-made ecotourism sites, with high biodiversity and little impact from local human factors. Most of the ecotourism sites are still wild, so they are highly sustainable.
3.2.1.6. Results of DLST assessment on Quan Lan island
a. Assessment of the potential for natural tourism development
For Minh Chau commune:
+ Natural tourism attractiveness is determined to be very attractive (4 points) and the most important coefficient (coefficient 3), so the score of the Attractiveness criterion is 4 x 3 = 12.
+ Capacity is determined as average (2 points) and the coefficient is quite important (coefficient 2), then the score of Capacity criterion is 2 x 2 = 4.
+ Exploitation time is long (4 points), the most important coefficient (coefficient 3) so the score of the Exploitation time criterion is 4 x 3 = 12.
+ Sustainability is determined as sustainable (4 points), the important coefficient is the average coefficient (coefficient 1), so the score of the Sustainability criterion is 4 x 1 = 4 points
+ Location and accessibility are determined to be quite favorable (2 points), the coefficient is quite important (coefficient 2), the criterion score is 2 x 2 = 4 points.
+ Infrastructure is assessed as good (3 points), the coefficient is quite important (coefficient 2), then the score of the Infrastructure criterion is 3 x 2 = 6 points.
The total score for evaluating DLST in Minh Chau commune according to 6 evaluation criteria is determined as: 12 + 4 + 12 + 4 + 4 + 6 = 42 points
Similar assessment for Quan Lan commune, we have the following table:
Table 3.3: Assessment of the potential for natural ecotourism development in Quan Lan and Minh Chau communes
Attractiveness of self-tourismof course
Capacity
Mining time
Sustainability
Location and accessibility
Infrastructure
Result
Point
DarkMulti
Point
DarkMulti
Point
DarkMulti
Point
DarkMulti
Point
DarkMulti
Point
DarkMulti
CommuneMinh Chau
12
12
4
8
12
12
4
4
4
8
6
8
42/52
Quan CommuneLan
6
12
6
8
9
12
4
4
4
8
4
8
33/52
b. Assessment of the potential for humanistic tourism development
For Quan Lan commune:
+ The attractiveness of human tourism is determined to be very attractive (4 points) and the most important coefficient (coefficient 3), so the score of the Attractiveness criterion is 4 x 3 = 12.
+ Capacity is determined to be large (3 points) and the coefficient is quite important (coefficient 2), then the score of the Capacity criterion is 3 x 2 = 6.
+ Mining time is average (3 points), the most important coefficient (coefficient 3) so the score of the Mining time criterion is 3 x 3 = 9.
+ Sustainability is determined as sustainable (4 points), the important coefficient is the average coefficient (coefficient 1), so the score of the Sustainability criterion is 4 x 1 = 4 points.
+ Location and accessibility are determined to be quite favorable (2 points), the coefficient is quite important (coefficient 2), the criterion score is 2 x 2 = 4 points.
+ Infrastructure is rated as average (2 points), the coefficient is quite important (coefficient 2), then the score of the Infrastructure criterion is 2 x 2 = 4 points.
The total score for evaluating DLST in Quan Lan commune according to 6 evaluation criteria is determined as: 12 + 6 + 6 + 4 + 4 + 4 = 36 points.
Similar assessment with Minh Chau commune we have the following table:
Table 3.4: Assessment of the potential for developing humanistic eco-tourism in Quan Lan and Minh Chau communes
Attractiveness of human tourismliterature
Capacity
Mining time
Sustainability
Location and accessibility
Infrastructure
Result
Point
DarkMulti
Point
DarkMulti
Point
DarkMulti
Point
DarkMulti
Point
DarkMulti
Point
DarkMulti
Quan CommuneLan
12
12
6
8
9
12
4
4
4
8
4
8
39/52
Minh CommuneChau
6
12
4
8
12
12
4
4
4
8
6
8
36/52
Basically, both Minh Chau and Quan Lan localities have quite favorable conditions for developing ecotourism. However, Quan Lan commune has more advantages to develop ecotourism in a humanistic direction, because this is an area with many famous historical relics such as Quan Lan Communal House, Quan Lan Pagoda, Temple worshiping the hero Tran Khanh Du, ... along with local festivals held annually such as the wind praying ceremony (March 15), Quan Lan festival (June 10-19); due to its location near the port and long exploitation time, the beaches in Quan Lan commune (especially Quan Lan beach) are no longer hygienic and clean to ensure the needs of tourists coming to relax and swim; this is also an area with many beautiful landscapes such as Got Beo wind pass, Ong Phong head, Voi Voi cave, but the ability to access these places is still very limited (dirt hill road, lots of gravel and rocks), especially during rainy and windy times; In addition, other natural resources such as mangrove forests and sea worms have not been really exploited for tourism purposes and ecotourism development. On the contrary, Minh Chau commune has more advantages in developing ecotourism in the direction of natural tourism, this is an area with diverse ecosystems such as at Rua De Beach, Bai Tu Long National Park Conservation Center...; Minh Chau beach is highly appreciated for its natural beauty and cleanliness, ranked in the top ten most beautiful beaches in Vietnam; Minh Chau commune is also home to Tram forest with a large area and a purity of up to 90%, suitable for building bridges through the forest (a very effective type of natural ecotourism currently applied by many countries) for tourists to sightsee, as well as for the purpose of studying and researching.
Figure 3.1: Thenmala Forest Bridge (India) Source: https://www.thenmalaecotourism.com/(August 21, 2019)
3.2.2. Using SWOT matrix to evaluate Quan Lan island tourism
General assessment of current tourism activities of Quan Lan island is shown through the following SWOT matrix:
Table 3.5: SWOT matrix evaluating tourism activities on Quan Lan island
Internal agent
Strengths- There is a lot of potential for tourism development, especially natural ecotourism and humanistic ecotourism.- The unskilled labor force is relatively abundant.- resource environmentunpolluted, still
Weaknesses- Poorly developed infrastructure, especially traffic routes to tourist destinations on the island.- The team of professional staff is still weak.- Tourism products in general
quite wild, originalintact
general and DLST in particularalone is monotonous.
External agents
Opportunity- Tourism is a key industry in the socio-economic development strategy of the province and Van Don economic zone.- Quan Lan was selected as a pilot area for eco-tourism development within the framework of the green growth project between Quang Ninh province and the Japanese organization JICA.- The flow of tourists and especially ecotourism in the world tends toincreasing
Challenge- Weather and climate change abnormally.- Competition in tourism products is increasingly fierce, especially with other localities in the province such as Ha Long, Mong Cai...- Awareness of tourists, especially domestic tourists, about ecotourism and nature conservation is not high.
Through summary analysis using SWOT matrix we see that:
To exploit strengths and take advantage of opportunities, it is necessary to:
- Diversify products and service types (build more tourism routes aimed at specific needs of tourists: experiential tourism immersed in nature, spiritual cultural tourism...)
- Effective exploitation of resources and differentiated products (natural resources and human resources)
div.maincontent .p { color: black; font-family:"Times New Roman", serif; font-style: normal; font-weight: normal; text-decoration: none; font-size: 14pt; margin:0pt; } div.maincontent p { color: black; font-family:"Times New Roman", serif; font-style: normal; font-weight: normal; text-decoration: none; font-size: 14pt; margin:0pt; } div.maincontent .s1 { color: black; font-family:"Times New Roman", serif; font-style: normal; font-weight: normal; text-decoration: none; font-size: 13pt; } div.maincontent .s2 { color: black; font-family:"Times New Roman", serif; font-style: normal; font-weight: normal; text-decoration: none; font-size: 13pt; } div.maincontent .s3 { color: #0D0D0D; font-family:"Times New Roman", serif; font-style: normal; font-weight: bold; text-decoration: none; font-size: 14pt; } div.maincontent .s4 { color: black; font-family:"Times New Roman", serif; font-style: italic; font-weight: normal; text-decoration: none; font-size: 14pt; } div.maincontent .s5 { color: black; font-family:"Times New Roman", serif; font-style: italic; font-weight: bold; text-decoration: none; font-size: 14pt; } div.maincontent .s6 { color: black; font-family:"Times New Roman", serif; font-style: italic; font-weight: normal; text-decoration: none; font-size: 14pt; vertical-align: -3pt; } div.maincontent .s7 { color: black; font-family:"Times New Roman", serif; font-style: italic; font-weight: normal; text-decoration: none; font-size: 14pt; vertical-align: -2pt; } div.maincontent .s8 { color: black; font-family:"Times New Roman", serif; font-style: italic; font-weight: normal; text-decoration: none; font-size: 14pt; vertical-align: -1pt; } div.maincontent .s9 { color: black; font-family:"Times New Roman", serif; font-style: normal; font-weight: normal; text-decoration: none; font-size: 14pt; } div.maincontent .s10 { color: black; font-family:"Times New Roman", serif; font-style: normal; font-weight: bold; text-decoration: none; font-size: 14pt; } div.maincontent .s11 { color: black; font-family:"Times New Roman", serif; font-style: normal; font-weight: normal; text-decoration: none; font-size: 14pt; } div.maincontent .s12 { color: black; font-family:Symbol, serif; font-style: normal; font-weight: normal; text-decoration: none; font-size: 14pt; } div.maincontent .s13 { color: black; font-family:Wingdings; font-style: normal; font-weight: normal; text-decoration: none; font-size: 14pt; } div.maincontent .s14 { color: black; font-family:"Times New Roman", serif; font-style: normal; font-weight: normal; text-decoration: none; font-size: 9pt; vertical-align: 5pt; } div.maincontent .s15 { color: black; font-family:"Times New Roman", serif; font-style: normal; font-weight: normal; text-decoration: none; font-size: 9pt; vertical-align: 5pt; } div.maincontent .s16 { color: black; font-family:Cambria, serif; font-style: italic; font-weight: normal; text-decoration: none; font-size: 14pt; } div.maincontent .s17 { color: #080808; font-family:"Times New Roman", serif; font-style: normal; font-weight: bold; text-decoration: none; font-size: 14pt; } div.maincontent .s18 { color: #080808; font-family:"Times New Roman", serif; font-style: normal; font-weight: normal; text-decoration: none; font-size: 14pt; } div.maincontent .s19 { color: black; font-family:"Times New Roman", serif; font-style: normal; font-weight: normal; text-decoration: none; font-size: 11pt; } div.maincontent .s20 { color: black; font-family:"Times New Roman", serif; font-style: normal; font-weight: normal; text-decoration: none; font-size: 10pt; } div.maincontent .s21 { color: black; font-family:"Times New Roman", serif; font-style: normal; font-weight: bold; text-decoration: none; font-size: 11pt; } div.maincontent .s22 { color: black; font-family:"Times New Roman", serif; font-style: normal; font-weight: normal; text-decoration: none; font-size: 11pt; } div.maincontent .s23 { color: black; font-family:"Times New Roman", serif; font-style: italic; font-weight: normal; text-decoration: none; font-size: 14pt; } div.maincontent .s24 { color: #212121; font-family:"Times New Roman", serif; font-style: normal; font-weight: normal; tex
Identify Rating Levels and Rating Scales
zt2i3t4l5ee
zt2a3gstourism,quan lan,quang ninh,ecology,ecotourism,minh chau,van don,geography,geographical basis,tourism development,science
zt2a3ge
zc2o3n4t5e6n7ts
of the islanders. Therefore, this indicator will be divided into two sub-indicators:
a1. Natural tourism attractiveness a2. Cultural tourism attractiveness
b. Tourist capacity
The two island communes in Quan Lan have different capacities to receive tourists. Minh Chau Commune is home to many standard hotels and resorts, attracting high-income domestic and international tourists. Meanwhile, Quan Lan Commune has many motels mainly built and operated by local people, so the scale and quality are not high, and will be suitable for ordinary tourists such as students.
c. Time of exploitation of Quan Lan Island Commune:
Quan Lan tourism is seasonal due to weather and climate conditions and festivals only take place on certain days of the year, specifically in spring. In Quan Lan commune, the period from April to June and from September to November is considered the best time to visit Quan Lan because the cultural tourism activities are mainly associated with festivals taking place during this time.
Minh Chau island commune:
Tourism exploitation time is all year round, because this is a place with a number of tourist attractions with diverse ecosystems such as Bai Tu Long National Park Research Center, Tram forest, Turtle Laying Beach, so besides coming to the beach for tourism and vacation in the summer, Minh Chau will attract research groups to come for tourism combined with research at other times of the year.
d. Sustainability
The sustainability of ecotourism sites in Quan Lan and Minh Chau communes depends on the sensitivity of the ecosystems to climate changes.
landscape. In general, these tourist destinations have a fairly high level of sustainability, because they are natural ecosystems, planned and protected. However, if a large number of tourists gather at certain times, it can exceed the carrying capacity and affect the sustainability of the environment (polluted beaches, damaged trees, animals moving away from their habitats, etc.), then the sustainability of the above ecosystems (natural ecosystems, human ecosystems) will also be affected and become less sustainable.
e. Location and accessibility
Both island communes have ports to take tourists to visit from Van Don wharf:
- Quan Lan – Van Don traffic route:
Phuc Thinh – Viet Anh high-speed boat and Quang Minh high-speed boat, depart at 8am and 2pm from Van Don to Quan Lan, and at 7am and 1pm from Quan Lan to Van Don. There are also wooden boats departing at 7am and 1pm.
- Van Don - Minh Chau traffic route:
Chung Huong high-speed train, Minh Chau train, morning 7:30 and afternoon 13:30 from Van Don to Minh Chau, morning 6:30 and afternoon 13:00 from Minh Chau to Van Don.
f. Infrastructure
Despite receiving investment attention, the issue of infrastructure and technical facilities for tourism on Quan Lan Island is still an issue that needs to be resolved because it has a direct impact on the implementation of ecotourism activities. The minimum conditions for serving tourists such as accommodation, electricity, water, communication, especially medical services, and security work need to be given top priority. Ecotourism spots in Minh Chau commune are assessed to have better infrastructure and technical facilities for tourism because there are quite complete and synchronous conditions for serving tourists, meeting many needs of domestic and foreign tourists.
3.2.1.4. Determine assessment levels and assessment scales
Corresponding to the levels of each criterion, the index is the score of those levels in the order of 4, 3, 2, 1 decreasing according to the standard of each level: very attractive (4), attractive (3), average (2), less attractive (1).
3.2.1.5. Determining the coefficients of the criteria
For the assessment of DLST in the two communes of Quan Lan and Minh Chau islands, the students added evaluation coefficients to show the importance of the criteria and indicators as follows:
Coefficient 3 with criteria: Attractiveness, Exploitation time. These are the 2 most important criteria for attracting tourists to tourism in general and eco-tourism in particular, so they have the highest coefficient.
Coefficient 2 with criteria: Capacity, Infrastructure, Location and accessibility . Because the assessment area is an island commune of Van Don district, the above criteria are selected by the author with appropriate coefficients at the average level.
Coefficient 1 with criteria: Sustainability. Quan Lan has natural and human-made ecotourism sites, with high biodiversity and little impact from local human factors. Most of the ecotourism sites are still wild, so they are highly sustainable.
3.2.1.6. Results of DLST assessment on Quan Lan island
a. Assessment of the potential for natural tourism development
For Minh Chau commune:
+ Natural tourism attractiveness is determined to be very attractive (4 points) and the most important coefficient (coefficient 3), so the score of the Attractiveness criterion is 4 x 3 = 12.
+ Capacity is determined as average (2 points) and the coefficient is quite important (coefficient 2), then the score of Capacity criterion is 2 x 2 = 4.
+ Exploitation time is long (4 points), the most important coefficient (coefficient 3) so the score of the Exploitation time criterion is 4 x 3 = 12.
+ Sustainability is determined as sustainable (4 points), the important coefficient is the average coefficient (coefficient 1), so the score of the Sustainability criterion is 4 x 1 = 4 points
+ Location and accessibility are determined to be quite favorable (2 points), the coefficient is quite important (coefficient 2), the criterion score is 2 x 2 = 4 points.
+ Infrastructure is assessed as good (3 points), the coefficient is quite important (coefficient 2), then the score of the Infrastructure criterion is 3 x 2 = 6 points.
The total score for evaluating DLST in Minh Chau commune according to 6 evaluation criteria is determined as: 12 + 4 + 12 + 4 + 4 + 6 = 42 points
Similar assessment for Quan Lan commune, we have the following table:
Table 3.3: Assessment of the potential for natural ecotourism development in Quan Lan and Minh Chau communes
Attractiveness of self-tourismof course
Capacity
Mining time
Sustainability
Location and accessibility
Infrastructure
Result
Point
DarkMulti
Point
DarkMulti
Point
DarkMulti
Point
DarkMulti
Point
DarkMulti
Point
DarkMulti
CommuneMinh Chau
12
12
4
8
12
12
4
4
4
8
6
8
42/52
Quan CommuneLan
6
12
6
8
9
12
4
4
4
8
4
8
33/52
b. Assessment of the potential for humanistic tourism development
For Quan Lan commune:
+ The attractiveness of human tourism is determined to be very attractive (4 points) and the most important coefficient (coefficient 3), so the score of the Attractiveness criterion is 4 x 3 = 12.
+ Capacity is determined to be large (3 points) and the coefficient is quite important (coefficient 2), then the score of the Capacity criterion is 3 x 2 = 6.
+ Mining time is average (3 points), the most important coefficient (coefficient 3) so the score of the Mining time criterion is 3 x 3 = 9.
+ Sustainability is determined as sustainable (4 points), the important coefficient is the average coefficient (coefficient 1), so the score of the Sustainability criterion is 4 x 1 = 4 points.
+ Location and accessibility are determined to be quite favorable (2 points), the coefficient is quite important (coefficient 2), the criterion score is 2 x 2 = 4 points.
+ Infrastructure is rated as average (2 points), the coefficient is quite important (coefficient 2), then the score of the Infrastructure criterion is 2 x 2 = 4 points.
The total score for evaluating DLST in Quan Lan commune according to 6 evaluation criteria is determined as: 12 + 6 + 6 + 4 + 4 + 4 = 36 points.
Similar assessment with Minh Chau commune we have the following table:
Table 3.4: Assessment of the potential for developing humanistic eco-tourism in Quan Lan and Minh Chau communes
Attractiveness of human tourismliterature
Capacity
Mining time
Sustainability
Location and accessibility
Infrastructure
Result
Point
DarkMulti
Point
DarkMulti
Point
DarkMulti
Point
DarkMulti
Point
DarkMulti
Point
DarkMulti
Quan CommuneLan
12
12
6
8
9
12
4
4
4
8
4
8
39/52
Minh CommuneChau
6
12
4
8
12
12
4
4
4
8
6
8
36/52
Basically, both Minh Chau and Quan Lan localities have quite favorable conditions for developing ecotourism. However, Quan Lan commune has more advantages to develop ecotourism in a humanistic direction, because this is an area with many famous historical relics such as Quan Lan Communal House, Quan Lan Pagoda, Temple worshiping the hero Tran Khanh Du, ... along with local festivals held annually such as the wind praying ceremony (March 15), Quan Lan festival (June 10-19); due to its location near the port and long exploitation time, the beaches in Quan Lan commune (especially Quan Lan beach) are no longer hygienic and clean to ensure the needs of tourists coming to relax and swim; this is also an area with many beautiful landscapes such as Got Beo wind pass, Ong Phong head, Voi Voi cave, but the ability to access these places is still very limited (dirt hill road, lots of gravel and rocks), especially during rainy and windy times; In addition, other natural resources such as mangrove forests and sea worms have not been really exploited for tourism purposes and ecotourism development. On the contrary, Minh Chau commune has more advantages in developing ecotourism in the direction of natural tourism, this is an area with diverse ecosystems such as at Rua De Beach, Bai Tu Long National Park Conservation Center...; Minh Chau beach is highly appreciated for its natural beauty and cleanliness, ranked in the top ten most beautiful beaches in Vietnam; Minh Chau commune is also home to Tram forest with a large area and a purity of up to 90%, suitable for building bridges through the forest (a very effective type of natural ecotourism currently applied by many countries) for tourists to sightsee, as well as for the purpose of studying and researching.
Figure 3.1: Thenmala Forest Bridge (India) Source: https://www.thenmalaecotourism.com/(August 21, 2019)
3.2.2. Using SWOT matrix to evaluate Quan Lan island tourism
General assessment of current tourism activities of Quan Lan island is shown through the following SWOT matrix:
Table 3.5: SWOT matrix evaluating tourism activities on Quan Lan island
Internal agent
Strengths- There is a lot of potential for tourism development, especially natural ecotourism and humanistic ecotourism.- The unskilled labor force is relatively abundant.- resource environmentunpolluted, still
Weaknesses- Poorly developed infrastructure, especially traffic routes to tourist destinations on the island.- The team of professional staff is still weak.- Tourism products in general
quite wild, originalintact
general and DLST in particularalone is monotonous.
External agents
Opportunity- Tourism is a key industry in the socio-economic development strategy of the province and Van Don economic zone.- Quan Lan was selected as a pilot area for eco-tourism development within the framework of the green growth project between Quang Ninh province and the Japanese organization JICA.- The flow of tourists and especially ecotourism in the world tends toincreasing
Challenge- Weather and climate change abnormally.- Competition in tourism products is increasingly fierce, especially with other localities in the province such as Ha Long, Mong Cai...- Awareness of tourists, especially domestic tourists, about ecotourism and nature conservation is not high.
Through summary analysis using SWOT matrix we see that:
To exploit strengths and take advantage of opportunities, it is necessary to:
- Diversify products and service types (build more tourism routes aimed at specific needs of tourists: experiential tourism immersed in nature, spiritual cultural tourism...)
- Effective exploitation of resources and differentiated products (natural resources and human resources)
div.maincontent .p { color: black; font-family:"Times New Roman", serif; font-style: normal; font-weight: normal; text-decoration: none; font-size: 14pt; margin:0pt; } div.maincontent p { color: black; font-family:"Times New Roman", serif; font-style: normal; font-weight: normal; text-decoration: none; font-size: 14pt; margin:0pt; } div.maincontent .s1 { color: black; font-family:"Times New Roman", serif; font-style: normal; font-weight: normal; text-decoration: none; font-size: 13pt; } div.maincontent .s2 { color: black; font-family:"Times New Roman", serif; font-style: normal; font-weight: normal; text-decoration: none; font-size: 13pt; } div.maincontent .s3 { color: #0D0D0D; font-family:"Times New Roman", serif; font-style: normal; font-weight: bold; text-decoration: none; font-size: 14pt; } div.maincontent .s4 { color: black; font-family:"Times New Roman", serif; font-style: italic; font-weight: normal; text-decoration: none; font-size: 14pt; } div.maincontent .s5 { color: black; font-family:"Times New Roman", serif; font-style: italic; font-weight: bold; text-decoration: none; font-size: 14pt; } div.maincontent .s6 { color: black; font-family:"Times New Roman", serif; font-style: italic; font-weight: normal; text-decoration: none; font-size: 14pt; vertical-align: -3pt; } div.maincontent .s7 { color: black; font-family:"Times New Roman", serif; font-style: italic; font-weight: normal; text-decoration: none; font-size: 14pt; vertical-align: -2pt; } div.maincontent .s8 { color: black; font-family:"Times New Roman", serif; font-style: italic; font-weight: normal; text-decoration: none; font-size: 14pt; vertical-align: -1pt; } div.maincontent .s9 { color: black; font-family:"Times New Roman", serif; font-style: normal; font-weight: normal; text-decoration: none; font-size: 14pt; } div.maincontent .s10 { color: black; font-family:"Times New Roman", serif; font-style: normal; font-weight: bold; text-decoration: none; font-size: 14pt; } div.maincontent .s11 { color: black; font-family:"Times New Roman", serif; font-style: normal; font-weight: normal; text-decoration: none; font-size: 14pt; } div.maincontent .s12 { color: black; font-family:Symbol, serif; font-style: normal; font-weight: normal; text-decoration: none; font-size: 14pt; } div.maincontent .s13 { color: black; font-family:Wingdings; font-style: normal; font-weight: normal; text-decoration: none; font-size: 14pt; } div.maincontent .s14 { color: black; font-family:"Times New Roman", serif; font-style: normal; font-weight: normal; text-decoration: none; font-size: 9pt; vertical-align: 5pt; } div.maincontent .s15 { color: black; font-family:"Times New Roman", serif; font-style: normal; font-weight: normal; text-decoration: none; font-size: 9pt; vertical-align: 5pt; } div.maincontent .s16 { color: black; font-family:Cambria, serif; font-style: italic; font-weight: normal; text-decoration: none; font-size: 14pt; } div.maincontent .s17 { color: #080808; font-family:"Times New Roman", serif; font-style: normal; font-weight: bold; text-decoration: none; font-size: 14pt; } div.maincontent .s18 { color: #080808; font-family:"Times New Roman", serif; font-style: normal; font-weight: normal; text-decoration: none; font-size: 14pt; } div.maincontent .s19 { color: black; font-family:"Times New Roman", serif; font-style: normal; font-weight: normal; text-decoration: none; font-size: 11pt; } div.maincontent .s20 { color: black; font-family:"Times New Roman", serif; font-style: normal; font-weight: normal; text-decoration: none; font-size: 10pt; } div.maincontent .s21 { color: black; font-family:"Times New Roman", serif; font-style: normal; font-weight: bold; text-decoration: none; font-size: 11pt; } div.maincontent .s22 { color: black; font-family:"Times New Roman", serif; font-style: normal; font-weight: normal; text-decoration: none; font-size: 11pt; } div.maincontent .s23 { color: black; font-family:"Times New Roman", serif; font-style: italic; font-weight: normal; text-decoration: none; font-size: 14pt; } div.maincontent .s24 { color: #212121; font-family:"Times New Roman", serif; font-style: normal; font-weight: normal; tex -
 General Comments and Assessment of Basic Conditions of the Study Area
 -
 General Assessment of the Current Situation of Public Investment Capital Management at the Ministry of Health in the Period 2016 - 2020
 -
 General Assessment of Factors Affecting Tourism Development in Vientiane City
 -
 General Assessment of the Content of the Composition Course
+ Drainage capacity (Tn): drainage capacity is a very important factor related to soil moisture, flooding problems..., depending on the energy and slope of the terrain, it reflects the level of drainage on the landscape types. Drainage capacity is a factor related to the direction of land use in agricultural and forestry production.
industrial, especially the planning for the development of long-term industrial crops and fruit trees. Based on the ecological needs of crops and the differentiation of the territory, the drainage level of the study area is divided into 4 levels: good drainage (Tn1) for mountainous terrain with high topographic energy and slope; average drainage (Tn2) for gentle hilly terrain, low topographic energy and slope; poor drainage (Tn3) is typical for terrain with very gentle, flat slopes; very poor drainage (Tn4) is concentrated in low-lying areas with quite long flooding periods during the year. Frequently flooded landscapes such as ponds, lakes, rivers and streams are not mentioned but are very important factors (water supply for irrigated agricultural land use types) in the orientation of territorial organization.
+ Average temperature of winter months XII, I and II (Tw): the study of winter temperature differentiation of landscape units within the research territory is extremely important. It is related to the direction of land use for some tropical and subtropical crops with very complex temperature requirements according to each stage of development. Based on the territorial differentiation and ecological needs of perennial crops, the average winter temperature in the research territory is divided into the following levels:
- Cold: 10 - 15 o C (Tw1)
- Cold: 15 - 18 o C (Tw2)
+ Air humidity in winter months XII, I and II (Ww): like the temperature factor, air humidity in winter months has a great influence on tropical and subtropical crops, determining the direction of use and arrangement of crops. Based on the data of air humidity monitoring and the moisture demand in winter months (XII, I and II) of the plants (coffee, tea, lychee, custard apple and longan), air humidity is divided into the following levels:
Dry: 75 - 80%: Ww1
Dry steam: 80 - 85%: Ww2
+ Temperature in March, April and May (Ts): is an important factor in planning and determining the productivity of tropical fruit trees, especially for custard apple trees, this is the period of fruiting.
Flowers and pollination. Based on the ecological needs of custard apple trees and the differentiation characteristics of the territory, the average air temperature in March, April and May is divided into:
Cool: 18 - 23 o C (Ts1)
Hot steam: 23 - 26 o C (Ts2)
+ Average annual rainfall (P): is a factor that contributes to the formation of air and soil humidity, and is also a factor that determines the arrangement of crops on the territory. Based on the ecological needs of coffee, tea, lychee, custard apple and longan trees combined with the differentiation of average annual rainfall in the research territory, the average annual rainfall factor is classified as follows:
1500 - 1800 mm (P1)
1000 - 1500 mm (P2)
+ Number of dry months (Dr): related to the ability to meet the moisture needs of crops (coffee, tea, lychee, custard apple and longan) during the dry season. Dry periods have the effect of promoting or inhibiting the metabolism and energy of crops, directly affecting the assimilation and catabolism processes, efficiency and biological rhythms of crops. Too high or too dry humidity can inhibit the growth of plants, and if prolonged, can kill plants. However, the need for moisture is not uniform during the growth periods, so it is not entirely correct to say that plants always need moisture or that the more moisture the better. In general, long-term industrial crops and fruit trees require enough water during the growth period, fruit nurturing and need less moisture during the dormant period before flowering. Under the conditions of differentiation of the research territory and the ecological needs of the trees (lychee, custard apple, longan and coffee), the number of dry months is divided into 2 corresponding levels:
Dr1: 1 month
Dr2: 4 - 5 months
+ Frequency of frost occurrence in a year (Sg): is a very important ecological limit indicator expressed through the level of influence of frost on the formation and development of the stems, leaves and branches of crops, especially long-term industrial crops and fruit trees. If frost appears and lasts for a long time, it will seriously affect the crops, even causing burning and death of the entire stems, leaves, branches and young shoots.
Particularly serious for cold-resistant crops such as Arabica coffee, if exposed to frost, it will kill them during the basic design period or burn the flower buds and young fruits during the business period, causing crop failure. Areas with little frost, if well covered and protected, can still grow coffee. However, in research works on coffee trees, especially Arabica coffee, the quantification of the level of influence of frost on the growth, development and productivity has not been specifically mentioned [40], [43]. With the results of field surveys, data collection from local people on the influence of frost on crops, especially Arabica coffee, combined with the ecological characteristics of the crops and based on the number of
Statistical data on the possibility of frost occurrence in the study area, dividing the frequency of frost occurrence into 2 levels: Sg1: 1 < number of days with frost 2; Sg2:
> 2 days of frost.
Table 3.2. Summary of hierarchical criteria for assessing ecological adaptation for groups of long-term industrial crops and fruit trees
(coffee, tea, lychee, custard apple and longan) Huu Lung area.
Target
Classification | Symbol | |
I. Soil type | 1. Valley soil due to the accumulation of limestone 2. Valley soil due to the accumulation of other rocks 3. Alluvial soil is deposited annually 4. Alluvial soil is not deposited (P) 5. Red and yellow soil changes due to rice cultivation 6. Red-yellow soil on shale 7. Pale yellow soil on siltstone 8. Red-yellow soil on rhyolite 9. Brown-yellow soil on ancient alluvium 10. Red brown soil on limestone | Dv D Pb P Fl Fs Fq Fa Fp Fv |
II. Slope | 1. Slope below 8 0 2. Slope from 8 - 15 0 3. Slope from 15 - 25 0 4. Slope over 25 0 | SL1 SL2 SL3 SL4 |
III. Thick layer | 1. Layer thickness over 100 cm 2. Thick layer 50 - 100 cm 3. Layer thickness less than 50 cm | D1 D2 D3 |
IV. Mechanical components | 1. Sand mix 2. Light meat 3. Medium meat 4. Heavy meat | Cg1 Cg2 Cg3 Cg4 |
V. Soil fertility | 1. Fairly obese 2. Average obesity 3. Low obesity | OC1 OC2 OC3 |
VI. Drainage capacity
1. Good drainage 2. Average drainage 3. Poor drainage 4. Very poor drainage | Tn1 Tn2 Tn3 Tn4 | |
VII. Average temperature in December, January and February | 1. Cold: from 10 - 15 0 C 2. Cold: from 15 - 18 0 C | Tw1 Tw2 |
VIII. Average humidity in December, January, and February | 1. Dry: 75 - 80% 2. Dry steam: 80 - 85% | Ww1 Ww2 |
IX. Average temperature in March, April and May | 1. Cool: 18 - 23 0 C 2. Heat: > 23 - 26 0 C | Ts1 Ts2 |
X. Average annual rainfall (mm) | 1. 1,500 - 1,800 2. From 1,000 - 1,500 | P1 P2 |
XI. Number of dry months in a year | 1. 1 month 2. From 4 - 5 months | Dr1 Dr2 |
XII. Frequency of occurrence of frost in year (day) | 1. 1 < number of days 2 2. > 2 days | Sg1 Sg2 |
3.3.2. Separate assessment of ecological indicators
Table 3.3. Standard table for evaluating specific landscape criteria for coffee, tea, lychee, custard apple and longan trees in Huu Lung area
Type of land use
Target | Adaptability | ||||
Very adaptable (3 points) | Medium adaptability (2 points) | Less adaptable (1 point) | Not suitable (0 points) | ||
Coffee tea tree | 1. Soil type | - | Fs, D, Fa | Fp, Fq, P, Dv, Fv | Pb, Fl |
2. Slope | 0 - 8 o (SL1) | 8 - 15 o (SL2) | 15 - 25 o (SL3) | > 25 o (SL4) | |
3. Soil thickness (cm) | > 100 (D1) | 50 - 100 (D2) | < 50 (D3) | - | |
4. Motorized city | Medium meat, heavy meat (Cg3, Cg4) | - | Light meat (Cg2) | Sand mix (Cg1) | |
5. Soil fertility | Fair (OC1) | T (OC2) | Low (OC3) | - | |
6. Number of frost days | - | - | 1 < day 2 (Sg1) | > 2 days (Sg2) | |
7. Average annual rainfall (mm) | 1500 - 1800 (P1) | 1000 - 1500 (P2) | - | - | |
8. Number of dry months | 1 month (Dr1) | - | 4 - 5 months (Dr2) | - | |
Litchi | 1. Soil type | P, Fs | Fp, Fq, Fa | Dv, Fv, D | Pb, Fl |
2. Slope | 0 - 8 o (SL1) | 8 - 15 o (SL2) | 15 - 25 o (SL3) | > 25 o (SL4) | |
3. Layer thickness (cm) | > 100 (D1) | 50 - 100 (D2) | < 50 (D3) | - | |
4. Motorized city | Medium meat vase (Cg3) | Light meat (Cg2) | Heavy meat, sand phase (Cg4, Cg1) | - | |
5. Soil fertility | Fair (OC1) | T (OC2) | Low (OC3) | - | |
6. Drainage capacity | Good (Tn1) | Average (Tn2) | Poor (Tn3) | Very poor (Tn4) | |
7. Temperature in December, January, February ( o C) | Cold (Tw2) | Cold (Tw1) | - | - | |
8. Humidity in December, January, February (%) | Dry (Ww1) | Dry (Ww2) | - | - | |
custard apple tree | 1. Soil type | Dv, Fv | Fs, Fa, P | D, Fp, Fq | Pb, Fl |
2. Slope | 0 - 8 o (SL1) | 8 - 15 o (SL2) | 15 - 25 o (SL3) | > 25 o (SL4) | |
3. Layer thickness (cm) | > 100 (D1) | 50 - 100 (D2) | < 50 (D3) | - | |
4. Motorized city | Medium meat (Cg3) | Light meat (Cg2) | Sand mixed, meat heavy (Cg1, Cg4) | - | |
5 Soil fertility | Fair (OC1) | Average (OC2) | Low (OC3) | - | |
6 Drainage capacity | Good (Tn1) | Average (Tn2) | Poor (Tn3) | Very poor (Tn4) | |
7 Temperature in March, April, May | Cool (Ts1) | Hot steam (Ts2) | - | - | |
8 Average annual rainfall (mm) | 1500 - 1800 (P1) | 1000 - 1500 (P2) | - | - | |
Longan tree | 1. Soil type | P | Fa, Fs, D | Dv, Fv, Fp, Fq | Pb, Fl |
2. Slope | 0 - 8 o (SL1) | 8 - 15 o (SL2) | 15 - 25 o (SL3) | > 25 o (SL4) | |
3. Layer thickness (cm) | > 100 (D1) | 50 - 100 (D2) | < 50 (D3) | - | |
4. Motorized city | TB meat, meat light (Cg3, Cg2) | Heavy meat (Cg4) | Sand mix (Cg1) | - | |
5. Soil fertility | Fair (OC1) | T (OC2) | Low (OC3) | - | |
6. Drainage capacity | Good (Tn1) | Average (Tn2) | Poor (Tn3) | Very poor (Tn4) | |
7. Average annual rainfall (mm) | 1500 - 1800 (P1) | 1000 - 1500 (P2) | - | - | |
8. Humidity in December, January, February (%) | Dry (Ww1) | Dry Steam (Ww2) | - | - |
Based on basic research documents on ecological needs of long-term industrial crops and fruit trees [19], [40], [43] combined with the contributions of many experienced experts, the classification of ecological adaptation levels for each indicator for coffee, tea, lychee, custard-apple, and longan trees was conducted based on a comparison between the ecological needs of each tree and the response capacity of the landscape types in the research territory and is shown in Table 3.3.
3.4. Evaluation and classification of ecological suitability of landscape types for coffee, tea, lychee, custard apple and longan trees
3.4.1. Assessment of ecological adaptation level
Ecological suitability assessment is to determine the suitability of the overall sites for specific planning objects. The input data for the assessment step includes the characteristics of the overall sites (which here are landscape types), the ecological needs of the types of resource use, and the output is the result of the assessment of the ecological suitability of the overall sites for each type of land use (coffee, tea, lychee, custard apple, longan) in the form of scores and classification of ecological suitability levels. The assessment score can be calculated by total score or average (NC
Huan, 1992) or the geometric mean of the component points. To divide the suitability levels (or favorableness levels) of the overall sites, researchers have used factor analysis methods, especially currently in agricultural land use planning, the FAO (1986) land suitability assessment method has been applied.
The assessment of ecological adaptation of landscape types to serve the rational exploitation and use of the territory with the object of long-term crops (coffee, lychee, custard apple, longan) is essentially the process of comparing the potential of landscape types and the ecological needs of the crops. The assessment is carried out by the method of scoring each ecological indicator of the landscape types depending on the ability to meet the ecological needs of coffee, lychee, custard apple and longan. Here , the scale is assessed for each indicator and divided into 4 levels as follows:
Very adaptable: 3 points
Average adaptability: 2 points
Less adaptable: 1 point
Not suitable: 0 points
The overall assessment was conducted using the geometric mean method of the scores for the eight ecological indicators. The result of the geometric mean problem is the overall assessment score of each landscape type for each specific studied crop type:
M o = n a 1 .a 2 .a 3 ...a n
M o : Overall rating score
(1)
a 1 , a 2 , a 3 , ... a n : Score for each evaluation criterion n: Number of evaluation criteria
The advantage of the geometric mean problem according to D. L Armand (1975) is that if in the characteristics of the landscape type only 1 limiting indicator (with similar points) needs to appear,
(corresponding to 0 points) that the crop cannot overcome, then the overall assessment result is 0 points and is classified as non-adapted (N).
The scores for each criterion included in the adaptation assessment are taken from a separate assessment standard table (see table 3.3). The geometric mean of the scores for the eight criteria will give the overall assessment result for each landscape type.
By the above method, it is possible to calculate specifically for all types of landscapes in Huu Lung territory for each type of crop studied. The results of the assessment of the ecological adaptation level of each type of landscape for coffee, tea, lychee, custard apple and longan are shown in tables 2, 3, 4, 5 in the appendix.
3.4.2. Classification of ecological adaptation level
In the study area, landscape types with a geometric mean score of 0 are classified as unsuitable (N). Landscape types with a geometric mean score other than 0 are classified according to suitability levels (S1, S2, S3). From the results of the comprehensive assessment of landscape types for lychee, custard apple, and longan (see tables 3, 4, 5 in the appendix), up to 20 landscape types are classified as unsuitable (N), the remaining (46 landscape types) are classified as suitable. For Arabica coffee (see table 2 in the appendix), up to 35 landscape types are classified as unsuitable (N) and only 31 landscape types are classified as suitable. The score gap of each suitability level in the suitability classification scale is calculated according to the Aivasian formula (1983):
S S Max S Min
1 LgH
(2)
Here, the maximum geometric mean score (S Max ) is 3 points, the minimum geometric mean score (S Min ) is 1 point and H is the number of landscape types classified with a geometric mean score other than 0.
The calculation results show:
- The distance score of each adaptation level in the adaptation rating scale for Arabica coffee is 0.8.
- The distance between the scores of each adaptation level in the adaptation ranking scale for lychee, custard apple, and longan is 0.75.