Chapter 2 Summary
The results of the study provide theoretical basis and outline some related issues on social work services for men in reducing domestic violence. It points out related concepts of domestic violence, forms of domestic violence, and men who commit violence, including the concept of men who commit violence; Psychological characteristics of men who commit violence; Needs and difficulties of GBL men.
The thesis especially reveals the theoretical basis related to social work services with GBL men in reducing domestic violence on social work and social work with domestic violence; social work services and social work services with GBL men; group social work.
To assess the current status of social work services for men who commit domestic violence to reduce domestic violence, the thesis has revealed the contents of activities of 5 typical social work services for men who commit domestic violence, including: Communication and education services to raise awareness in preventing domestic violence; Employment support services for men who commit domestic violence; Legal consulting services for men who commit domestic violence; Individual psychological counseling services for men who commit domestic violence and Men's Clubs and groups of men who commit domestic violence.
In addition, the thesis also explores the theories applied in research on social work services with men to reduce domestic violence, including systems theory, cognitive behavioral theory, client-centered theory, and needs theory.
Finally, in the theoretical basis section, the researcher summarizes the factors affecting the ability of men to participate in social work services and the quality of social work services with men to reduce domestic violence, including factors related to GBL men themselves, social workers, communities, families, legal policies and finances. This is the basis for practical research and proposed solutions to improve the effectiveness of social work services with men to reduce domestic violence.
Chapter 3
CURRENT STATE OF SOCIAL WORK SERVICES FOR MALE COMMITTS OF VIOLENCE TO REDUCE DOMESTIC VIOLENCE IN QUANG NINH PROVINCE
3.1 Characteristics of survey area and interview sample
3.1.1 Characteristics of the survey area
3.1.1.1 Quang Ninh Province and the situation of domestic violence
Quang Ninh is the northeasternmost province of the country, with plains, midlands, mountains, borders, and islands, with a natural area of over 6,100 km2, of which: 87% is mainland, 13% is islands. With 14 administrative units including 04 cities, 02 towns and 08 districts with 186 communes, wards and towns. The ethnic minority and mountainous areas of the province include 112 communes and wards (including 54 disadvantaged communes and wards, including 21 extremely disadvantaged communes and 04 communes in the coastal areas). The province has a land border with China of 118.825 km long; along the border there are 10 communes (including 34 villages and hamlets) and 07 border wards. The population of Quang Ninh province is over 1.2 million people with 22 ethnic groups distributed and residing in 14 administrative units of the province.
Such natural geographical location has brought Quang Ninh province favorable conditions for economic development. The growth rate (GRDP) of the province in recent years has always reached over 10 / year, resulting in GDP per capita also reaching a high level compared to the national average. In 2010, GDP per capita reached 2,200 USD, by 2017 it had increased to over 4,050 USD/person; Quang Ninh's provincial competitiveness index (PCI) ranked 1st among 63 provinces and cities for the first time.
The province pays special attention to social security work: Social security expenditure in the 2011-2015 period was 4,690 billion VND, 2 times higher than the previous period, an increase of 10% over the same period. The National Target Program on New Rural Development has shifted from quantity to quality, associated with job creation to increase people's income and sustainably reduce poverty. Up to now, the poverty rate (according to the multidimensional poverty standard) has decreased by 1.14 (equivalent to 3,799 households) from 3.39 in 2016 (equivalent to 11,582 households) to 2.25 in 2017 (equivalent to 7,783 households), exceeding 0.44% of the annual plan; The rate of trained workers reached 71 (exceeding 0.5% of the annual plan); Creating additional jobs for 19,834 workers, reaching 104 of the annual plan; Training enrollment
vocational training for 34,400 people, reaching 104.24% of the annual plan. Continue to maintain 100 families of meritorious people with a living standard equal to or higher than the average living standard of the local residents; 100 communes and wards do a good job of war invalids, martyrs, and meritorious people; 100% of social protection beneficiaries enjoy social assistance policies and related social policies (Data 2019) [6].
Below is an overview of the situation of domestic violence in Quang Ninh province based on statistics from the Hotline Consulting Service 18001769:
From 2014 to June 2020, the Center has provided consultation for 843 cases related to marriage and family through the free consultation hotline 18001769, direct consultation at the Center and mobile consultation in the community. The Center's free consultation hotline 18001769 has been in operation since 2013 and has so far received over 700 calls related to marriage and family issues, of which about 500 calls were related to physical and mental violence in the family, with the callers being mainly victims (usually the wife) [51].
According to statistics of the People's Committee of Quang Ninh Province, within 10 years (from 2008 to 2018), there were 2,806 cases of domestic violence in the province. The number of domestic violence cases has tended to decrease in recent years, the perpetrators of violence are mostly men [51]. The reduction in domestic violence is an effort of Quang Ninh province in the work of preventing and combating domestic violence in recent years. With the view that investing in the family is investing in sustainable development, the province is interested in investing and mobilizing contributions from the whole society for family work and preventing and combating domestic violence. Every year, the province directs the development of programs, implementation plans, and strategies for developing Vietnamese families in accordance with the local situation. The Steering Committee for family work at all levels is regularly strengthened and issued operating regulations, assigning specific tasks to member sectors. Social work services supporting groups of victims of domestic violence and men with GBV are being implemented synchronously at all levels. Therefore, the work of preventing and combating domestic violence in the province has achieved positive results, contributing to reducing domestic violence.
3.1.1.2 Three survey locations and domestic violence situation in Ha Long City
Ha Long City is one of four cities of Quang Ninh province and is the capital, economic, political, cultural, commercial and service center of Quang Ninh province.
Ha Long has a particularly important position in Vietnam's socio-economic development strategy in trade relations and ensuring national defense and security; has favorable conditions to develop into a tourism center, a hub for industry, trade and transportation along the ASEAN - Vietnam - China economic corridor. Ha Long City was recognized by the Prime Minister as a type I urban area under Decision No. 1838/QD-TTg dated October 10, 2013. After arrangement and adjustment, the new Ha Long City has a natural area of 1,119.36 km2, a population of 300,267 people, and administrative units under Ha Long City include: 33 units, including 21 wards and 12 communes. The population is mainly concentrated in urban areas with 16 ethnic groups living together, of which the Kinh ethnic group accounts for 96%. In 2019, the service industry's production value reached 30,735 billion VND, the total social investment capital was estimated at 37,052 billion VND. The economic structure continued to shift in the right direction, with the service sector accounting for 57.6% (2018 data) [5].
Van Don District
Van Don is a mountainous island district located in the Northeast of the country, with more than 600 large and small islands with a natural land area of 551.33 km2, accounting for 9.3% of the total area of Quang Ninh province, the sea area is 1,620 km2, formed by two archipelagos of Cai Bau (Ke Bao) and Van Hai. Of which, Cai Bau island is the largest at 17,212 hectares, including Cai Rong town and 6 communes. Van Don district has a natural land area of 55,133 hectares, including 600 large and small islands, of which more than 20 islands are inhabited. In 2018: All socio-economic indicators reached and exceeded the plan. Specifically: Aquaculture reached 114% over the same period; total budget revenue reached 282,161 billion VND (118.4% of the same period); The number of tourists increased by 16 compared to the same period in 2017. The strategic plans were basically completed; national defense and security were ensured. Tourism activities and state management of tourism were well implemented; continued to coordinate the implementation of the community tourism project on Quan Lan Island, develop a draft of the operating regulations for the Community Ecotourism Board, and provide training for members and the community participating in 2 discovery trips on Quan Lan Island (Data 2018) [5].
Hai Ha District
Hai Ha District is a mountainous border district bordering the sea to the Northeast of Quang Ninh Province, 150 km from Ha Long City, 40 km from Mong Cai International Border Gate. The North borders China, with a 22.8 km long border. The people
The main ethnic groups are Kinh, Dao, Tay, the rest are San Diu, San Chi, Nung, Muong, Thai, Cao Lan, Củi Chu and Chinese. Hai Ha district has 11 administrative units, including Quang Ha town and 10 communes. The population mainly lives on agriculture, forestry and fishery. Recently, they have gradually shifted to participate in industrial park labor, becoming workers and doing services and tourism.
The economy continues to grow at a high rate (31.95); the economic structure shifts in the right direction, gradually increasing the proportion of industry and services, gradually reducing the proportion of agriculture, forestry and fishery. Total social investment capital reached 10,315.2 billion VND (up 3.6% over the plan). The district's administrative reform index ranked 5th out of 14 localities in the province. People's lives have improved. In 2018, the whole district had 899 near-poor households (down 221 households, exceeding the plan by 30%), reducing the poverty rate from 6.55% to 5.0650. There are
2,347 workers were employed (exceeding the plan by 11.75%), of which the rate of trained workers reached 56.4 (exceeding the plan by 2%) (2018 data) [5].
3.1.2 Characteristics of survey sample
As described above, 300 male perpetrators participated in this survey. The baseline characteristics of the sample are as follows (Table 3.1).
Table 3.1: Description of male respondents (N=300)
STT
Characteristic | Criteria | Quantity | Proportion | |
1 | Age | Under 40 years old | 183 | 61 |
Over 40 years old | 117 | 39 | ||
2 | Nation | Terrible | 239 | 79.7 |
Other ethnic groups | 61 | 20.3 | ||
3 | Place of residence | Van Don | 100 | 33.3 |
Hai Ha | 91 | 30.3 | ||
Ha Long | 109 | 36.3 | ||
4 | Education level | Junior high school and below | 118 | 39.3 |
High school | 144 | 48 | ||
College or higher | 38 | 12.7 | ||
5 | Average income /month of husband | Under 5 million | 196 | 65.3 |
Over 5 million | 104 | 34.7 | ||
6 | Average income /month of wife | Under 5 million | 198 | 66 |
Over 5 million | 102 | 34 |
Maybe you are interested!
-
![Mobile Phone Usage in Hanoi Inner City Area
zt2i3t4l5ee
zt2a3gsconsumer,consumption,consumer behavior,marketing,mobile marketing
zt2a3ge
zc2o3n4t5e6n7ts
- Test the relationship between demographic variables and consumer behavior for Mobile Marketing activities
The analysis method used is the Chi-square test (χ2), with statistical hypotheses H0 and H1 and significance level α = 0.05. In case the P index (p-value) or Sig. index in SPSS has a value less than or equal to the significance level α, the hypothesis H0 is rejected and vice versa. With this testing procedure, the study can evaluate the difference in behavioral trends between demographic groups.
CHAPTER 4
RESEARCH RESULTS
During two months, 1,100 survey questionnaires were distributed to mobile phone users in the inner city of Hanoi using various methods such as direct interviews, sending via email or using questionnaires designed on the Internet. At the end of the survey, after checking and eliminating erroneous questionnaires, the study collected 858 complete questionnaires, equivalent to a rate of about 78%. In addition, the research subjects of the thesis are only people who are using mobile phones, so people who do not use mobile phones are not within the scope of the thesis, therefore, the questionnaires with the option of not using mobile phones were excluded from the scope of analysis. The number of suitable survey questionnaires included in the statistical analysis was 835.
4.1 Demographic characteristics of the sample
The structure of the survey sample is divided and statistically analyzed according to criteria such as gender, age, occupation, education level and personal income. (Detailed statistical table in Appendix 6)
- Gender structure: Of the 835 completed questionnaires, 49.8% of respondents were male, equivalent to 416 people, and 50.2% were female, equivalent to 419 people. The survey results of the study are completely consistent with the gender ratio in the population structure of Vietnam in general and Hanoi in particular (Male/Female: 49/51).
- Age structure: 36.6% of respondents are <23 years old, equivalent to 306 people. People from 23-34 years old
accounting for the highest proportion: 44.8% equivalent to 374 people, people aged 35-45 and >45 are 70 and 85 people equivalent to 8.4% and 10.2% respectively. Looking at the results of this survey, we can see that the young people - youth account for a large proportion of the total number of people participating in the survey. Meanwhile, the middle-aged people including two age groups of 35 - 45 and >45 have a low rate of participation in the survey. This is completely consistent with the reality when Mobile Marketing is identified as a Marketing service aimed at young people (people under 35 years old).
- Structure by educational level: among 835 valid responses, 541 respondents had university degrees, accounting for the highest proportion of ~ 75%, 102 had secondary school degrees, ~ 13.1%, and 93 had post-graduate degrees, ~ 11.9%.
- Occupational structure: office workers and civil servants are the group with the highest rate of participation with 39.4%, followed by students with 36.6%. Self-employed people account for 12%, retired housewives are 7.8% and other occupational groups account for 4.2%. The survey results show that the student group has the same rate as the group aged <23 at 36.6%. This shows the accuracy of the survey data. In addition, the survey results distributed by occupational criteria have a rate almost similar to the sample division rate in chapter 3. Therefore, it can be concluded that the survey data is suitable for use in analysis activities.
- Income structure: the group with income from 3 to 5 million has the highest rate with 39% of the total number of respondents. This is consistent with the income structure of Hanoi people and corresponds to the average income of the group of civil servants and office workers. Those
People with no income account for 23%, income under 3 million VND accounts for 13% and income over 5 million VND accounts for 25%.
4.2 Mobile phone usage in Hanoi inner city area
According to the survey results, most respondents said they had used the phone for more than 1 year, specifically: 68.4% used mobile phones from 4 to 10 years, 23.2% used from 1 to 3 years, 7.8% used for more than 10 years. Those who used mobile phones for less than 1 year accounted for only a very small proportion of ~ 0.6%. (Table 4.1)
Table 4.1: Time spent using mobile phones
Frequency
Ratio (%)
Valid Percentage
Cumulative Percentage
Alid
<1 year
5
.6
.6
.6
1-3 years
194
23.2
23.2
23.8
4-10 years
571
68.4
68.4
92.2
>10 years
65
7.8
7.8
100.0
Total
835
100.0
100.0
The survey indexes on the time of using mobile phones of consumers in the inner city of Hanoi are very impressive for a developing country like Vietnam and also prove that Vietnamese consumers have a lot of experience using this high-tech device. Moreover, with the majority of consumers surveyed having a relatively long time of use (4-10 years), it partly proves that mobile phones have become an important and essential item in peoples daily lives.
When asked about the mobile phone network they are using, 31% of respondents said they are using the network of Vietel company, 29% use the network of
of Mobifone company, 27% use Vinaphone companys network and 13% use networks of other providers such as E-VN telecom, S-fone, Beeline, Vietnammobile. (Figure 4.1).
Figure 4.1: Mobile phone network in use
Compared with the announced market share of mobile telecommunications service providers in Vietnam (Vietel: 36%, Mobifone: 29%, Vinaphone: 28%, the remaining networks: 7%), we see that the survey results do not have many differences. However, the statistics show that there is a difference in the market share of other networks because the Hanoi market is one of the two main markets of small networks, so their market share in this area will certainly be higher than that of the whole country.
According to a report by NielsenMobile (2009) [8], the number of prepaid mobile phone subscribers in Hanoi accounts for 95% of the total number of subscribers, however, the results of this survey show that the percentage of prepaid subscribers has decreased by more than 20%, only at 70.8%. On the contrary, the number of postpaid subscribers tends to increase from 5% in 2009 to 19.2%. Those who are simultaneously using both types of subscriptions account for 10%. (Table 4.2).
Table 4.2: Types of mobile phone subscribers
Frequency
Ratio (%)
Valid Percentage
Cumulative Percentage
Valid
Prepay
591
70.8
70.8
70.8
Pay later
160
19.2
19.2
89.9
Both of the above
84
10.1
10.1
100.0
Total
835
100.0
100.0
The above figures show the change in the psychology and consumption habits of Vietnamese consumers towards mobile telecommunications services, when the use of prepaid subscriptions and junk SIMs is replaced by the use of two types of subscriptions for different purposes and needs or switching to postpaid subscriptions to enjoy better customer care services.
In addition, the majority of respondents have an average spending level for mobile phone services from 100 to 300 thousand VND (406 ~ 48.6% of total respondents). The high spending level (> 500 thousand VND) is the spending level with the lowest number of people with only 8.4%, on the contrary, the low spending level (under 100 thousand VND) accounts for the second highest proportion among the groups of respondents with 25.4%. People with low spending levels mainly fall into the group of students and retirees/housewives - those who have little need to use or mainly use promotional SIM cards. (Table 4.3).
Table 4.3: Spending on mobile phone charges
Frequency
Ratio (%)
Valid Percentage
Cumulative Percentage
Valid
<100,000
212
25.4
25.4
25.4
100-300,000
406
48.6
48.6
74.0
300,000-500,000
147
17.6
17.6
91.6
>500,000
70
8.4
8.4
100.0
Total
835
100.0
100.0
The statistics in Table 4.3 are similar to the percentages in the NielsenMobile survey results (2009) with 73% of mobile phone users having medium spending levels and only 13% having high spending levels.
The survey results also showed that up to 31% ~ nearly one-third of respondents said they sent more than 10 SMS messages/day, meaning that on average they sent 1 SMS message for every working hour. Those with an average SMS message volume (from 3 to 10 messages/day) accounted for 51.1% and those with a low SMS message volume (less than 3 messages/day) accounted for 17%. (Table 4.4)
Table 4.4: Number of SMS messages sent per day
Frequency
Ratio (%)
Valid Percentage
Cumulative Percentage
Valid
<3 news
142
17.0
17.0
17.0
3-10 news
427
51.1
51.1
68.1
>10 news
266
31.9
31.9
100.0
Total
835
100.0
100.0
Similar to sending messages, those with an average message receiving rate (from 3-10 messages/day) accounted for the highest percentage of ~ 55%, followed by those with a high number of messages (over 10 messages/day) ~ 24% and those with a low number of messages received daily (under 3 messages/day) remained at the bottom with 21%. (Table 4.5)
Table 4.5: Number of SMS messages received per day
Frequency
Ratio (%)
Valid Percentage
Cumulative Percentage
Valid
<3 news
175
21.0
21.0
21.0
3-10 news
436
55.0
55.0
76.0
>10 news
197
24.0
24.0
100.0
Total
835
100.0
100.0
When comparing the data of the two result tables 4.4 and 4.5, we can see the reasonableness between the ratio of the number of messages sent and the number of messages received daily by the interview participants.
4.3 Current status of SMS advertising and Mobile Marketing
According to the interview results, in the 3 months from the time of the survey and before, 94% of respondents, equivalent to 785 people, said they received advertising messages, while only a very small percentage of 6% (only 50 people) did not receive advertising messages (Table 4.6).
Table 4.6: Percentage of people receiving advertising messages in the last 3 months
Frequency
Ratio (%)
Valid Percentage
Cumulative Percentage
Valid
Have
785
94.0
94.0
94.0
Are not
50
6.0
6.0
100.0
Total
835
100.0
100.0
The results of Table 4.6 show that consumers in the inner city of Hanoi are very familiar with advertising messages. This result is also the basis for assessing the knowledge, experience and understanding of the respondents in the interview. This is also one of the important factors determining the accuracy of the survey results.
In addition, most respondents said they had received promotional messages, but only 24% of them had ever taken the action of registering to receive promotional messages, while 76% of the remaining respondents did not register to receive promotional messages but still received promotional messages every day. This is the first sign indicating the weaknesses and shortcomings of lax management of this activity in Vietnam. (Table 4.7)
div.maincontent .s1 { color: black; font-family:Times New Roman, serif; font-style: italic; font-weight: normal; text-decoration: none; font-size: 14pt; } div.maincontent .s2 { color: black; font-family:Times New Roman, serif; font-style: normal; font-weight: bold; text-decoration: none; font-size: 14pt; } div.maincontent .s3 { color: black; font-family:Times New Roman, serif; font-style: normal; font-weight: bold; text-decoration: none; font-size: 14pt; } div.maincontent .p { color: black; font-family:Times New Roman, serif; font-style: normal; font-weight: normal; text-decoration: none; font-size: 14pt; margin:0pt; } div.maincontent p { color: black; font-family:Times New Roman, serif; font-style: normal; font-weight: normal; text-decoration: none; font-size: 14pt; margin:0pt; } div.maincontent .s4 { color: black; font-family:Times New Roman, serif; font-style: normal; font-weight: normal; text-decoration: none; font-size: 9.5pt; vertical-align: 6pt; } div.maincontent .s5 { color: black; font-family:Times New Roman, serif; font-style: normal; font-weight: bold; text-decoration: none; font-size: 14pt; } div.maincontent .s6 { color: black; font-family:Times New Roman, serif; font-style: normal; font-weight: bold; text-decoration: none; font-size: 14pt; } div.maincontent .s7 { color: black; font-family:Times New Roman, serif; font-style: italic; font-weight: normal; text-decoration: none; font-size: 14pt; } div.maincontent .s8 { color: black; font-family:Times New Roman, serif; font-style: italic; font-weight: bold; text-decoration: none; font-size: 14pt; } div.maincontent .s9 { color: black; font-family:Arial, sans-serif; font-style: normal; font-weight: normal; text-decoration: none; font-size: 14pt; } div.maincontent .s10 { color: black; font-family:Arial, sans-serif; font-style: normal; font-weight: normal; text-decoration: none; font-size: 12pt; } div.maincontent .s11 { color: black; font-family:Times New Roman, serif; font-style: normal; font-weight: normal; font-size: 14pt; } div.maincontent .s12 { color: black; font-family:Arial, sans-serif; font-style: normal; font-weight: normal; text-decoration: none; font-size: 14pt; } div.maincontent .s13 { color: black; font-family:Times New Roman, serif; font-style: normal; font-weight: normal; text-decoration: none; font-size: 14pt; } div.maincontent .s14 { color: black; font-family:Times New Roman, serif; font-style: normal; font-weight: bold; text-decoration: none; font-size: 13pt; } div.maincontent .s15 { color: black; font-family:Times New Roman, serif; font-style: italic; font-weight: normal; text-decoration: none; font-size: 9.5pt; vertical-align: 6pt; } div.maincontent .s16 { color: black; font-family:Times New Roman, serif; font-style: normal; font-weight: normal; text-decoration: none; font-size: 5.5pt; vertical-align: 3pt; } div.maincontent .s17 { color: black; font-family:Times New Roman, serif; font-style: normal; font-weight: normal; text-decoration: none; font-size: 8.5pt; } div.maincontent .s18 { color: black; font-family:Times New Roman, serif; font-style: italic; font-weight: bold; font-size: 14pt; } div.maincontent .s19 { color: black; font-family:Times New Roman, serif; font-style: normal; font-weight: bold; font-size: 14pt; } div.maincontent .s20 { color: black; font-family:Times New Roman, serif; font-style: italic; font-weight: normal; text-decoration: none; font-size: 13pt; } div.maincontent .s21 { color: black; font-family:Times New Roman, serif; font-style: normal; font-weight: normal; text-decoration: none; font-size: 14pt; } div.maincontent .s22 { color: black; font-family:Courier New, monospace; font-style: normal; font-weight: normal; text-decoration: none; font-size: 14pt; } div.maincontent .s23 { color: black; font-family:Times New Roman, serif; font-style: normal; font-weight: normal; text-decoration: none; font-size: 13pt; } div.maincontent .s24 { color: black; font-family:Times New Roman, serif; font-style: italic; font-weight: normal; text-decoration: none; font-size: 13pt; } div.maincontent .s25 { color: black; font-family:Times New Roman, serif; font-style: normal; font-weight: bold; text-decoration: none; font-size: 14pt; } div.maincontent .s26 { color: black; font-family:Times New Roman, serif; font-style: normal; font-weight: normal; text-decoration: none; font-size: 14pt; } div.maincontent .s27 { color: black; font-family:Times New Roman, serif; font-style: normal; font-weight: normal; text-decoration: none; font-size: 1.5pt; } div.maincontent .s28 { color: black; font-family:Times New Roman, serif; font-style: normal; font-weight: normal; text-decoration: none; font-size: 11pt; } div.maincontent .s29 { color: black; font-family:Times New Roman, serif; font-style: normal; font-weight: bold; text-decoration: none; font-size: 13pt; } div.maincontent .s30 { color: black; font-family:Times New Roman, serif; font-style: italic; font-weight: bold; text-decoration: none; font-size: 13pt; } div.maincontent .s31 { color: black; font-family:Times New Roman, serif; font-style: normal; font-weight: normal; text-decoration: none; font-size: 13pt; } div.maincontent .s32 { color: black; font-family:Arial, sans-serif; font-style: normal; font-weight: normal; text-decoration: none; font-size: 10.5pt; } div.maincontent .s33 { color: black; font-family:Arial, sans-serif; font-style: normal; font-weight: normal; text-decoration: none; font-size: 11pt; } div.maincontent .s35 { color: black; font-family:Arial, sans-serif; font-style: normal; font-weight: bold; text-decoration: none; font-size: 10.5pt; } div.maincontent .s36 { color: #F00; font-family:Arial, sans-serif; font-style: italic; font-weight: bold; text-decoration: none; font-size: 10.5pt; } div.maincontent .s37 { color: black; font-family:Arial, sans-serif; font-style: normal; font-weight: bold; text-decoration: none; font-size: 10.5pt; } div.maincontent .s38 { color: black; font-family:Times New Roman, serif; font-style: normal; font-weight: bold; text-decoration: none; font-size: 8.5pt; vertical-align: 5pt; } div.maincontent .s39 { color: black; font-family:Arial, sans-serif; font-style: normal; font-weight: normal; text-decoration: none; font-size: 10.5pt; } div.maincontent .s40 { color: black; font-family:Arial, sans-serif; font-style: normal; font-weight: normal; text-decoration: none; font-size: 7pt; vertical-align: 4pt; } div.maincontent .s41 { color: black; font-family:Arial, sans-serif; font-style: normal; font-weight: bold; text-decoration: none; font-size: 10.5pt; } div.maincontent .s42 { color: black; font-family:Arial, sans-serif; font-style: normal; font-weight: bold; text-decoration: none; font-size: 11pt; } div.maincontent .s43 { color: black; font-family:Arial, sans-serif; font-style: normal; font-weight: bold; text-decoration: none; font-size: 7.5pt; vertical-align: 5pt; } div.maincontent .s44 { color: black; font-family:Arial, sans-serif; font-style: normal; font-weight: normal; text-decoration: none; font-size: 7pt; vertical-align: 5pt; } div.maincontent .s45 { color: #F00; font-family:Arial, sans-serif; font-style: normal; font-weight: bold; text-decoration: none; font-size: 10.5pt; } div.maincontent .s46 { color: black; font-family:Arial, sans-serif; font-style: normal; font-weight: bold; text-decoration: none; font-size: 7pt; vertical-align: 5pt; } div.maincontent .s47 { color: black; font-family:Arial, sans-serif; font-style: normal; font-weight: bold; text-decoration: none; font-size: 11pt; } div.maincontent .s48 { color: black; font-family:Times New Roman, serif; font-style: normal; font-weight: normal; text-decoration: none; font-size: 14pt; } div.maincontent .s49 { color: black; font-family:Times New Roman, serif; font-style: italic; font-weight: normal; text-decoration: none; font-size: 9.5pt; vertical-align: -2pt; } div.maincontent .s50 { color: black; font-family:Times New Roman, serif; font-style: normal; font-weight: normal; text-decoration: none; font-size: 9.5pt; } div.maincontent .s51 { color: black; font-family:Times New Roman, serif; font-style: italic; font-weight: normal; text-decoration: none; font-size: 9.5pt; vertical-align: -1pt; } div.maincontent .s52 { color: black; font-family:Times New Roman, serif; font-style: normal; font-weight: normal; text-decoration: none; font-size: 9.5pt; vertical-align: -2pt; } div.maincontent .s53 { color: black; font-family:Times New Roman, serif; font-style: normal; font-weight: normal; text-decoration: none; font-size: 13pt; } div.maincontent .s54 { color: black; font-family:Times New Roman, serif; font-style: normal; font-weight: normal; text-decoration: none; font-size: 9.5pt; vertical-align: -1pt; } div.maincontent .s55 { color: black; font-family:Arial, sans-serif; font-style: normal; font-weight: normal; text-decoration: none; font-size: 10.5pt; } div.maincontent .s56 { color: #00F; font-family:Times New Roman, serif; font-style: normal; font-weight: normal; font-size: 14pt; } div.maincontent .s57 { color: #00F; font-family:Times New Roman, serif; font-style: normal; font-weight: normal; text-decoration: none; font-size: 14pt; } div.maincontent .s58 { color: #00F; font-family:Times New Roman, serif; font-style: normal; font-weight: normal; font-size: 14pt; } div.maincontent .s59 { color: #00F; font-family:Times New Roman, serif; font-style: normal; font-weight: normal; text-decoration: none; font-size: 13pt; } div.maincontent .s60 { color: #00F; font-family:Times New Roman, serif; font-style: normal; font-weight: normal; font-size: 13pt; } div.maincontent .s61 { color: black; font-family:Times New Roman, serif; font-style: normal; font-weight: bold; text-decoration: none; font-size: 14pt; } div.maincontent .s62 { color: black; font-family:Times New Roman, serif; font-style: italic; font-weight: bold; text-decoration: none; font-size: 14pt; } div.maincontent .s63 { color: black; font-family:Times New Roman, serif; font-style: italic; font-weight: bold; text-decoration: none; font-size: 14pt; } div.maincontent .content_head2 { color: #F00; font-family:Times New Roman, serif; font-style: normal; font-weight: bold; text-decoration: none; font-size: 14pt; } div.maincontent .s64 { color: black; font-family:Times New Roman, serif; font-style: italic; font-weight: bold; text-decoration: none; font-size: 13pt; } div.maincontent .s67 { color: black; font-family:Arial, sans-serif; font-style: normal; font-weight: normal; text-decoration: none; font-size: 9.5pt; } div.maincontent .s68 { color: black; font-family:Times New Roman, serif; font-style: normal; font-weight: bold; text-decoration: none; font-size: 12pt; } div.maincontent .s69 { color: black; font-family:Times New Roman, serif; font-style: italic; font-weight: normal; text-decoration: none; font-size: 12pt; } div.maincontent .s70 { color: black; font-family:Times New Roman, serif; font-style: normal; font-weight: normal; tex](https://tailieuthamkhao.com/uploads/2022/12/03/cac-nhan-to-anh-huong-den-hanh-vi-nguoi-tieu-dung-doi-voi-hoat-dong-13-1-120x90.jpg)
![Mobile Phone Usage in Hanoi Inner City Area
zt2i3t4l5ee
zt2a3gsconsumer,consumption,consumer behavior,marketing,mobile marketing
zt2a3ge
zc2o3n4t5e6n7ts
- Test the relationship between demographic variables and consumer behavior for Mobile Marketing activities
The analysis method used is the Chi-square test (χ2), with statistical hypotheses H0 and H1 and significance level α = 0.05. In case the P index (p-value) or Sig. index in SPSS has a value less than or equal to the significance level α, the hypothesis H0 is rejected and vice versa. With this testing procedure, the study can evaluate the difference in behavioral trends between demographic groups.
CHAPTER 4
RESEARCH RESULTS
During two months, 1,100 survey questionnaires were distributed to mobile phone users in the inner city of Hanoi using various methods such as direct interviews, sending via email or using questionnaires designed on the Internet. At the end of the survey, after checking and eliminating erroneous questionnaires, the study collected 858 complete questionnaires, equivalent to a rate of about 78%. In addition, the research subjects of the thesis are only people who are using mobile phones, so people who do not use mobile phones are not within the scope of the thesis, therefore, the questionnaires with the option of not using mobile phones were excluded from the scope of analysis. The number of suitable survey questionnaires included in the statistical analysis was 835.
4.1 Demographic characteristics of the sample
The structure of the survey sample is divided and statistically analyzed according to criteria such as gender, age, occupation, education level and personal income. (Detailed statistical table in Appendix 6)
- Gender structure: Of the 835 completed questionnaires, 49.8% of respondents were male, equivalent to 416 people, and 50.2% were female, equivalent to 419 people. The survey results of the study are completely consistent with the gender ratio in the population structure of Vietnam in general and Hanoi in particular (Male/Female: 49/51).
- Age structure: 36.6% of respondents are <23 years old, equivalent to 306 people. People from 23-34 years old
accounting for the highest proportion: 44.8% equivalent to 374 people, people aged 35-45 and >45 are 70 and 85 people equivalent to 8.4% and 10.2% respectively. Looking at the results of this survey, we can see that the young people - youth account for a large proportion of the total number of people participating in the survey. Meanwhile, the middle-aged people including two age groups of 35 - 45 and >45 have a low rate of participation in the survey. This is completely consistent with the reality when Mobile Marketing is identified as a Marketing service aimed at young people (people under 35 years old).
- Structure by educational level: among 835 valid responses, 541 respondents had university degrees, accounting for the highest proportion of ~ 75%, 102 had secondary school degrees, ~ 13.1%, and 93 had post-graduate degrees, ~ 11.9%.
- Occupational structure: office workers and civil servants are the group with the highest rate of participation with 39.4%, followed by students with 36.6%. Self-employed people account for 12%, retired housewives are 7.8% and other occupational groups account for 4.2%. The survey results show that the student group has the same rate as the group aged <23 at 36.6%. This shows the accuracy of the survey data. In addition, the survey results distributed by occupational criteria have a rate almost similar to the sample division rate in chapter 3. Therefore, it can be concluded that the survey data is suitable for use in analysis activities.
- Income structure: the group with income from 3 to 5 million has the highest rate with 39% of the total number of respondents. This is consistent with the income structure of Hanoi people and corresponds to the average income of the group of civil servants and office workers. Those
People with no income account for 23%, income under 3 million VND accounts for 13% and income over 5 million VND accounts for 25%.
4.2 Mobile phone usage in Hanoi inner city area
According to the survey results, most respondents said they had used the phone for more than 1 year, specifically: 68.4% used mobile phones from 4 to 10 years, 23.2% used from 1 to 3 years, 7.8% used for more than 10 years. Those who used mobile phones for less than 1 year accounted for only a very small proportion of ~ 0.6%. (Table 4.1)
Table 4.1: Time spent using mobile phones
Frequency
Ratio (%)
Valid Percentage
Cumulative Percentage
Alid
<1 year
5
.6
.6
.6
1-3 years
194
23.2
23.2
23.8
4-10 years
571
68.4
68.4
92.2
>10 years
65
7.8
7.8
100.0
Total
835
100.0
100.0
The survey indexes on the time of using mobile phones of consumers in the inner city of Hanoi are very impressive for a developing country like Vietnam and also prove that Vietnamese consumers have a lot of experience using this high-tech device. Moreover, with the majority of consumers surveyed having a relatively long time of use (4-10 years), it partly proves that mobile phones have become an important and essential item in peoples daily lives.
When asked about the mobile phone network they are using, 31% of respondents said they are using the network of Vietel company, 29% use the network of
of Mobifone company, 27% use Vinaphone companys network and 13% use networks of other providers such as E-VN telecom, S-fone, Beeline, Vietnammobile. (Figure 4.1).
Figure 4.1: Mobile phone network in use
Compared with the announced market share of mobile telecommunications service providers in Vietnam (Vietel: 36%, Mobifone: 29%, Vinaphone: 28%, the remaining networks: 7%), we see that the survey results do not have many differences. However, the statistics show that there is a difference in the market share of other networks because the Hanoi market is one of the two main markets of small networks, so their market share in this area will certainly be higher than that of the whole country.
According to a report by NielsenMobile (2009) [8], the number of prepaid mobile phone subscribers in Hanoi accounts for 95% of the total number of subscribers, however, the results of this survey show that the percentage of prepaid subscribers has decreased by more than 20%, only at 70.8%. On the contrary, the number of postpaid subscribers tends to increase from 5% in 2009 to 19.2%. Those who are simultaneously using both types of subscriptions account for 10%. (Table 4.2).
Table 4.2: Types of mobile phone subscribers
Frequency
Ratio (%)
Valid Percentage
Cumulative Percentage
Valid
Prepay
591
70.8
70.8
70.8
Pay later
160
19.2
19.2
89.9
Both of the above
84
10.1
10.1
100.0
Total
835
100.0
100.0
The above figures show the change in the psychology and consumption habits of Vietnamese consumers towards mobile telecommunications services, when the use of prepaid subscriptions and junk SIMs is replaced by the use of two types of subscriptions for different purposes and needs or switching to postpaid subscriptions to enjoy better customer care services.
In addition, the majority of respondents have an average spending level for mobile phone services from 100 to 300 thousand VND (406 ~ 48.6% of total respondents). The high spending level (> 500 thousand VND) is the spending level with the lowest number of people with only 8.4%, on the contrary, the low spending level (under 100 thousand VND) accounts for the second highest proportion among the groups of respondents with 25.4%. People with low spending levels mainly fall into the group of students and retirees/housewives - those who have little need to use or mainly use promotional SIM cards. (Table 4.3).
Table 4.3: Spending on mobile phone charges
Frequency
Ratio (%)
Valid Percentage
Cumulative Percentage
Valid
<100,000
212
25.4
25.4
25.4
100-300,000
406
48.6
48.6
74.0
300,000-500,000
147
17.6
17.6
91.6
>500,000
70
8.4
8.4
100.0
Total
835
100.0
100.0
The statistics in Table 4.3 are similar to the percentages in the NielsenMobile survey results (2009) with 73% of mobile phone users having medium spending levels and only 13% having high spending levels.
The survey results also showed that up to 31% ~ nearly one-third of respondents said they sent more than 10 SMS messages/day, meaning that on average they sent 1 SMS message for every working hour. Those with an average SMS message volume (from 3 to 10 messages/day) accounted for 51.1% and those with a low SMS message volume (less than 3 messages/day) accounted for 17%. (Table 4.4)
Table 4.4: Number of SMS messages sent per day
Frequency
Ratio (%)
Valid Percentage
Cumulative Percentage
Valid
<3 news
142
17.0
17.0
17.0
3-10 news
427
51.1
51.1
68.1
>10 news
266
31.9
31.9
100.0
Total
835
100.0
100.0
Similar to sending messages, those with an average message receiving rate (from 3-10 messages/day) accounted for the highest percentage of ~ 55%, followed by those with a high number of messages (over 10 messages/day) ~ 24% and those with a low number of messages received daily (under 3 messages/day) remained at the bottom with 21%. (Table 4.5)
Table 4.5: Number of SMS messages received per day
Frequency
Ratio (%)
Valid Percentage
Cumulative Percentage
Valid
<3 news
175
21.0
21.0
21.0
3-10 news
436
55.0
55.0
76.0
>10 news
197
24.0
24.0
100.0
Total
835
100.0
100.0
When comparing the data of the two result tables 4.4 and 4.5, we can see the reasonableness between the ratio of the number of messages sent and the number of messages received daily by the interview participants.
4.3 Current status of SMS advertising and Mobile Marketing
According to the interview results, in the 3 months from the time of the survey and before, 94% of respondents, equivalent to 785 people, said they received advertising messages, while only a very small percentage of 6% (only 50 people) did not receive advertising messages (Table 4.6).
Table 4.6: Percentage of people receiving advertising messages in the last 3 months
Frequency
Ratio (%)
Valid Percentage
Cumulative Percentage
Valid
Have
785
94.0
94.0
94.0
Are not
50
6.0
6.0
100.0
Total
835
100.0
100.0
The results of Table 4.6 show that consumers in the inner city of Hanoi are very familiar with advertising messages. This result is also the basis for assessing the knowledge, experience and understanding of the respondents in the interview. This is also one of the important factors determining the accuracy of the survey results.
In addition, most respondents said they had received promotional messages, but only 24% of them had ever taken the action of registering to receive promotional messages, while 76% of the remaining respondents did not register to receive promotional messages but still received promotional messages every day. This is the first sign indicating the weaknesses and shortcomings of lax management of this activity in Vietnam. (Table 4.7)
div.maincontent .s1 { color: black; font-family:Times New Roman, serif; font-style: italic; font-weight: normal; text-decoration: none; font-size: 14pt; } div.maincontent .s2 { color: black; font-family:Times New Roman, serif; font-style: normal; font-weight: bold; text-decoration: none; font-size: 14pt; } div.maincontent .s3 { color: black; font-family:Times New Roman, serif; font-style: normal; font-weight: bold; text-decoration: none; font-size: 14pt; } div.maincontent .p { color: black; font-family:Times New Roman, serif; font-style: normal; font-weight: normal; text-decoration: none; font-size: 14pt; margin:0pt; } div.maincontent p { color: black; font-family:Times New Roman, serif; font-style: normal; font-weight: normal; text-decoration: none; font-size: 14pt; margin:0pt; } div.maincontent .s4 { color: black; font-family:Times New Roman, serif; font-style: normal; font-weight: normal; text-decoration: none; font-size: 9.5pt; vertical-align: 6pt; } div.maincontent .s5 { color: black; font-family:Times New Roman, serif; font-style: normal; font-weight: bold; text-decoration: none; font-size: 14pt; } div.maincontent .s6 { color: black; font-family:Times New Roman, serif; font-style: normal; font-weight: bold; text-decoration: none; font-size: 14pt; } div.maincontent .s7 { color: black; font-family:Times New Roman, serif; font-style: italic; font-weight: normal; text-decoration: none; font-size: 14pt; } div.maincontent .s8 { color: black; font-family:Times New Roman, serif; font-style: italic; font-weight: bold; text-decoration: none; font-size: 14pt; } div.maincontent .s9 { color: black; font-family:Arial, sans-serif; font-style: normal; font-weight: normal; text-decoration: none; font-size: 14pt; } div.maincontent .s10 { color: black; font-family:Arial, sans-serif; font-style: normal; font-weight: normal; text-decoration: none; font-size: 12pt; } div.maincontent .s11 { color: black; font-family:Times New Roman, serif; font-style: normal; font-weight: normal; font-size: 14pt; } div.maincontent .s12 { color: black; font-family:Arial, sans-serif; font-style: normal; font-weight: normal; text-decoration: none; font-size: 14pt; } div.maincontent .s13 { color: black; font-family:Times New Roman, serif; font-style: normal; font-weight: normal; text-decoration: none; font-size: 14pt; } div.maincontent .s14 { color: black; font-family:Times New Roman, serif; font-style: normal; font-weight: bold; text-decoration: none; font-size: 13pt; } div.maincontent .s15 { color: black; font-family:Times New Roman, serif; font-style: italic; font-weight: normal; text-decoration: none; font-size: 9.5pt; vertical-align: 6pt; } div.maincontent .s16 { color: black; font-family:Times New Roman, serif; font-style: normal; font-weight: normal; text-decoration: none; font-size: 5.5pt; vertical-align: 3pt; } div.maincontent .s17 { color: black; font-family:Times New Roman, serif; font-style: normal; font-weight: normal; text-decoration: none; font-size: 8.5pt; } div.maincontent .s18 { color: black; font-family:Times New Roman, serif; font-style: italic; font-weight: bold; font-size: 14pt; } div.maincontent .s19 { color: black; font-family:Times New Roman, serif; font-style: normal; font-weight: bold; font-size: 14pt; } div.maincontent .s20 { color: black; font-family:Times New Roman, serif; font-style: italic; font-weight: normal; text-decoration: none; font-size: 13pt; } div.maincontent .s21 { color: black; font-family:Times New Roman, serif; font-style: normal; font-weight: normal; text-decoration: none; font-size: 14pt; } div.maincontent .s22 { color: black; font-family:Courier New, monospace; font-style: normal; font-weight: normal; text-decoration: none; font-size: 14pt; } div.maincontent .s23 { color: black; font-family:Times New Roman, serif; font-style: normal; font-weight: normal; text-decoration: none; font-size: 13pt; } div.maincontent .s24 { color: black; font-family:Times New Roman, serif; font-style: italic; font-weight: normal; text-decoration: none; font-size: 13pt; } div.maincontent .s25 { color: black; font-family:Times New Roman, serif; font-style: normal; font-weight: bold; text-decoration: none; font-size: 14pt; } div.maincontent .s26 { color: black; font-family:Times New Roman, serif; font-style: normal; font-weight: normal; text-decoration: none; font-size: 14pt; } div.maincontent .s27 { color: black; font-family:Times New Roman, serif; font-style: normal; font-weight: normal; text-decoration: none; font-size: 1.5pt; } div.maincontent .s28 { color: black; font-family:Times New Roman, serif; font-style: normal; font-weight: normal; text-decoration: none; font-size: 11pt; } div.maincontent .s29 { color: black; font-family:Times New Roman, serif; font-style: normal; font-weight: bold; text-decoration: none; font-size: 13pt; } div.maincontent .s30 { color: black; font-family:Times New Roman, serif; font-style: italic; font-weight: bold; text-decoration: none; font-size: 13pt; } div.maincontent .s31 { color: black; font-family:Times New Roman, serif; font-style: normal; font-weight: normal; text-decoration: none; font-size: 13pt; } div.maincontent .s32 { color: black; font-family:Arial, sans-serif; font-style: normal; font-weight: normal; text-decoration: none; font-size: 10.5pt; } div.maincontent .s33 { color: black; font-family:Arial, sans-serif; font-style: normal; font-weight: normal; text-decoration: none; font-size: 11pt; } div.maincontent .s35 { color: black; font-family:Arial, sans-serif; font-style: normal; font-weight: bold; text-decoration: none; font-size: 10.5pt; } div.maincontent .s36 { color: #F00; font-family:Arial, sans-serif; font-style: italic; font-weight: bold; text-decoration: none; font-size: 10.5pt; } div.maincontent .s37 { color: black; font-family:Arial, sans-serif; font-style: normal; font-weight: bold; text-decoration: none; font-size: 10.5pt; } div.maincontent .s38 { color: black; font-family:Times New Roman, serif; font-style: normal; font-weight: bold; text-decoration: none; font-size: 8.5pt; vertical-align: 5pt; } div.maincontent .s39 { color: black; font-family:Arial, sans-serif; font-style: normal; font-weight: normal; text-decoration: none; font-size: 10.5pt; } div.maincontent .s40 { color: black; font-family:Arial, sans-serif; font-style: normal; font-weight: normal; text-decoration: none; font-size: 7pt; vertical-align: 4pt; } div.maincontent .s41 { color: black; font-family:Arial, sans-serif; font-style: normal; font-weight: bold; text-decoration: none; font-size: 10.5pt; } div.maincontent .s42 { color: black; font-family:Arial, sans-serif; font-style: normal; font-weight: bold; text-decoration: none; font-size: 11pt; } div.maincontent .s43 { color: black; font-family:Arial, sans-serif; font-style: normal; font-weight: bold; text-decoration: none; font-size: 7.5pt; vertical-align: 5pt; } div.maincontent .s44 { color: black; font-family:Arial, sans-serif; font-style: normal; font-weight: normal; text-decoration: none; font-size: 7pt; vertical-align: 5pt; } div.maincontent .s45 { color: #F00; font-family:Arial, sans-serif; font-style: normal; font-weight: bold; text-decoration: none; font-size: 10.5pt; } div.maincontent .s46 { color: black; font-family:Arial, sans-serif; font-style: normal; font-weight: bold; text-decoration: none; font-size: 7pt; vertical-align: 5pt; } div.maincontent .s47 { color: black; font-family:Arial, sans-serif; font-style: normal; font-weight: bold; text-decoration: none; font-size: 11pt; } div.maincontent .s48 { color: black; font-family:Times New Roman, serif; font-style: normal; font-weight: normal; text-decoration: none; font-size: 14pt; } div.maincontent .s49 { color: black; font-family:Times New Roman, serif; font-style: italic; font-weight: normal; text-decoration: none; font-size: 9.5pt; vertical-align: -2pt; } div.maincontent .s50 { color: black; font-family:Times New Roman, serif; font-style: normal; font-weight: normal; text-decoration: none; font-size: 9.5pt; } div.maincontent .s51 { color: black; font-family:Times New Roman, serif; font-style: italic; font-weight: normal; text-decoration: none; font-size: 9.5pt; vertical-align: -1pt; } div.maincontent .s52 { color: black; font-family:Times New Roman, serif; font-style: normal; font-weight: normal; text-decoration: none; font-size: 9.5pt; vertical-align: -2pt; } div.maincontent .s53 { color: black; font-family:Times New Roman, serif; font-style: normal; font-weight: normal; text-decoration: none; font-size: 13pt; } div.maincontent .s54 { color: black; font-family:Times New Roman, serif; font-style: normal; font-weight: normal; text-decoration: none; font-size: 9.5pt; vertical-align: -1pt; } div.maincontent .s55 { color: black; font-family:Arial, sans-serif; font-style: normal; font-weight: normal; text-decoration: none; font-size: 10.5pt; } div.maincontent .s56 { color: #00F; font-family:Times New Roman, serif; font-style: normal; font-weight: normal; font-size: 14pt; } div.maincontent .s57 { color: #00F; font-family:Times New Roman, serif; font-style: normal; font-weight: normal; text-decoration: none; font-size: 14pt; } div.maincontent .s58 { color: #00F; font-family:Times New Roman, serif; font-style: normal; font-weight: normal; font-size: 14pt; } div.maincontent .s59 { color: #00F; font-family:Times New Roman, serif; font-style: normal; font-weight: normal; text-decoration: none; font-size: 13pt; } div.maincontent .s60 { color: #00F; font-family:Times New Roman, serif; font-style: normal; font-weight: normal; font-size: 13pt; } div.maincontent .s61 { color: black; font-family:Times New Roman, serif; font-style: normal; font-weight: bold; text-decoration: none; font-size: 14pt; } div.maincontent .s62 { color: black; font-family:Times New Roman, serif; font-style: italic; font-weight: bold; text-decoration: none; font-size: 14pt; } div.maincontent .s63 { color: black; font-family:Times New Roman, serif; font-style: italic; font-weight: bold; text-decoration: none; font-size: 14pt; } div.maincontent .content_head2 { color: #F00; font-family:Times New Roman, serif; font-style: normal; font-weight: bold; text-decoration: none; font-size: 14pt; } div.maincontent .s64 { color: black; font-family:Times New Roman, serif; font-style: italic; font-weight: bold; text-decoration: none; font-size: 13pt; } div.maincontent .s67 { color: black; font-family:Arial, sans-serif; font-style: normal; font-weight: normal; text-decoration: none; font-size: 9.5pt; } div.maincontent .s68 { color: black; font-family:Times New Roman, serif; font-style: normal; font-weight: bold; text-decoration: none; font-size: 12pt; } div.maincontent .s69 { color: black; font-family:Times New Roman, serif; font-style: italic; font-weight: normal; text-decoration: none; font-size: 12pt; } div.maincontent .s70 { color: black; font-family:Times New Roman, serif; font-style: normal; font-weight: normal; tex](data:image/svg+xml,%3Csvg%20xmlns=%22http://www.w3.org/2000/svg%22%20viewBox=%220%200%2075%2075%22%3E%3C/svg%3E) Mobile Phone Usage in Hanoi Inner City Area
zt2i3t4l5ee
zt2a3gsconsumer,consumption,consumer behavior,marketing,mobile marketing
zt2a3ge
zc2o3n4t5e6n7ts
- Test the relationship between demographic variables and consumer behavior for Mobile Marketing activities
The analysis method used is the Chi-square test (χ2), with statistical hypotheses H0 and H1 and significance level α = 0.05. In case the P index (p-value) or Sig. index in SPSS has a value less than or equal to the significance level α, the hypothesis H0 is rejected and vice versa. With this testing procedure, the study can evaluate the difference in behavioral trends between demographic groups.
CHAPTER 4
RESEARCH RESULTS
During two months, 1,100 survey questionnaires were distributed to mobile phone users in the inner city of Hanoi using various methods such as direct interviews, sending via email or using questionnaires designed on the Internet. At the end of the survey, after checking and eliminating erroneous questionnaires, the study collected 858 complete questionnaires, equivalent to a rate of about 78%. In addition, the research subjects of the thesis are only people who are using mobile phones, so people who do not use mobile phones are not within the scope of the thesis, therefore, the questionnaires with the option of not using mobile phones were excluded from the scope of analysis. The number of suitable survey questionnaires included in the statistical analysis was 835.
4.1 Demographic characteristics of the sample
The structure of the survey sample is divided and statistically analyzed according to criteria such as gender, age, occupation, education level and personal income. (Detailed statistical table in Appendix 6)
- Gender structure: Of the 835 completed questionnaires, 49.8% of respondents were male, equivalent to 416 people, and 50.2% were female, equivalent to 419 people. The survey results of the study are completely consistent with the gender ratio in the population structure of Vietnam in general and Hanoi in particular (Male/Female: 49/51).
- Age structure: 36.6% of respondents are <23 years old, equivalent to 306 people. People from 23-34 years old
accounting for the highest proportion: 44.8% equivalent to 374 people, people aged 35-45 and >45 are 70 and 85 people equivalent to 8.4% and 10.2% respectively. Looking at the results of this survey, we can see that the young people - youth account for a large proportion of the total number of people participating in the survey. Meanwhile, the middle-aged people including two age groups of 35 - 45 and >45 have a low rate of participation in the survey. This is completely consistent with the reality when Mobile Marketing is identified as a Marketing service aimed at young people (people under 35 years old).
- Structure by educational level: among 835 valid responses, 541 respondents had university degrees, accounting for the highest proportion of ~ 75%, 102 had secondary school degrees, ~ 13.1%, and 93 had post-graduate degrees, ~ 11.9%.
- Occupational structure: office workers and civil servants are the group with the highest rate of participation with 39.4%, followed by students with 36.6%. Self-employed people account for 12%, retired housewives are 7.8% and other occupational groups account for 4.2%. The survey results show that the student group has the same rate as the group aged <23 at 36.6%. This shows the accuracy of the survey data. In addition, the survey results distributed by occupational criteria have a rate almost similar to the sample division rate in chapter 3. Therefore, it can be concluded that the survey data is suitable for use in analysis activities.
- Income structure: the group with income from 3 to 5 million has the highest rate with 39% of the total number of respondents. This is consistent with the income structure of Hanoi people and corresponds to the average income of the group of civil servants and office workers. Those
People with no income account for 23%, income under 3 million VND accounts for 13% and income over 5 million VND accounts for 25%.
4.2 Mobile phone usage in Hanoi inner city area
According to the survey results, most respondents said they had used the phone for more than 1 year, specifically: 68.4% used mobile phones from 4 to 10 years, 23.2% used from 1 to 3 years, 7.8% used for more than 10 years. Those who used mobile phones for less than 1 year accounted for only a very small proportion of ~ 0.6%. (Table 4.1)
Table 4.1: Time spent using mobile phones
Frequency
Ratio (%)
Valid Percentage
Cumulative Percentage
Alid
<1 year
5
.6
.6
.6
1-3 years
194
23.2
23.2
23.8
4-10 years
571
68.4
68.4
92.2
>10 years
65
7.8
7.8
100.0
Total
835
100.0
100.0
The survey indexes on the time of using mobile phones of consumers in the inner city of Hanoi are very impressive for a developing country like Vietnam and also prove that Vietnamese consumers have a lot of experience using this high-tech device. Moreover, with the majority of consumers surveyed having a relatively long time of use (4-10 years), it partly proves that mobile phones have become an important and essential item in people's daily lives.
When asked about the mobile phone network they are using, 31% of respondents said they are using the network of Vietel company, 29% use the network of
of Mobifone company, 27% use Vinaphone company's network and 13% use networks of other providers such as E-VN telecom, S-fone, Beeline, Vietnammobile. (Figure 4.1).
Figure 4.1: Mobile phone network in use
Compared with the announced market share of mobile telecommunications service providers in Vietnam (Vietel: 36%, Mobifone: 29%, Vinaphone: 28%, the remaining networks: 7%), we see that the survey results do not have many differences. However, the statistics show that there is a difference in the market share of other networks because the Hanoi market is one of the two main markets of small networks, so their market share in this area will certainly be higher than that of the whole country.
According to a report by NielsenMobile (2009) [8], the number of prepaid mobile phone subscribers in Hanoi accounts for 95% of the total number of subscribers, however, the results of this survey show that the percentage of prepaid subscribers has decreased by more than 20%, only at 70.8%. On the contrary, the number of postpaid subscribers tends to increase from 5% in 2009 to 19.2%. Those who are simultaneously using both types of subscriptions account for 10%. (Table 4.2).
Table 4.2: Types of mobile phone subscribers
Frequency
Ratio (%)
Valid Percentage
Cumulative Percentage
Valid
Prepay
591
70.8
70.8
70.8
Pay later
160
19.2
19.2
89.9
Both of the above
84
10.1
10.1
100.0
Total
835
100.0
100.0
The above figures show the change in the psychology and consumption habits of Vietnamese consumers towards mobile telecommunications services, when the use of prepaid subscriptions and junk SIMs is replaced by the use of two types of subscriptions for different purposes and needs or switching to postpaid subscriptions to enjoy better customer care services.
In addition, the majority of respondents have an average spending level for mobile phone services from 100 to 300 thousand VND (406 ~ 48.6% of total respondents). The high spending level (> 500 thousand VND) is the spending level with the lowest number of people with only 8.4%, on the contrary, the low spending level (under 100 thousand VND) accounts for the second highest proportion among the groups of respondents with 25.4%. People with low spending levels mainly fall into the group of students and retirees/housewives - those who have little need to use or mainly use promotional SIM cards. (Table 4.3).
Table 4.3: Spending on mobile phone charges
Frequency
Ratio (%)
Valid Percentage
Cumulative Percentage
Valid
<100,000
212
25.4
25.4
25.4
100-300,000
406
48.6
48.6
74.0
300,000-500,000
147
17.6
17.6
91.6
>500,000
70
8.4
8.4
100.0
Total
835
100.0
100.0
The statistics in Table 4.3 are similar to the percentages in the NielsenMobile survey results (2009) with 73% of mobile phone users having medium spending levels and only 13% having high spending levels.
The survey results also showed that up to 31% ~ nearly one-third of respondents said they sent more than 10 SMS messages/day, meaning that on average they sent 1 SMS message for every working hour. Those with an average SMS message volume (from 3 to 10 messages/day) accounted for 51.1% and those with a low SMS message volume (less than 3 messages/day) accounted for 17%. (Table 4.4)
Table 4.4: Number of SMS messages sent per day
Frequency
Ratio (%)
Valid Percentage
Cumulative Percentage
Valid
<3 news
142
17.0
17.0
17.0
3-10 news
427
51.1
51.1
68.1
>10 news
266
31.9
31.9
100.0
Total
835
100.0
100.0
Similar to sending messages, those with an average message receiving rate (from 3-10 messages/day) accounted for the highest percentage of ~ 55%, followed by those with a high number of messages (over 10 messages/day) ~ 24% and those with a low number of messages received daily (under 3 messages/day) remained at the bottom with 21%. (Table 4.5)
Table 4.5: Number of SMS messages received per day
Frequency
Ratio (%)
Valid Percentage
Cumulative Percentage
Valid
<3 news
175
21.0
21.0
21.0
3-10 news
436
55.0
55.0
76.0
>10 news
197
24.0
24.0
100.0
Total
835
100.0
100.0
When comparing the data of the two result tables 4.4 and 4.5, we can see the reasonableness between the ratio of the number of messages sent and the number of messages received daily by the interview participants.
4.3 Current status of SMS advertising and Mobile Marketing
According to the interview results, in the 3 months from the time of the survey and before, 94% of respondents, equivalent to 785 people, said they received advertising messages, while only a very small percentage of 6% (only 50 people) did not receive advertising messages (Table 4.6).
Table 4.6: Percentage of people receiving advertising messages in the last 3 months
Frequency
Ratio (%)
Valid Percentage
Cumulative Percentage
Valid
Have
785
94.0
94.0
94.0
Are not
50
6.0
6.0
100.0
Total
835
100.0
100.0
The results of Table 4.6 show that consumers in the inner city of Hanoi are very familiar with advertising messages. This result is also the basis for assessing the knowledge, experience and understanding of the respondents in the interview. This is also one of the important factors determining the accuracy of the survey results.
In addition, most respondents said they had received promotional messages, but only 24% of them had ever taken the action of registering to receive promotional messages, while 76% of the remaining respondents did not register to receive promotional messages but still received promotional messages every day. This is the first sign indicating the weaknesses and shortcomings of lax management of this activity in Vietnam. (Table 4.7)
div.maincontent .s1 { color: black; font-family:"Times New Roman", serif; font-style: italic; font-weight: normal; text-decoration: none; font-size: 14pt; } div.maincontent .s2 { color: black; font-family:"Times New Roman", serif; font-style: normal; font-weight: bold; text-decoration: none; font-size: 14pt; } div.maincontent .s3 { color: black; font-family:"Times New Roman", serif; font-style: normal; font-weight: bold; text-decoration: none; font-size: 14pt; } div.maincontent .p { color: black; font-family:"Times New Roman", serif; font-style: normal; font-weight: normal; text-decoration: none; font-size: 14pt; margin:0pt; } div.maincontent p { color: black; font-family:"Times New Roman", serif; font-style: normal; font-weight: normal; text-decoration: none; font-size: 14pt; margin:0pt; } div.maincontent .s4 { color: black; font-family:"Times New Roman", serif; font-style: normal; font-weight: normal; text-decoration: none; font-size: 9.5pt; vertical-align: 6pt; } div.maincontent .s5 { color: black; font-family:"Times New Roman", serif; font-style: normal; font-weight: bold; text-decoration: none; font-size: 14pt; } div.maincontent .s6 { color: black; font-family:"Times New Roman", serif; font-style: normal; font-weight: bold; text-decoration: none; font-size: 14pt; } div.maincontent .s7 { color: black; font-family:"Times New Roman", serif; font-style: italic; font-weight: normal; text-decoration: none; font-size: 14pt; } div.maincontent .s8 { color: black; font-family:"Times New Roman", serif; font-style: italic; font-weight: bold; text-decoration: none; font-size: 14pt; } div.maincontent .s9 { color: black; font-family:Arial, sans-serif; font-style: normal; font-weight: normal; text-decoration: none; font-size: 14pt; } div.maincontent .s10 { color: black; font-family:Arial, sans-serif; font-style: normal; font-weight: normal; text-decoration: none; font-size: 12pt; } div.maincontent .s11 { color: black; font-family:"Times New Roman", serif; font-style: normal; font-weight: normal; font-size: 14pt; } div.maincontent .s12 { color: black; font-family:Arial, sans-serif; font-style: normal; font-weight: normal; text-decoration: none; font-size: 14pt; } div.maincontent .s13 { color: black; font-family:"Times New Roman", serif; font-style: normal; font-weight: normal; text-decoration: none; font-size: 14pt; } div.maincontent .s14 { color: black; font-family:"Times New Roman", serif; font-style: normal; font-weight: bold; text-decoration: none; font-size: 13pt; } div.maincontent .s15 { color: black; font-family:"Times New Roman", serif; font-style: italic; font-weight: normal; text-decoration: none; font-size: 9.5pt; vertical-align: 6pt; } div.maincontent .s16 { color: black; font-family:"Times New Roman", serif; font-style: normal; font-weight: normal; text-decoration: none; font-size: 5.5pt; vertical-align: 3pt; } div.maincontent .s17 { color: black; font-family:"Times New Roman", serif; font-style: normal; font-weight: normal; text-decoration: none; font-size: 8.5pt; } div.maincontent .s18 { color: black; font-family:"Times New Roman", serif; font-style: italic; font-weight: bold; font-size: 14pt; } div.maincontent .s19 { color: black; font-family:"Times New Roman", serif; font-style: normal; font-weight: bold; font-size: 14pt; } div.maincontent .s20 { color: black; font-family:"Times New Roman", serif; font-style: italic; font-weight: normal; text-decoration: none; font-size: 13pt; } div.maincontent .s21 { color: black; font-family:"Times New Roman", serif; font-style: normal; font-weight: normal; text-decoration: none; font-size: 14pt; } div.maincontent .s22 { color: black; font-family:"Courier New", monospace; font-style: normal; font-weight: normal; text-decoration: none; font-size: 14pt; } div.maincontent .s23 { color: black; font-family:"Times New Roman", serif; font-style: normal; font-weight: normal; text-decoration: none; font-size: 13pt; } div.maincontent .s24 { color: black; font-family:"Times New Roman", serif; font-style: italic; font-weight: normal; text-decoration: none; font-size: 13pt; } div.maincontent .s25 { color: black; font-family:"Times New Roman", serif; font-style: normal; font-weight: bold; text-decoration: none; font-size: 14pt; } div.maincontent .s26 { color: black; font-family:"Times New Roman", serif; font-style: normal; font-weight: normal; text-decoration: none; font-size: 14pt; } div.maincontent .s27 { color: black; font-family:"Times New Roman", serif; font-style: normal; font-weight: normal; text-decoration: none; font-size: 1.5pt; } div.maincontent .s28 { color: black; font-family:"Times New Roman", serif; font-style: normal; font-weight: normal; text-decoration: none; font-size: 11pt; } div.maincontent .s29 { color: black; font-family:"Times New Roman", serif; font-style: normal; font-weight: bold; text-decoration: none; font-size: 13pt; } div.maincontent .s30 { color: black; font-family:"Times New Roman", serif; font-style: italic; font-weight: bold; text-decoration: none; font-size: 13pt; } div.maincontent .s31 { color: black; font-family:"Times New Roman", serif; font-style: normal; font-weight: normal; text-decoration: none; font-size: 13pt; } div.maincontent .s32 { color: black; font-family:Arial, sans-serif; font-style: normal; font-weight: normal; text-decoration: none; font-size: 10.5pt; } div.maincontent .s33 { color: black; font-family:Arial, sans-serif; font-style: normal; font-weight: normal; text-decoration: none; font-size: 11pt; } div.maincontent .s35 { color: black; font-family:Arial, sans-serif; font-style: normal; font-weight: bold; text-decoration: none; font-size: 10.5pt; } div.maincontent .s36 { color: #F00; font-family:Arial, sans-serif; font-style: italic; font-weight: bold; text-decoration: none; font-size: 10.5pt; } div.maincontent .s37 { color: black; font-family:Arial, sans-serif; font-style: normal; font-weight: bold; text-decoration: none; font-size: 10.5pt; } div.maincontent .s38 { color: black; font-family:"Times New Roman", serif; font-style: normal; font-weight: bold; text-decoration: none; font-size: 8.5pt; vertical-align: 5pt; } div.maincontent .s39 { color: black; font-family:Arial, sans-serif; font-style: normal; font-weight: normal; text-decoration: none; font-size: 10.5pt; } div.maincontent .s40 { color: black; font-family:Arial, sans-serif; font-style: normal; font-weight: normal; text-decoration: none; font-size: 7pt; vertical-align: 4pt; } div.maincontent .s41 { color: black; font-family:Arial, sans-serif; font-style: normal; font-weight: bold; text-decoration: none; font-size: 10.5pt; } div.maincontent .s42 { color: black; font-family:Arial, sans-serif; font-style: normal; font-weight: bold; text-decoration: none; font-size: 11pt; } div.maincontent .s43 { color: black; font-family:Arial, sans-serif; font-style: normal; font-weight: bold; text-decoration: none; font-size: 7.5pt; vertical-align: 5pt; } div.maincontent .s44 { color: black; font-family:Arial, sans-serif; font-style: normal; font-weight: normal; text-decoration: none; font-size: 7pt; vertical-align: 5pt; } div.maincontent .s45 { color: #F00; font-family:Arial, sans-serif; font-style: normal; font-weight: bold; text-decoration: none; font-size: 10.5pt; } div.maincontent .s46 { color: black; font-family:Arial, sans-serif; font-style: normal; font-weight: bold; text-decoration: none; font-size: 7pt; vertical-align: 5pt; } div.maincontent .s47 { color: black; font-family:Arial, sans-serif; font-style: normal; font-weight: bold; text-decoration: none; font-size: 11pt; } div.maincontent .s48 { color: black; font-family:"Times New Roman", serif; font-style: normal; font-weight: normal; text-decoration: none; font-size: 14pt; } div.maincontent .s49 { color: black; font-family:"Times New Roman", serif; font-style: italic; font-weight: normal; text-decoration: none; font-size: 9.5pt; vertical-align: -2pt; } div.maincontent .s50 { color: black; font-family:"Times New Roman", serif; font-style: normal; font-weight: normal; text-decoration: none; font-size: 9.5pt; } div.maincontent .s51 { color: black; font-family:"Times New Roman", serif; font-style: italic; font-weight: normal; text-decoration: none; font-size: 9.5pt; vertical-align: -1pt; } div.maincontent .s52 { color: black; font-family:"Times New Roman", serif; font-style: normal; font-weight: normal; text-decoration: none; font-size: 9.5pt; vertical-align: -2pt; } div.maincontent .s53 { color: black; font-family:"Times New Roman", serif; font-style: normal; font-weight: normal; text-decoration: none; font-size: 13pt; } div.maincontent .s54 { color: black; font-family:"Times New Roman", serif; font-style: normal; font-weight: normal; text-decoration: none; font-size: 9.5pt; vertical-align: -1pt; } div.maincontent .s55 { color: black; font-family:Arial, sans-serif; font-style: normal; font-weight: normal; text-decoration: none; font-size: 10.5pt; } div.maincontent .s56 { color: #00F; font-family:"Times New Roman", serif; font-style: normal; font-weight: normal; font-size: 14pt; } div.maincontent .s57 { color: #00F; font-family:"Times New Roman", serif; font-style: normal; font-weight: normal; text-decoration: none; font-size: 14pt; } div.maincontent .s58 { color: #00F; font-family:"Times New Roman", serif; font-style: normal; font-weight: normal; font-size: 14pt; } div.maincontent .s59 { color: #00F; font-family:"Times New Roman", serif; font-style: normal; font-weight: normal; text-decoration: none; font-size: 13pt; } div.maincontent .s60 { color: #00F; font-family:"Times New Roman", serif; font-style: normal; font-weight: normal; font-size: 13pt; } div.maincontent .s61 { color: black; font-family:"Times New Roman", serif; font-style: normal; font-weight: bold; text-decoration: none; font-size: 14pt; } div.maincontent .s62 { color: black; font-family:"Times New Roman", serif; font-style: italic; font-weight: bold; text-decoration: none; font-size: 14pt; } div.maincontent .s63 { color: black; font-family:"Times New Roman", serif; font-style: italic; font-weight: bold; text-decoration: none; font-size: 14pt; } div.maincontent .content_head2 { color: #F00; font-family:"Times New Roman", serif; font-style: normal; font-weight: bold; text-decoration: none; font-size: 14pt; } div.maincontent .s64 { color: black; font-family:"Times New Roman", serif; font-style: italic; font-weight: bold; text-decoration: none; font-size: 13pt; } div.maincontent .s67 { color: black; font-family:Arial, sans-serif; font-style: normal; font-weight: normal; text-decoration: none; font-size: 9.5pt; } div.maincontent .s68 { color: black; font-family:"Times New Roman", serif; font-style: normal; font-weight: bold; text-decoration: none; font-size: 12pt; } div.maincontent .s69 { color: black; font-family:"Times New Roman", serif; font-style: italic; font-weight: normal; text-decoration: none; font-size: 12pt; } div.maincontent .s70 { color: black; font-family:"Times New Roman", serif; font-style: normal; font-weight: normal; tex
Mobile Phone Usage in Hanoi Inner City Area
zt2i3t4l5ee
zt2a3gsconsumer,consumption,consumer behavior,marketing,mobile marketing
zt2a3ge
zc2o3n4t5e6n7ts
- Test the relationship between demographic variables and consumer behavior for Mobile Marketing activities
The analysis method used is the Chi-square test (χ2), with statistical hypotheses H0 and H1 and significance level α = 0.05. In case the P index (p-value) or Sig. index in SPSS has a value less than or equal to the significance level α, the hypothesis H0 is rejected and vice versa. With this testing procedure, the study can evaluate the difference in behavioral trends between demographic groups.
CHAPTER 4
RESEARCH RESULTS
During two months, 1,100 survey questionnaires were distributed to mobile phone users in the inner city of Hanoi using various methods such as direct interviews, sending via email or using questionnaires designed on the Internet. At the end of the survey, after checking and eliminating erroneous questionnaires, the study collected 858 complete questionnaires, equivalent to a rate of about 78%. In addition, the research subjects of the thesis are only people who are using mobile phones, so people who do not use mobile phones are not within the scope of the thesis, therefore, the questionnaires with the option of not using mobile phones were excluded from the scope of analysis. The number of suitable survey questionnaires included in the statistical analysis was 835.
4.1 Demographic characteristics of the sample
The structure of the survey sample is divided and statistically analyzed according to criteria such as gender, age, occupation, education level and personal income. (Detailed statistical table in Appendix 6)
- Gender structure: Of the 835 completed questionnaires, 49.8% of respondents were male, equivalent to 416 people, and 50.2% were female, equivalent to 419 people. The survey results of the study are completely consistent with the gender ratio in the population structure of Vietnam in general and Hanoi in particular (Male/Female: 49/51).
- Age structure: 36.6% of respondents are <23 years old, equivalent to 306 people. People from 23-34 years old
accounting for the highest proportion: 44.8% equivalent to 374 people, people aged 35-45 and >45 are 70 and 85 people equivalent to 8.4% and 10.2% respectively. Looking at the results of this survey, we can see that the young people - youth account for a large proportion of the total number of people participating in the survey. Meanwhile, the middle-aged people including two age groups of 35 - 45 and >45 have a low rate of participation in the survey. This is completely consistent with the reality when Mobile Marketing is identified as a Marketing service aimed at young people (people under 35 years old).
- Structure by educational level: among 835 valid responses, 541 respondents had university degrees, accounting for the highest proportion of ~ 75%, 102 had secondary school degrees, ~ 13.1%, and 93 had post-graduate degrees, ~ 11.9%.
- Occupational structure: office workers and civil servants are the group with the highest rate of participation with 39.4%, followed by students with 36.6%. Self-employed people account for 12%, retired housewives are 7.8% and other occupational groups account for 4.2%. The survey results show that the student group has the same rate as the group aged <23 at 36.6%. This shows the accuracy of the survey data. In addition, the survey results distributed by occupational criteria have a rate almost similar to the sample division rate in chapter 3. Therefore, it can be concluded that the survey data is suitable for use in analysis activities.
- Income structure: the group with income from 3 to 5 million has the highest rate with 39% of the total number of respondents. This is consistent with the income structure of Hanoi people and corresponds to the average income of the group of civil servants and office workers. Those
People with no income account for 23%, income under 3 million VND accounts for 13% and income over 5 million VND accounts for 25%.
4.2 Mobile phone usage in Hanoi inner city area
According to the survey results, most respondents said they had used the phone for more than 1 year, specifically: 68.4% used mobile phones from 4 to 10 years, 23.2% used from 1 to 3 years, 7.8% used for more than 10 years. Those who used mobile phones for less than 1 year accounted for only a very small proportion of ~ 0.6%. (Table 4.1)
Table 4.1: Time spent using mobile phones
Frequency
Ratio (%)
Valid Percentage
Cumulative Percentage
Alid
<1 year
5
.6
.6
.6
1-3 years
194
23.2
23.2
23.8
4-10 years
571
68.4
68.4
92.2
>10 years
65
7.8
7.8
100.0
Total
835
100.0
100.0
The survey indexes on the time of using mobile phones of consumers in the inner city of Hanoi are very impressive for a developing country like Vietnam and also prove that Vietnamese consumers have a lot of experience using this high-tech device. Moreover, with the majority of consumers surveyed having a relatively long time of use (4-10 years), it partly proves that mobile phones have become an important and essential item in people's daily lives.
When asked about the mobile phone network they are using, 31% of respondents said they are using the network of Vietel company, 29% use the network of
of Mobifone company, 27% use Vinaphone company's network and 13% use networks of other providers such as E-VN telecom, S-fone, Beeline, Vietnammobile. (Figure 4.1).
Figure 4.1: Mobile phone network in use
Compared with the announced market share of mobile telecommunications service providers in Vietnam (Vietel: 36%, Mobifone: 29%, Vinaphone: 28%, the remaining networks: 7%), we see that the survey results do not have many differences. However, the statistics show that there is a difference in the market share of other networks because the Hanoi market is one of the two main markets of small networks, so their market share in this area will certainly be higher than that of the whole country.
According to a report by NielsenMobile (2009) [8], the number of prepaid mobile phone subscribers in Hanoi accounts for 95% of the total number of subscribers, however, the results of this survey show that the percentage of prepaid subscribers has decreased by more than 20%, only at 70.8%. On the contrary, the number of postpaid subscribers tends to increase from 5% in 2009 to 19.2%. Those who are simultaneously using both types of subscriptions account for 10%. (Table 4.2).
Table 4.2: Types of mobile phone subscribers
Frequency
Ratio (%)
Valid Percentage
Cumulative Percentage
Valid
Prepay
591
70.8
70.8
70.8
Pay later
160
19.2
19.2
89.9
Both of the above
84
10.1
10.1
100.0
Total
835
100.0
100.0
The above figures show the change in the psychology and consumption habits of Vietnamese consumers towards mobile telecommunications services, when the use of prepaid subscriptions and junk SIMs is replaced by the use of two types of subscriptions for different purposes and needs or switching to postpaid subscriptions to enjoy better customer care services.
In addition, the majority of respondents have an average spending level for mobile phone services from 100 to 300 thousand VND (406 ~ 48.6% of total respondents). The high spending level (> 500 thousand VND) is the spending level with the lowest number of people with only 8.4%, on the contrary, the low spending level (under 100 thousand VND) accounts for the second highest proportion among the groups of respondents with 25.4%. People with low spending levels mainly fall into the group of students and retirees/housewives - those who have little need to use or mainly use promotional SIM cards. (Table 4.3).
Table 4.3: Spending on mobile phone charges
Frequency
Ratio (%)
Valid Percentage
Cumulative Percentage
Valid
<100,000
212
25.4
25.4
25.4
100-300,000
406
48.6
48.6
74.0
300,000-500,000
147
17.6
17.6
91.6
>500,000
70
8.4
8.4
100.0
Total
835
100.0
100.0
The statistics in Table 4.3 are similar to the percentages in the NielsenMobile survey results (2009) with 73% of mobile phone users having medium spending levels and only 13% having high spending levels.
The survey results also showed that up to 31% ~ nearly one-third of respondents said they sent more than 10 SMS messages/day, meaning that on average they sent 1 SMS message for every working hour. Those with an average SMS message volume (from 3 to 10 messages/day) accounted for 51.1% and those with a low SMS message volume (less than 3 messages/day) accounted for 17%. (Table 4.4)
Table 4.4: Number of SMS messages sent per day
Frequency
Ratio (%)
Valid Percentage
Cumulative Percentage
Valid
<3 news
142
17.0
17.0
17.0
3-10 news
427
51.1
51.1
68.1
>10 news
266
31.9
31.9
100.0
Total
835
100.0
100.0
Similar to sending messages, those with an average message receiving rate (from 3-10 messages/day) accounted for the highest percentage of ~ 55%, followed by those with a high number of messages (over 10 messages/day) ~ 24% and those with a low number of messages received daily (under 3 messages/day) remained at the bottom with 21%. (Table 4.5)
Table 4.5: Number of SMS messages received per day
Frequency
Ratio (%)
Valid Percentage
Cumulative Percentage
Valid
<3 news
175
21.0
21.0
21.0
3-10 news
436
55.0
55.0
76.0
>10 news
197
24.0
24.0
100.0
Total
835
100.0
100.0
When comparing the data of the two result tables 4.4 and 4.5, we can see the reasonableness between the ratio of the number of messages sent and the number of messages received daily by the interview participants.
4.3 Current status of SMS advertising and Mobile Marketing
According to the interview results, in the 3 months from the time of the survey and before, 94% of respondents, equivalent to 785 people, said they received advertising messages, while only a very small percentage of 6% (only 50 people) did not receive advertising messages (Table 4.6).
Table 4.6: Percentage of people receiving advertising messages in the last 3 months
Frequency
Ratio (%)
Valid Percentage
Cumulative Percentage
Valid
Have
785
94.0
94.0
94.0
Are not
50
6.0
6.0
100.0
Total
835
100.0
100.0
The results of Table 4.6 show that consumers in the inner city of Hanoi are very familiar with advertising messages. This result is also the basis for assessing the knowledge, experience and understanding of the respondents in the interview. This is also one of the important factors determining the accuracy of the survey results.
In addition, most respondents said they had received promotional messages, but only 24% of them had ever taken the action of registering to receive promotional messages, while 76% of the remaining respondents did not register to receive promotional messages but still received promotional messages every day. This is the first sign indicating the weaknesses and shortcomings of lax management of this activity in Vietnam. (Table 4.7)
div.maincontent .s1 { color: black; font-family:"Times New Roman", serif; font-style: italic; font-weight: normal; text-decoration: none; font-size: 14pt; } div.maincontent .s2 { color: black; font-family:"Times New Roman", serif; font-style: normal; font-weight: bold; text-decoration: none; font-size: 14pt; } div.maincontent .s3 { color: black; font-family:"Times New Roman", serif; font-style: normal; font-weight: bold; text-decoration: none; font-size: 14pt; } div.maincontent .p { color: black; font-family:"Times New Roman", serif; font-style: normal; font-weight: normal; text-decoration: none; font-size: 14pt; margin:0pt; } div.maincontent p { color: black; font-family:"Times New Roman", serif; font-style: normal; font-weight: normal; text-decoration: none; font-size: 14pt; margin:0pt; } div.maincontent .s4 { color: black; font-family:"Times New Roman", serif; font-style: normal; font-weight: normal; text-decoration: none; font-size: 9.5pt; vertical-align: 6pt; } div.maincontent .s5 { color: black; font-family:"Times New Roman", serif; font-style: normal; font-weight: bold; text-decoration: none; font-size: 14pt; } div.maincontent .s6 { color: black; font-family:"Times New Roman", serif; font-style: normal; font-weight: bold; text-decoration: none; font-size: 14pt; } div.maincontent .s7 { color: black; font-family:"Times New Roman", serif; font-style: italic; font-weight: normal; text-decoration: none; font-size: 14pt; } div.maincontent .s8 { color: black; font-family:"Times New Roman", serif; font-style: italic; font-weight: bold; text-decoration: none; font-size: 14pt; } div.maincontent .s9 { color: black; font-family:Arial, sans-serif; font-style: normal; font-weight: normal; text-decoration: none; font-size: 14pt; } div.maincontent .s10 { color: black; font-family:Arial, sans-serif; font-style: normal; font-weight: normal; text-decoration: none; font-size: 12pt; } div.maincontent .s11 { color: black; font-family:"Times New Roman", serif; font-style: normal; font-weight: normal; font-size: 14pt; } div.maincontent .s12 { color: black; font-family:Arial, sans-serif; font-style: normal; font-weight: normal; text-decoration: none; font-size: 14pt; } div.maincontent .s13 { color: black; font-family:"Times New Roman", serif; font-style: normal; font-weight: normal; text-decoration: none; font-size: 14pt; } div.maincontent .s14 { color: black; font-family:"Times New Roman", serif; font-style: normal; font-weight: bold; text-decoration: none; font-size: 13pt; } div.maincontent .s15 { color: black; font-family:"Times New Roman", serif; font-style: italic; font-weight: normal; text-decoration: none; font-size: 9.5pt; vertical-align: 6pt; } div.maincontent .s16 { color: black; font-family:"Times New Roman", serif; font-style: normal; font-weight: normal; text-decoration: none; font-size: 5.5pt; vertical-align: 3pt; } div.maincontent .s17 { color: black; font-family:"Times New Roman", serif; font-style: normal; font-weight: normal; text-decoration: none; font-size: 8.5pt; } div.maincontent .s18 { color: black; font-family:"Times New Roman", serif; font-style: italic; font-weight: bold; font-size: 14pt; } div.maincontent .s19 { color: black; font-family:"Times New Roman", serif; font-style: normal; font-weight: bold; font-size: 14pt; } div.maincontent .s20 { color: black; font-family:"Times New Roman", serif; font-style: italic; font-weight: normal; text-decoration: none; font-size: 13pt; } div.maincontent .s21 { color: black; font-family:"Times New Roman", serif; font-style: normal; font-weight: normal; text-decoration: none; font-size: 14pt; } div.maincontent .s22 { color: black; font-family:"Courier New", monospace; font-style: normal; font-weight: normal; text-decoration: none; font-size: 14pt; } div.maincontent .s23 { color: black; font-family:"Times New Roman", serif; font-style: normal; font-weight: normal; text-decoration: none; font-size: 13pt; } div.maincontent .s24 { color: black; font-family:"Times New Roman", serif; font-style: italic; font-weight: normal; text-decoration: none; font-size: 13pt; } div.maincontent .s25 { color: black; font-family:"Times New Roman", serif; font-style: normal; font-weight: bold; text-decoration: none; font-size: 14pt; } div.maincontent .s26 { color: black; font-family:"Times New Roman", serif; font-style: normal; font-weight: normal; text-decoration: none; font-size: 14pt; } div.maincontent .s27 { color: black; font-family:"Times New Roman", serif; font-style: normal; font-weight: normal; text-decoration: none; font-size: 1.5pt; } div.maincontent .s28 { color: black; font-family:"Times New Roman", serif; font-style: normal; font-weight: normal; text-decoration: none; font-size: 11pt; } div.maincontent .s29 { color: black; font-family:"Times New Roman", serif; font-style: normal; font-weight: bold; text-decoration: none; font-size: 13pt; } div.maincontent .s30 { color: black; font-family:"Times New Roman", serif; font-style: italic; font-weight: bold; text-decoration: none; font-size: 13pt; } div.maincontent .s31 { color: black; font-family:"Times New Roman", serif; font-style: normal; font-weight: normal; text-decoration: none; font-size: 13pt; } div.maincontent .s32 { color: black; font-family:Arial, sans-serif; font-style: normal; font-weight: normal; text-decoration: none; font-size: 10.5pt; } div.maincontent .s33 { color: black; font-family:Arial, sans-serif; font-style: normal; font-weight: normal; text-decoration: none; font-size: 11pt; } div.maincontent .s35 { color: black; font-family:Arial, sans-serif; font-style: normal; font-weight: bold; text-decoration: none; font-size: 10.5pt; } div.maincontent .s36 { color: #F00; font-family:Arial, sans-serif; font-style: italic; font-weight: bold; text-decoration: none; font-size: 10.5pt; } div.maincontent .s37 { color: black; font-family:Arial, sans-serif; font-style: normal; font-weight: bold; text-decoration: none; font-size: 10.5pt; } div.maincontent .s38 { color: black; font-family:"Times New Roman", serif; font-style: normal; font-weight: bold; text-decoration: none; font-size: 8.5pt; vertical-align: 5pt; } div.maincontent .s39 { color: black; font-family:Arial, sans-serif; font-style: normal; font-weight: normal; text-decoration: none; font-size: 10.5pt; } div.maincontent .s40 { color: black; font-family:Arial, sans-serif; font-style: normal; font-weight: normal; text-decoration: none; font-size: 7pt; vertical-align: 4pt; } div.maincontent .s41 { color: black; font-family:Arial, sans-serif; font-style: normal; font-weight: bold; text-decoration: none; font-size: 10.5pt; } div.maincontent .s42 { color: black; font-family:Arial, sans-serif; font-style: normal; font-weight: bold; text-decoration: none; font-size: 11pt; } div.maincontent .s43 { color: black; font-family:Arial, sans-serif; font-style: normal; font-weight: bold; text-decoration: none; font-size: 7.5pt; vertical-align: 5pt; } div.maincontent .s44 { color: black; font-family:Arial, sans-serif; font-style: normal; font-weight: normal; text-decoration: none; font-size: 7pt; vertical-align: 5pt; } div.maincontent .s45 { color: #F00; font-family:Arial, sans-serif; font-style: normal; font-weight: bold; text-decoration: none; font-size: 10.5pt; } div.maincontent .s46 { color: black; font-family:Arial, sans-serif; font-style: normal; font-weight: bold; text-decoration: none; font-size: 7pt; vertical-align: 5pt; } div.maincontent .s47 { color: black; font-family:Arial, sans-serif; font-style: normal; font-weight: bold; text-decoration: none; font-size: 11pt; } div.maincontent .s48 { color: black; font-family:"Times New Roman", serif; font-style: normal; font-weight: normal; text-decoration: none; font-size: 14pt; } div.maincontent .s49 { color: black; font-family:"Times New Roman", serif; font-style: italic; font-weight: normal; text-decoration: none; font-size: 9.5pt; vertical-align: -2pt; } div.maincontent .s50 { color: black; font-family:"Times New Roman", serif; font-style: normal; font-weight: normal; text-decoration: none; font-size: 9.5pt; } div.maincontent .s51 { color: black; font-family:"Times New Roman", serif; font-style: italic; font-weight: normal; text-decoration: none; font-size: 9.5pt; vertical-align: -1pt; } div.maincontent .s52 { color: black; font-family:"Times New Roman", serif; font-style: normal; font-weight: normal; text-decoration: none; font-size: 9.5pt; vertical-align: -2pt; } div.maincontent .s53 { color: black; font-family:"Times New Roman", serif; font-style: normal; font-weight: normal; text-decoration: none; font-size: 13pt; } div.maincontent .s54 { color: black; font-family:"Times New Roman", serif; font-style: normal; font-weight: normal; text-decoration: none; font-size: 9.5pt; vertical-align: -1pt; } div.maincontent .s55 { color: black; font-family:Arial, sans-serif; font-style: normal; font-weight: normal; text-decoration: none; font-size: 10.5pt; } div.maincontent .s56 { color: #00F; font-family:"Times New Roman", serif; font-style: normal; font-weight: normal; font-size: 14pt; } div.maincontent .s57 { color: #00F; font-family:"Times New Roman", serif; font-style: normal; font-weight: normal; text-decoration: none; font-size: 14pt; } div.maincontent .s58 { color: #00F; font-family:"Times New Roman", serif; font-style: normal; font-weight: normal; font-size: 14pt; } div.maincontent .s59 { color: #00F; font-family:"Times New Roman", serif; font-style: normal; font-weight: normal; text-decoration: none; font-size: 13pt; } div.maincontent .s60 { color: #00F; font-family:"Times New Roman", serif; font-style: normal; font-weight: normal; font-size: 13pt; } div.maincontent .s61 { color: black; font-family:"Times New Roman", serif; font-style: normal; font-weight: bold; text-decoration: none; font-size: 14pt; } div.maincontent .s62 { color: black; font-family:"Times New Roman", serif; font-style: italic; font-weight: bold; text-decoration: none; font-size: 14pt; } div.maincontent .s63 { color: black; font-family:"Times New Roman", serif; font-style: italic; font-weight: bold; text-decoration: none; font-size: 14pt; } div.maincontent .content_head2 { color: #F00; font-family:"Times New Roman", serif; font-style: normal; font-weight: bold; text-decoration: none; font-size: 14pt; } div.maincontent .s64 { color: black; font-family:"Times New Roman", serif; font-style: italic; font-weight: bold; text-decoration: none; font-size: 13pt; } div.maincontent .s67 { color: black; font-family:Arial, sans-serif; font-style: normal; font-weight: normal; text-decoration: none; font-size: 9.5pt; } div.maincontent .s68 { color: black; font-family:"Times New Roman", serif; font-style: normal; font-weight: bold; text-decoration: none; font-size: 12pt; } div.maincontent .s69 { color: black; font-family:"Times New Roman", serif; font-style: italic; font-weight: normal; text-decoration: none; font-size: 12pt; } div.maincontent .s70 { color: black; font-family:"Times New Roman", serif; font-style: normal; font-weight: normal; tex -
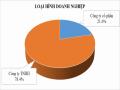 Characteristics of Survey Sample by Business Type
 -
 Number and Composition of the Sample of Opinion Survey of High Schools in the Southeast Region
 -
 Survey on the Quality of Local Characteristics
 -
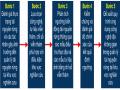 Research on the Current Characteristics of Forest Resources and Factors Affecting Forest Resources Management in the National Park Area
3.2 Current status of domestic violence against women in 3 survey locations
The status of domestic violence was assessed through information provided by men participating in the survey. The study asked questions to assess the status of violent behavior of respondents towards their wives in the past 12 months by listing the behaviors and men could choose multiple options. The study measured each violent behavior, in which each violent behavior could belong to several different types of violence. Therefore, the total rate of the 4 violence groups did not equal 100%. Analyzing the answers chosen by men, the results showed that the status of male violence occurred in all 4 violence groups with a variety of different behaviors, in which mental violence was the most common form of violence used by men, followed by economic violence, physical violence and the least was sexual violence through observing chart 3.1 below.
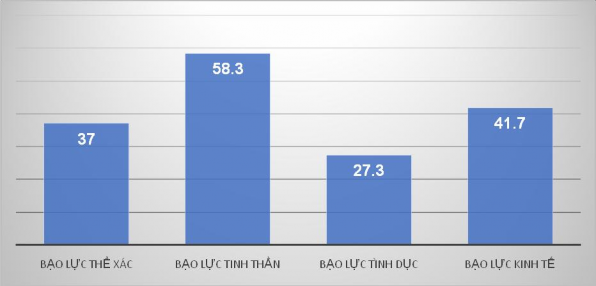
Figure 3.1: Rate of men's violent behavior towards their wives in the past 12 months (%) (N=300)
Note: The study measured individual acts of violence, where each act of violence may belong to several different types of violence. Therefore, the total proportion of the four violence groups does not equal 100%.
The study analyzed the relationship between the level of violence between men and their wives and the socio-demographic characteristics of individuals and families. The results presented in Table 3.2 are explained as follows: Cells with * indicate a strong correlation between the socio-demographic characteristics of individuals and families.
with violent behavior of male respondents. The level of statistical significance is closer to the increasing level of *. The blank cells show that there is no strong correlation between the variables at the statistical significance level of 0.05.
The results showed that income, area of residence and education level were closely related to the rate of violence against wives. Men with low income, representing a low standard of living in the family, had a significantly higher rate of violence against wives than the higher income group in all forms of violence against wives. In addition, men living in the mountainous district of Hai Ha had a much higher rate of violence than men living in the island district of Van Don. It is noteworthy that the rate of men committing violence against wives in Ha Long city was significantly higher than in Van Don island district and not much different from Hai Ha district. Men's education level determined the type of violence used against wives. Men with a high school education level or higher had significantly higher rates of emotional violence against wives than husbands with lower education, while men with lower education levels were more likely to use physical violence.
Table 3.2: Distribution of the proportion of types of domestic violence according to male characteristics (%)
(N=300)
Form of violence
Sexual violence god | Physical violence | Sexual violence | Economic violence | ||
Male age | * | ||||
Under 40 years old | 62.8 | 21.9 | 29.5 | 43.7 | |
Over 40 years old | 51.3 | 24.8 | 23.9 | 38.5 | |
Living area | *** | *** | *** | ||
Van Don | 34 .0 | 19.0 | 12.0 | 24.0 | |
Hai Ha | 71.4 | 27.5 | 38.5 | 47.3 | |
Ha Long | 69.7 | 22.9 | 32.1 | 53.2 | |
Education level | * | *** | |||
College or higher | 68.4 | 8.0 | 22.9 | 38.1 | |
High School | 62.5 | 25.7 | 29.2 | 40.3 | |
Secondary school or higher down | 50 | 81.6 | 34.2 | 57.9 | |
Average income /month of husband | *** | *** | *** | *** | |
Under 5 million | 64.8 | 31.6 | 36.7 | 52.6 | |
Over 5 million | 35.2 | 6.7 | 9.6 | 21.2 |
Statistical significance level: * p <0.05; ** p<0.01; ***p<0.001
Below are detailed analyses for each group of violent behaviors:
3.2.1 Mental violence
According to the survey results, the most violent behavior that men use is mental violence, with 58.3% of people committing this behavior. The results of in-depth interviews with officials, leaders, social workers and related responsible officials all assessed that mental violence is the most common and most common of the 4 groups of violence in all 3 surveyed localities in particular and Quang Ninh province in general. Explaining this, Ms. LT.HT - Head of Gender Equality Department, Department of Labor, Invalids and Social Affairs of Quang Ninh province said: ― As the economy develops and society becomes more civilized, people will also become more civilized. Therefore, the occurrence of physical violence will decrease while mental violence will increase, affecting the psychological and emotional aspects inside people more. Currently, mental violence is increasing and becoming more prominent in the spiritual life of families. Due to the pressure of secondary relationships in the family, children's illness at school, or stress at work directly affects the psychology of husband and wife in the family, so sometimes small things become big and hurt each other, so the current situation of women in the family suffering from depression is very high. As you can see, the online world develops Facebook, Zalo are tools for wives and husbands to relieve their anger with status lines, pictures, videos.."
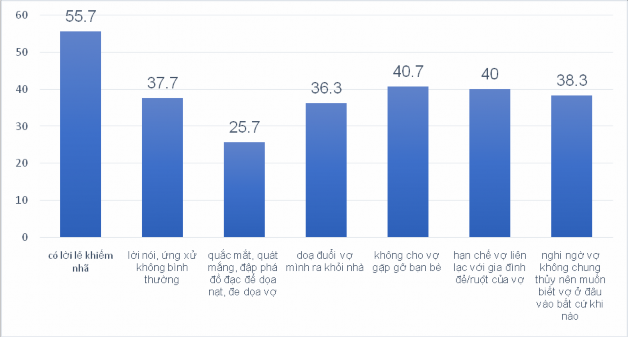
Figure 3.2: Rate of men's acts of mental violence against their wives in the past 12 months (%) (N=300)