Screening sample n = 42,551
Screening (M-CHAT) n = 40,243
Positive n = 514
Negative n = 39,729
Invite (100%) 514 positive children
Missing form 19
Invite 1028 negative children
Missing form 241
495 children diagnosed
Diagnosed 787 children
302 RLPTK
193 No
RLPTK
03 RLPTK
784 no
RLPTK
Diagnostic Examination (DMS-IV)
Figure 3. 1. Screening and diagnosis process for RLPTK
3.2.1. Results of screening for autism spectrum disorder in children 18-30 months old using the M-CHAT checklist
Table 3.6: Some information about screening activities using the M-CHAT checklist
Characteristic
Number of children (n) | Rate (%) | ||
People perform | Medical staff | 25,580 | 63.6 |
Village Health/DS Collaborator | 14,663 | 36.4 | |
Qualification of the performer | Doctor | 3,294 | 8.2 |
Nursing | 6,024 | 15.0 | |
Midwife | 6,074 | 15.1 | |
Doctor | 11,261 | 28.0 | |
First aid | 13,590 | 33.8 | |
Respondent | Parents | 33,347 | 82.8 |
Grandparents | 6.234 | 15.5 | |
Other (aunt, uncle, housekeeper) | 662 | 1.7 |
Maybe you are interested!
-
 Epidemiology of autism spectrum disorder in children aged 18 - 30 months and barriers to accessing autism spectrum disorder diagnosis and intervention services in Vietnam, 2017 - 2019 - 2
 -
 HIV infection status and care and ARV treatment for children under 18 months of age born to infected mothers in Vietnam, 2010-2013 - 19
 -
 Mono- and Poly-Infection of Worms in Children 12-23 Months
 -
 Results of Intervention to Prevent Mother-to-Child Transmission of HBV Using Health Education for Mothers and Children at Hai Phong Obstetrics and Gynecology Hospital
 -
 Age of Workers with Children From 36 to 72 Months Old
The majority of people who screened children using M-CHAT were health station staff (63.6%), the rest were village health workers or population collaborators who screened (36.4%). The professional qualifications of those who screened children included 33.8% primary health care workers, 28% medical doctors, 15% midwives, 15% nurses/medical staff and 8% doctors. The majority of interviewees were fathers or mothers of children, accounting for nearly 83%.
Table 3.7: Screening results using M-CHAT checklist
M-CHAT Score
Number of children (n) | Rate (%) | |
Positive | 514 | 1.3 |
Negative | 39,729 | 98.7 |
Total | 40,243 | 100.0 |
The study successfully screened children for the risk of ASD using M-CHAT.
40,243 children. Results showed that 1.3% of children tested positive for M-CHAT.
3.2.2. Diagnostic results of RLPTK in children 18-30 months old using DSM-IV
Table 3.8: Autism diagnosis results using DSM-IV
Autism
Number of children (n) | Rate (%) | |
Autism | 305 | 0.76 |
Not Autistic | 39,938 | 99.24 |
Total | 40,243 | 100.00 |
The prevalence of RLPTK in children aged 18-30 months in 7 provinces/cities through screening with M-CHAT and diagnosis with DSM-IV is 0.75%.
Table 3.9: Analysis of abnormal signs of children with autism spectrum disorder through M-CHAT
Sentence
Child signs: | Children with autism spectrum disorder (n=305) | ||
Number of children (n) | Rate (%) | ||
1 | Don't like to swing or bounce on laps | 70 | 23.0 |
2 | Not interested in other children | 203 | 66.6 |
3 | Does not like climbing on objects | 62 | 20.3 |
4 | Don't like to play peek-a-boo/hide-and-seek | 111 | 36.4 |
5 | Can't play pretend | 202 | 66.2 |
6 | Do not use your index finger to point or ask for objects. | 188 | 61.6 |
7 | Do not use your index finger to point at objects of interest. | 213 | 69.8 |
8
Not playing properly with toys | 173 | 56.7 | |
9 | Don't know how to show off things | 203 | 66.6 |
10 | Don't look into your eyes for more than 1 – 2 seconds | 178 | 58.4 |
11 | Overly sensitive to noise | 95 | 31.1 |
12 | Don't smile when you see relatives | 62 | 20.3 |
13 | Do not imitate facial expressions/actions | 181 | 59.3 |
14 | No response when called by name | 218 | 71.5 |
15 | Don't look at the object you are pointing at. | 164 | 53.8 |
16 | Not walking normally | 64 | 21.0 |
17 | Don't follow the object you are looking at. | 121 | 39.7 |
18 | Bring your hands close to your face and make strange movements. | 67 | 22.0 |
19 | Don't draw attention to your activities | 132 | 43.3 |
20 | Suspected deafness | 34 | 11.1 |
21 | Don't understand what people say | 171 | 56.1 |
22 | Staring blankly/walking absentmindedly | 75 | 24.6 |
23 | Don't look to gauge your reaction | 127 | 41.6 |
Abnormal signs in children with ASD account for a high percentage of some signs such as Children not caring about other children (66.6%); Children not knowing how to pretend play (66.2%); Children not using their index finger to point at objects of interest (69.8%); Children not knowing how to show off objects (66.6%); Children not looking into the eyes of the person opposite for more than 1-2 seconds (children not making eye contact) (58.4%); Children not imitating your facial expressions/actions (59.3%); Children not responding when called by name (71.5%).
3.2.3. Evaluation of sensitivity and specificity of the M-CHAT checklist
Calculating sensitivity and specificity on only the number of M-CHAT negative and positive tests that tested for DSM-IV diagnosis
In total, we performed DSM-IV diagnostic examinations of 1282 children, of whom 495 were positive and 787 were negative for M-CHAT and completed the diagnostic examination.
Table 3.10. Evaluation of the validity of the M-CHAT Checklist for detecting RLTK
(based on DSM-IV diagnosed 1282 children only )
RLTK | No RLTK | Total | |
M-CHAT (+) | 302 | 193 | 495 |
M-CHAT (-) | 3 | 784 | 787 |
Total | 305 | 977 | 1282 |
From the table above, we can calculate:
- Sensitivity (Sn): 302/305=99%
- Specificity (Sp): 784/977= 80.2%
- Positive predictive value (PPV): 302/495 = 61%
- Negative predictive value (NPV)= 784/787 =99.6%
Table 3.11. Comparison of screening and diagnosis results of RLTK
Diagnostic examination using DSM-IV
RLTK | No RLTK | Total number | ||||
n | % | n | % | |||
Diagnostic group guess | M-CHAT23 (+) (n1) | 302 | 61.00 | 193 | 39.00 | 495 |
M-CHAT23 (-) (n2) | 3 | 0.38 | 784 | 99.62 | 787 | |
Total number of children (n examined = 1282) | 305 | 977 | 1282 | |||
True positive rate of M-CHAT Checklist with RLTK = 302/495=61% False negative rate of M-CHAT Checklist with RLTK = 3/787= 0.38%
Thus, we estimate the number of children with RLTK out of the total number of M-CHAT-negative cases who have not been diagnosed with DSM-IV is:
0.38% * (39729 -787) = 0.38%*38942= 148 children.
Thus, if we examine all the M-CHAT negative cases, we will have 148 more RLTK children. So the total estimated RLTK children in the entire M-CHAT negative sample is 148 +3 =151 children.
Sensitivity and specificity correction on the entire M-CHAT screened sample only Table 3. 12. Evaluation of the validity of the M-CHAT Checklist based on the estimated number
examined all 40,243 children
RLTK | No RLTK | Total | |
M-CHAT (+) | 302 | 193 | 495 |
M-CHAT (-) | 3+148= 151 | 39,697 | 39,748 |
Total | 453 | 39,890 | 40,243 |
- Sensitivity (Sn): 302/453=67%
- Specificity (Sp): 39,697/39,890= 99.5%
- Positive predictive value (PPV): 302/495 = 61%
- Negative predictive value (NPV)= 39697/39748 =99.8%
3.3. Analysis of some related factors (individual, family, pre-, intra- and post-natal factors) with RLPTK in children 18-30 months old
In the analysis of some factors related to autism spectrum disorder in children, we analyzed the status of children diagnosed with autism spectrum disorder (305 children) and without autism spectrum disorder (39,938 children).
3.3.1. The relationship between some personal and family characteristics and autism spectrum disorder in children 18-30 months old
Table 3.13. Univariate regression analysis of the association between some personal factors and RLPTK in children
Element
RLPTK | OR | 95% confidence interval | |||
Quantity (n) | Rate (%) | Bottom border | Upper bound | ||
Province/city | |||||
Hanoi | 46 | 0.84 | 1.18 | 0.77 | 1.79 |
Peace | 41 | 0.70 | 0.98 | 0.64 | 1.51 |
Peace | 43 | 0.73 | 1.03 | 0.67 | 1.57 |
Quang Nam | 45 | 0.81 | 1.14 | 0.75 | 1.74 |
Dong Thap | 38 | 0.68 | 0.95 | 0.61 | 1.48 |
Element
RLPTK | OR | 95% confidence interval | |||
Quantity (n) | Rate (%) | Bottom border | Upper bound | ||
Dong Nai | 50 | 0.84 | 1.19 | 0.79 | 1.79 |
Dak Lak | 42 | 0.71 | 1 | ||
Youth group | |||||
18-23 months | 119 | 0.69 | 0.86 | 0.68 | 1.08 |
24-30 months | 186 | 0.81 | 1 | ||
Young gender | |||||
Male | 245 | 1.15 | 3.65 *** | 2.75 | 4.84 |
Female | 60 | 0.32 | 1 | ||
Living area | |||||
Urban | 142 | 1.42 | 2.67 *** | 2.13 | 3.34 |
Countryside | 163 | 0.54 | 1 | ||
Child order | |||||
The first | 140 | 0.82 | 1.20 | 0.84 | 1.71 |
Monday | 126 | 0.72 | 1.06 | 0.74 | 1.52 |
Third and above | 39 | 0.68 | 1 | ||
Note: (***) = p<0.001
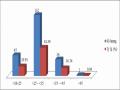
The rate of RLPTK in children aged 18-30 months in 7 provinces/cities ranged from 0.68% to 0.84%. The highest rate of RLPTK in children was in Hanoi (0.84%) and Dong Nai (0.84%), the lowest was in Thai Binh (0.70%) and Dong Thap (0.68%). No statistically significant relationship was found between the risk of RLPTK in children by province/city, by age group of children and by child order.
Boys have a 3.65 times higher rate of ASD than girls (95% CI: 2.75 - 4.48); children living in urban areas have a 2.67 times higher risk of ASD than children living in rural areas (95% CI: 2.13 - 3.34).
Table 3.14. Univariate regression analysis of the association between some family factors and RLPTK in children
Element
RLPTK | OR | 95% confidence interval | |||
Quantity (n) | Rate (%) | Bottom border | Upper bound | ||
Mother's age at birth | |||||
Under 20 years old | 17 | 0.63 | 0.90 | 0.54 | 1.48 |
20-29 years old | 178 | 0.70 | 1 | ||
30-34 years old | 60 | 0.72 | 1.02 | 0.76 | 1.37 |
35 years and older | 50 | 1.36 | 1.94*** | 1.42 | 2.67 |
Father's age at birth | |||||
Under 20 years old | 4 | 0.60 | 0.84 | 0.31 | 2.26 |
20-34 years old | 222 | 0.72 | 1 | ||
35-45 years old | 69 | 0.93 | 1.29 | 0.99 | 1.70 |
46 years and older | 10 | 1.87 | 2.64 ** | 1.39 | 5.00 |
Mother's education | |||||
Primary/ Secondary | 99 | 0.70 | 1 | ||
High School | 103 | 0.73 | 1.05 | 0.79 | 1.38 |
Secondary/ College | 58 | 0.90 | 1.30 | 0.94 | 1.80 |
Undergraduate/Graduate | 44 | 0.81 | 1.17 | 0.82 | 1.67 |
Father's education | |||||
Primary/ Secondary | 102 | 0.71 | 1 | ||
High School | 111 | 0.77 | 1.09 | 0.83 | 1.42 |
Secondary/ College | 52 | 0.97 | 1.37 | 0.98 | 1.91 |
Undergraduate/Graduate | 35 | 0.65 | 0.92 | 0.63 | 1.35 |
Mother's occupation | |||||
Farming | 64 | 0.74 | 1 | ||
State employee | 36 | 0.68 | 0.91 | 0.60 | 1.37 |
Private employee | 74 | 0.72 | 0.97 | 0.70 | 1.36 |
Free | 84 | 0.74 | 1 | 0.72 | 1.39 |
Other | 47 | 0.98 | 1.33 | 0.91 | 1.94 |
Father's occupation | |||||
Farming | 72 | 0.77 | 1 | ||
State employee | 25 | 0.52 | 0.68 | 0.43 | 1.07 |
Private employee | 62 | 0.72 | 0.94 | 0.67 | 1.32 |
Free | 142 | 0.88 | 1.15 | 0.87 | 1.53 |
Other | 4 | 0.64 | 0.83 | 0.30 | 2.28 |
Family history of RLTK/RLTT/KTBS | |||||
Have | 53 | 2.20 | 3.37 *** | 2.50 | 4.50 |
Are not | 252 | 0.70 | 1 | ||
Note: (**) = p<0.01; (***) = p<0.001
The rate of RLPTK in children is highest in the group of mothers who give birth at the age of 35 years or older or fathers who give birth at the age of 46 years or older and this difference is statistically significant. Children born to mothers aged 35 years or older have a 1.94 times higher risk of RLPTK than children born to mothers aged 20-29 years (95% CI: 1.42 - 2.67). Children have a 2.64 times higher risk of RLPTK when the age of the father is 46 years or older compared to the group of fathers aged 20-34 years (95% CI: 1.39 - 5.00).
There was no statistically significant relationship between RLPTK in children according to the educational level of the mother, father, and the occupation of the mother and father.
The rate of RLPTK in children with a family history of relatives (including paternal/maternal grandparents; parents, aunts, uncles, siblings) with neurological disorders or mental disorders or congenital disabilities is 3.4 times higher than in the group of children without relatives with the above disorders or disabilities (95% CI: 2.5 - 4.5).
3.3.2. The relationship between some prenatal factors and autism spectrum disorder in children 18-30 months old
Table 3.15. Univariate regression analysis of the association between some prenatal factors and children's RLPTK
Prenatal factors
RLPTK | OR | 95% confidence interval | |||
Quantity (n) | Proportion (%) | Near below | Near above | ||
Maternal history of miscarriage/stillbirth/abortion | |||||
Have | 118 | 3.20 | 6.48 *** | 5.13 | 8.18 |
Are not | 187 | 0.50 | 1 | ||
Conception support | |||||
Reproductive support | 12 | 5.77 | 8.28 *** | 4.57 | 14.99 |
Natural Pregnancy | 293 | 0.73 | 1 | ||
Flu or other viral infections during pregnancy | |||||
Have | 45 | 2.50 | 3.68 *** | 2.67 | 5.07 |
Are not | 260 | 0.69 | 1 | ||
Frequent exposure to chemicals during pregnancy | |||||
Have | 9 | 3.52 | 4.87 *** | 2.48 | 9.56 |
Are not | 296 | 0.74 | 1 | ||