CHAPTER 4
APPLYING ACCOUNTING AND MARKET APPROACHES TO FORECASTING CORPORATE DEBT
4.1. Performance of listed companies on HOSE in the period 2014-2016
4.1.1. Overview of listed companies on the Vietnamese stock market
Starting with the establishment of the State Securities Commission of Vietnam on November 28, 1996 under Decree No. 75/CP of the Government, 2 years later, the Vietnamese stock market was officially born when Decree No. 48/CP of the Government was signed on July 11, 1998 and established the Securities Trading Center and will be based in Ho Chi Minh City and Hanoi. Less than 2 years later, on July 28, 2000, the Ho Chi Minh City Securities Trading Center (HSTC) officially came into operation, conducting the first trading session with 2 stock codes REE and SAM. Not long after that, the Hanoi Securities Trading Center (HSTC) was also officially launched on March 8, 2005. If Ho Chi Minh City Stock Exchange is the place where large companies list their securities, Hanoi Stock Exchange is the place where small and medium-sized enterprises list their securities.
Over the past 20 years, the Vietnamese stock market has experienced many fluctuations, but has also been growing stronger and stronger, through many different stages. The period from 2000-2005 marked the beginning of the stock market, also known as the baby-walking stage. During this period, market capitalization only reached about 1% of GDP, with almost no changes. However, through the period starting in 2006, when the Securities Law was promulgated by the National Assembly and officially took effect from the beginning of 2007, it gradually improved the shortcomings and conflicts with other legal documents, helping the Vietnamese stock market to be more able to integrate with international and regional capital markets. The Vietnamese stock market has become safer and more transparent, increasing the management and supervision capacity of state management agencies.
In terms of market size, 2006 marked a strong leap when it reached 22.7% of GDP, a figure that even continued to increase sharply to over 43% in 2007. Due to the influence of the financial market and the domestic and world economy, in 2008
with a sharp decrease in market capitalization, down to 18% of GDP. By 2009, the market began to recover slightly with a market capitalization of 37.71% of GDP. Accompanying this recovery was a significant increase in listed companies on the market. By the end of 2017, the market capitalization had reached 75% of GDP and there were nearly 700 listed companies, demonstrating the boom of the stock market in the current period.
Since being heavily affected by the domestic and world economic situation in 2008, Vietnam's stock market has recovered and developed strongly. Through monitoring the financial situation of enterprises since 2010, the financial situation of listed enterprises is divided into three stages.
* The stock market from 2010-2011 was the time when businesses were heavily affected by the global financial crisis. Compared to 2010, the number of businesses with declining profits accounted for 2/3 of the total number of businesses; of which half of the businesses had both declining revenue and profits.
* In the period 2012-2015 , the size of assets, capital and revenue of the whole market increased at the same rate, while profits increased almost double these indicators. Specifically, compared to 2012, the total assets of 628 enterprises increased by 18.9%, to 1,100,273 billion VND; equity increased by 25%, to 447,046 billion VND, profits increased by 44%. Compared to 2013, profits of listed enterprises also increased by 17.9%. Therefore, ROA and ROE of enterprises have had positive changes. After a long period of decline, especially the sharp decline in 2013, in 2014 the ROA and ROE indicators of the market showed signs of growth. For fiscal year 2015, in terms of quantity, the financial indicators of listed enterprises increased, but the quality decreased compared to the previous year. The increase in assets through equity growth caused the average ROE to improve slightly compared to the bottom level in 2013 but still lower than the previous period.
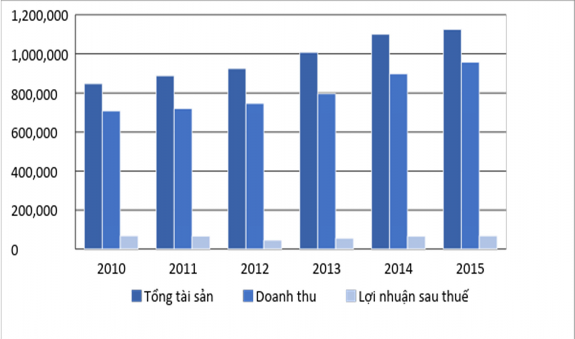
Figure 4.1. Some financial indicators and growth rates of listed enterprises 2010 - 2015
Source: VietstockFinance
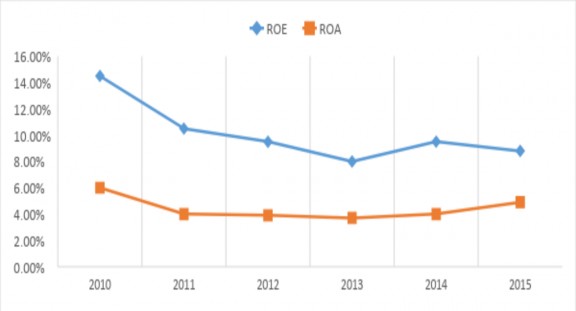
Figure 4.2. ROA, ROE of listed enterprises from 2010-2015
Source: Stoxplus and calculations of UBGSTCQG
Operating results of listed enterprises by industry group : Among the listed enterprises with profitable business results in 2014, the largest proportion is the industrial sector, of which the largest is Lam Thao Super Phosphate and Chemical Joint Stock Company (LAS), accounting for 12.7% of the group's total profit value. In 2015, the industrial sector is still considered to have the highest growth rate, 3 times higher than the growth rate of the entire market.
Industries with good improvement in ROA and ROE include: construction, transportation - warehousing, agriculture.
– forestry and fishery. For the two construction and real estate sectors, although ROA and ROE are still low. In addition, in the industrial sector, the manufacturing and processing sub-sector is also an industry with many improvements when the profit margin on revenue and equity in 2014 and 2015 both increased. However, hydropower enterprises have suffered a serious decrease in profits (25%) due to drought last year.
Performance of listed companies by listing location: In terms of scale, companies listed on HOSE are larger. However, in the period 2014-2015, HNX recorded many companies with more positive business results.
In 2014, the total number of listed enterprises on HNX with profitable business results was 317 enterprises, an increase of 3.9% compared to 2013 with a total profit value of about 13,020 billion VND, an increase of 18.4% compared to 2013. In addition, the total number of listed enterprises with losses was only 32 enterprises with a loss value of about 643 billion VND, a decrease of 81.4% compared to the loss value in 2013. Also according to data from HNX, positive business results were also reflected in the total profit after tax of the listed enterprises, when the profit after tax in 2014 reached 12,376 billion VND, a sharp increase (64%) compared to 2013.
Meanwhile, the operating results of enterprises on HOSE tend to decrease. The cumulative net revenue growth in 2014 compared to the same period in 2013 of enterprises listed on HOSE was 15.19%. The growth in after-tax profit in 2014 compared to the same period in 2013 decreased by 1.66%. Correspondingly, the ROA growth compared to the same period in 2013 of enterprises listed on HOSE decreased by 9.73% and the ROE growth compared to the same period in 2013 decreased by 8.46%.
In 2015, financial information of enterprises on HOSE and HNX has changed in a new direction. Synthesizing information from HNX, the financial statements of the fourth quarter of 2015 that have been published by listed enterprises show that the number of enterprises with profitable business results in the fourth quarter of 2015 accounts for 86.7%. This number is higher than the previous year.
2014, however, in terms of quality, the profit value decreased by 27.7% compared to the fourth quarter of 2014. Meanwhile, according to data from HOSE, the growth in after-tax profit compared to the same period in 2014 was 8.6%; the growth in net revenue compared to the same period in 2014, accumulated in 2015 was 4.61%. However, the growth in ROA and ROE both decreased.
As of 2015, there were approximately 700 listed companies (including financial and non-financial companies) on the Hanoi Stock Exchange (HNX) and the Ho Chi Minh City Stock Exchange (HOSE). This number changes every year, due to new listed companies and companies canceling or withdrawing their listings. The fluctuation in the number of listed non-financial companies is shown in Table 4.1.
Table 4.1: Number of listed enterprises in some key industries on HNX and HOSE 1
Year
Branch | ||||||||||
Agriculture, Fisheries, Forestry | Industrial | Build | Real estate | Warehouse transportation | ||||||
HNX | HOSE | HNX | HOSE | HNX | HOSE | HNX | HOSE | HNX | HOSE | |
2013 | 1 | 7 | 119 | 98 | 87 | 32 | 21 | 38 | 20 | 25 |
2014 | 0 | 7 | 119 | 91 | 72 | 31 | 17 | 37 | 19 | 25 |
2015 | 0 | 7 | 109 | 87 | 68 | 31 | 13 | 31 | 16 | 22 |
Maybe you are interested!
-
 The impact of internal control on business performance of non-institutional enterprises listed on the Vietnamese stock market - 18
 -
 The impact of internal control on business performance of non-institutional enterprises listed on the Vietnamese stock market - 9
 -
 The impact of financial market development on the capital structure of listed enterprises in the ASEAN Economic Community - 28
 -
 The impact of financial market development on the capital structure of listed enterprises in the ASEAN Economic Community - 2
 -
 The impact of capital structure on business performance of joint stock companies listed on the Vietnamese stock market - 25
Source: Synthesized from industry reports of HNX and HOSE
According to statistics, if in 2010, only 6 enterprises delisted on both HNX and HOSE exchanges, in 2012, 22 enterprises were delisted and in 2013, the number of enterprises leaving the exchange reached 37. In 2014, the number of delistings tended to decrease, to 30 enterprises, of which 25 enterprises were on HNX and only 5 enterprises on HOSE. Most of these enterprises had consecutive business losses. In 2015, the number of enterprises delisted remained high (35 enterprises, of which 34 were non-financial enterprises) - accounting for 13.3%, the loss value increased by 22.6% compared to the same period last year.
1 According to regulations, enterprises with charter capital of over 30 billion VND and under 120 billion VND are listed on HNX, over 120 billion VND are listed on HOSE
In addition to the mandatory delisting due to losses, 2014 also recorded enterprises delisting due to non-compliance with regulations on full and transparent information disclosure such as Huy Thang Construction Joint Stock Company (HTB). Enterprises including Postal Service Development and Construction Joint Stock Company (QCC) and Song Da 9.06 Joint Stock Company (S96) were delisted because the auditing organization refused to give an opinion on the 2013 audited financial statements.
In addition, many enterprises also delisted due to mergers such as: Na Loi Hydropower Joint Stock Company (NLC), Song Da 10.1 Joint Stock Company (SNG), Song Da 9.01 Joint Stock Company (S91), Song Da Traffic Construction Joint Stock Company (SKS) - in 2014 , Gia Lai Thermal Power Sugarcane Joint Stock Company (SEC), Ninh Hoa Sugar Joint Stock Company (NHS) - in 2015 or voluntarily delisted such as Network Infrastructure Services Joint Stock Company (NIS) - in 2014 ; Beton 6 Joint Stock Company (BT6), Century 21 Joint Stock Company (C21), Minh Phu Seafood Joint Stock Company (MPC), Viet Thang Animal Feed Joint Stock Company (VTF), Ngo Han Joint Stock Company (NHW), Saigon Beer Transportation and Delivery Joint Stock Company (SBC) and Tan Tien Plastic Packaging Joint Stock Company (TTP) - in 2015 . The only case in 2015 was FIT Group Corporation (FIT) moving from HNX to HOSE.
Table 4.2. List of enterprises delisted due to losses on HOSE in 2015
STT
Code | Company name | Cancellation date Listed | |
1 | AVF | Viet An Joint Stock Company | June 10, 2015 |
2 | HLA | Asia Friendship Joint Stock Company | 12/2/2015 |
3 | NVN | Vietnam Housing Corporation | 5/5/2015 |
4 | VST | Vietnam Shipping and Chartering Joint Stock Company | 5/8/2015 |
5 | HSI | General Materials and Biochemical Fertilizer Joint Stock Company | April 23, 2015 |
6 | DCT | Dong Nai Construction Materials Roofing Joint Stock Company | 5/8/2015 |
7 | VNI | Vietnam Real Estate Investment Joint Stock Company | April 24, 2015 |
8 | MTG | MT Gas Joint Stock Company | June 5, 2015 |
Source: Stoxbiz.vn
Table 4.3. List of enterprises delisted due to losses on HNX in 2015
STT
Code | Company name | Delisting date | |
1 | SSG | Hai Au Shipping Joint Stock Company | May 15, 2015 |
2 | BVG | Bac Viet Steel Joint Stock Company | May 21, 2015 |
3 | V15 | Construction Joint Stock Company No. 15 | July 14, 2015 |
4 | VPC | Vietnam Energy Investment and Development Joint Stock Company | May 15, 2015 |
5 | CTM | Vinavico Mining and Construction Investment Joint Stock Company | June 21, 2015 |
6 | LM3 | Lilama 3 Joint Stock Company | May 15, 2015 |
7 | PFL | Dong Do Petroleum Joint Stock Company | April 24, 2015 |
8 | VNN | VNN Investment and Trading Joint Stock Company | May 15, 2015 |
9 | TSM | Tien Son Ha Tay Cement Joint Stock Company | June 12, 2015 |
10 | SD1 | Song Da 1 Joint Stock Company | May 15, 2015 |
11 | MAX | Vinh Sinh Friendship Mining and Mechanical Joint Stock Company | June 29, 2015 |
12 | PTM | PTM Automobile Manufacturing, Trading and Service Joint Stock Company | May 15, 2015 |
13 | PID | Petroleum Interior Decoration Joint Stock Company | 7/1/2015 |
14 | PHH | Hong Ha Vietnam Joint Stock Company | August 10, 2015 |
15 | BTH | Hanoi Transformer and Electrical Materials Manufacturing Joint Stock Company | 5/7/2015 |
Source: Stoxbiz.vn
Thus, in the period 2013-2015, the number of enterprises delisted was always high, especially, enterprises delisted due to losses on the HNX floor were always more than on the HOSE floor. This shows that the requirement for poor quality listed stocks must accept strong screening and elimination by the market and investors.
* The stock market in the period of 2016 - 2017 had strong changes in both quantity and quality, the Vietnamese stock market had a strong breakthrough in terms of points, liquidity as well as scale. The VN-Index at the closing session of 2016 was at 664.87 points, up 14.82% compared to the end of 2015. By 2017, after more than 10 years, the VN-Index returned to the 1,000 point area, up 45.86% compared to the end of 2016.
The market size increased sharply in the period 2016 - 2017. 2016 marked a series of large-capitalization stocks listed on the stock exchange, including big names such as Vietnam Airlines, Sabeco, ACV, Novaland, Habeco, Quang Ngai Sugar, etc. The total number of listed and registered enterprises on the market was 1,706, an increase of 13% over the same period last year. The total market capitalization value at the end of 2016 was 2,880 trillion VND, equivalent to 68.7% of GDP, an increase of 32.5% over the end of 2015.
In 2017, the wave of listing of a series of large companies and corporations such as Vietnam National Petroleum Group, Textile and Garment Group, Vincom Retail, Vietjet... and banks helped the market grow strongly in scale. By the end of 2017, the market capitalization was 4,528 trillion VND, an increase of 57.23% compared to the end of 2016, equivalent to 90.43% of GDP, exceeding the target set for 2020. Also in 2017, the derivatives market officially came into operation, after nearly 4 months from August 10, 2017, the total trading volume of this market reached 946,326 contracts, the average trading volume was approximately 10,399 contracts/day and the transaction value according to the nominal contract size reached 889 billion VND/session.
Table 4.4. Stock market size in the period 2016 - 2017
Year
Market capitalization (billion VND) | %GDP | Increase /down from last year | Volume of listed and registered securities for trading (rate) contract | Increase /down from last year | Number of listed and registered businesses | Increase /down from last year | |
2016 | 2,880,268 | 68.7% | 32.50% | 84.65 | 29% | 1,706 | 13% |
2017 | 4,528,506 | 90.43% | 57.23% | 106.87 | 26% | 2,036 | 19% |
Source: State Securities Commission
Overall, the performance of listed companies in the period 2016 - 2017 also had positive changes. Based on the data recorded by the State Securities Commission, the total revenue and profit of listed companies tended to increase sharply over the years 2016 - 2017. 2016 was a fairly effective business year for companies with many favorable conditions such as reduced raw material prices in some industries, low oil prices at an average of 40 USD/barrel, interest rates and exchange rates were flexibly managed, helping companies stand firm against the waves of influence from the international market.