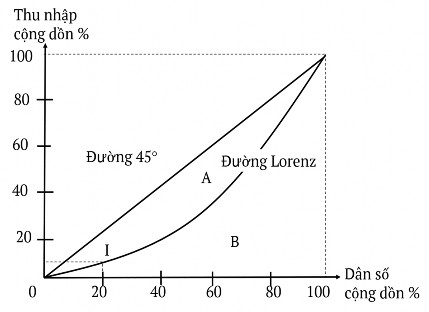
- Point I – The poorest 20% of the world's population only receive 10% of the income.
- The 45 0 diagonal shows that any point on this line reflects the percentage of income received equal to the percentage of people with income.
For example: At point 3/4 of the diagonal, 75% of the income will be distributed to 75% of the population.
Thus, the 45 0 diagonal represents a fair distribution.
- The distance between the 45% diagonal and the Lorenz line is an indication of the level of inequality. The further the Lorenz line is from the 45 0 line , the greater the level of inequality.
Income distribution of Thailand and Vietnam in 1998
Country Name
Income % of 20% of population | |||||
Poor best | Near poor best | Central jar | Almost rich best | Richest | |
Thailand | 4.3 | 7.8 | 11.9 | 19.7 | 56.3 |
Vietnam | 8.2 | 11.9 | 15.5 | 21.2 | 43.3 |
Maybe you are interested!
-
 Some Theoretical Models on Economic Sector Structure Shift
 -
 GDP and GDP Growth Rate of Hanoi as of December 31, 2006, by Economic Sector - Calculated at 1994 Prices
 -
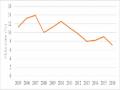 Economic Growth Rate of Thua Thien Hue Province in the Period 2005 - 2016
 -
 The Role of the State in Economic Growth
 -
 The Integration Process Creates a New, More Dynamic Economic Environment Serving the Growth Process and Gradually Shifting the Economic Structure
The limitation of the Lorenz curve is that it does not quantify the level of inequality.
2.3.1.2. GINI coefficient (G)
- G is a widely used measure in empirical studies.
G
=
Area (A)
- Based on the Lorenz curve, the coefficient G is the ratio between the area limited by the Lorenz curve and the 45 0 line and the area of the triangle below the 45 0 line .
Area(A+B)
In theory 0 G 1, in practice 0 < G < 1. According to WB data, 0.2 G 0.6. For low-income countries 0.3 G 0.5, for high-income countries 0.2 G 0.4.
- G has quantified the level of inequality in income distribution, but only reflects the general aspect, in some cases it has not been specifically assessed.
2.3.2. Models of economic growth inequality
2.3.2.1. Simon Kuznets' Inverted U Model
Income share of the richest 20% of the total population
Kuznets ratio =
Income share of the poorest 60% of the total population
- 1955 – Kuznets - an American economist proposed an empirical research model to examine the relationship between income and inequality in income distribution.
For example: India = 1.95; Sri Lanka 1.67; USA 1.29; UK 1.25. This value shows that in developing countries there is a tendency for higher inequality than in developed countries.
- If the relationship is represented on a graph, it will have an inverted U-shape. That is, inequality will increase in the early stages and decrease in the later stages.
Gini
GDP/capita

0.6

1
0.2
0
- Income inequality will increase from low-income to middle-income countries and decrease from middle-income to high-income countries.
- The limitation of the Kuznets model is that it cannot explain the following two important issues.
+ What are the fundamental causes that have created inequality in the development process?
+ The extent to which countries differ in this trend of change given the different policies they use to affect growth and inequality. That is, do low-income countries necessarily accept rising inequality in the process of economic growth?
2.3.2.2. Lewis's growth first, equality later model
- Inequality will initially increase and then decrease once a certain level of development has been reached. The reasons for this trend are explained as follows:
+ Inequality increases in the early stages because:
Along with the development of industrial production scale, the number of workers attracted to the workplace is increasing but wages are still at a minimum level.
When workers' wages remain unchanged, capitalists' income continues to increase.
+ In the later stage, inequality decreased because surplus labor was absorbed into urban areas (industrial production and services).
labor becomes a scarce factor of production. The increasing demand for labor leads to increased wages and reduced inequality.
- Inequality is not only a result of economic growth but also a necessary condition for growth. Inequality means that capitalists and high-income groups will receive more money, and at the same time they are the ones who use their savings to accumulate resources to expand production.
- Conclusion of the Lewis model.
+ Inequality is a condition for the rich to increase accumulation and investment, thereby promoting economic growth.
+ When the rich increase their income, their consumption demand is higher (oriented towards luxury goods). Therefore, their average savings rate is lower. Therefore, for developing countries, reducing inequality will promote economic growth through savings and investment. That is, it is possible to combine fairness and economic growth.
2.3.2.3. Oshima's model of growth with equality
- According to Oshima's two-sector model, based on the characteristics of Asian agricultural production, production is highly seasonal, so the growth process needs to start from the agricultural sector. This process will lead to limiting inequality in the growth process.
- According to Oshima:
+ The income gap between rural and urban areas will be improved right from the beginning due to the focus on developing rural areas based on land reform policies, state support in seeds, techniques, and development of many industries, leading to a gradual increase in income in rural areas.
+ The income gap between large and small-scale enterprises in urban areas and between large and small farms in rural areas improved in two stages.
In the early stages, the income gap increased as large production facilities took advantage of scale and conditions for applying science and technology.
In the later stage, the benefits of infrastructure and the ability to apply science and technology in new small establishments increased, causing the income gap to gradually decrease.
+ Savings will gradually increase among population groups, including low-income groups, because increasing income will satisfy spending needs, and they will start saving to invest in production development and education and training for their children.
2.3.2.4. WB's model of redistribution along with economic growth
- Redistribution along with economic growth is a way to redistribute the results of economic growth so that over time, income distribution gradually improves as growth continues.
- This process includes 2 elements:
+ Policy of redistribution of assets (wealth).
+ Redistribution policy from growth.
- The above policy is needed because the cause of injustice in the distribution of individual income is that in most developing countries there is injustice in the issue of property ownership.
- The main reason why nearly 20% of the population receives more than 50% of the income is because this 20% owns and controls >70% of the productive resources (physical capital, land, human capital in the form of high education).
- The policies applied are: land reform, increasing educational opportunities for many people, combined with rural agricultural credit policies, agricultural product consumption, and technology policies.
For example, South Korea and Taiwan after land reform have a GINI coefficient of 0.34; Taiwan 0.31.
2.3.3. Gender inequality
- Gender is a term used to describe the social roles, behaviours and expectations associated with men and women. It plays a major role in determining people's life chances and their roles in society and the economy.
- The United Nations (UNDP) gives 2 indicators:
+ Gender Development Index (GDI):
Reflects achievements in the same dimensions as the HDI (life expectancy, education, income) but adjusts those outcomes for gender inequality.
In each country, the closer the value and rank of GDI is to HDI, the less gender difference there is and vice versa.
For example:
Value
HDI
Water | ||||
Norway | 0.939 | 1 | 0.937 | 1 |
Singapore | 0.876 | 26 | 0.871 | 26 |
Vietnam | 0.682 | 101 | 0.680 | 89 |
Value Rating
GDI
Rating
+ Gender Equality Measure (GEM):
This measure focuses on women's opportunities rather than their abilities. It shows gender inequality in three aspects.
Political participation and decision-making power measured by the ratio of seats in parliament held by women and men.
Economic participation and decision-making: Measured by the proportion of leadership and management positions held by women and men and the proportion of technical and professional positions held by women and men.
Rights to economic resources: Measured by estimated earnings of women and men (PPPUSD).
- When studying GDI and GEM of countries, UNDP pointed out that:
+ Higher gender inequality in human development does not depend on income level or stage of development.
+ High income is not a prerequisite for creating opportunities for women.
+ Although there has been progress in gender equality in recent decades, gender discrimination is still common in countries around the world.
+ Gender equality is a goal of development, a factor to increase national growth and reduce poverty.
Measure:
There must be an environment and institutions to provide equal rights and opportunities for women.
There are policy solutions related to gender inequality.
2.4. Poverty in developing countries
2.4.1. Income poverty
2.4.1.1. Concept
- Poverty is a state of deprivation in many aspects such as: limited income, lack of income generating opportunities, lack of assets to ensure consumption in difficult times and vulnerability to sudden changes, little participation in the decision-making process.
- According to the ESCAP Asia-Pacific regional anti-poverty conference held in Bangkok (9/93):
Poverty is a situation in which a part of the population cannot enjoy and satisfy basic human needs, which are recognized by society depending on the level of socio-economic development and local customs and practices.
2.4.1.2. Income poverty assessment method
a) Absolute poverty: represents the minimum income level necessary to ensure basic material needs such as food, clothing, and housing so that each person can continue to exist.
- When considering poverty levels according to the above concept, there are some shortcomings.
after:
+ Determining this level is a subjective matter, causing difficulties for
comparison between countries
+ Minimum income levels will vary according to living standards, over time and by country.
b) Poverty line (poverty line)
We can define the poverty line either by income or by expenditure. Expenditure is preferred because it is more closely related to welfare and income data are often inaccurate (due to the self-employment component).
c) World Bank method
- Is a method based on a spending threshold in USD per day.
- The current poverty line is 1USD and 2USD/day (according to PPPUSD). This is the spending threshold that can ensure the minimum energy supply needed for humans is 2100 calories/person/day.
- This poverty threshold is the food poverty threshold (low poverty). Because this spending level only ensures the standard level of energy supply but is not enough to cover other needs.
d) Vietnamese method
* General Statistics Office method: Based on both income and expenditure per capita.
This method identifies two poverty lines:
- The first poverty line is the amount of money needed to buy a daily amount of food to ensure a level of nutrition.
- The second poverty line is the general poverty line, which includes expenditure on non-food goods.
Poverty line in Vietnam
Poverty threshold
Average expenditure per capita/year | ||
1/1993 | 1/1998 | |
- About food, food product | 750 000 VND | 1 287 000 VND |
- General poverty line | 1116 000 VND | 1,788,000 VND |
* Method based on household income (Ministry of Labor, Invalids and Social Affairs) applied for the period 2016-2020.
- This method is currently used to determine the poverty line of the national poverty reduction program.
+ Poverty standard: 700,000 VND/person/month in rural areas and
900,000 VND/person/month in urban areas.
- People considered to be income poor are those whose income falls below the prescribed limits.
- Determining who is poor is always a difficult problem. The common way and used by developing countries and the World Bank is based on the results of surveys on household income (expenditure).