2.2.1.2 Qualitative research & scale calibration
Conduct qualitative research
After building the preliminary scale, the author conducted qualitative research to explore and adjust the variables used to measure the factors in the research model. The author used the form of direct discussion with the subjects in accordance with the characteristics of the observation sample. Seven people were selected to participate in the study, including those who regularly shop online and have purchased household appliances through online channels. These research subjects participated in discussions with the researcher about the factors that influence the intention to buy household appliances online. First, the author conducted direct discussions with each research subject to collect data. Then, the author used the collected data to adjust the questionnaire. From there, the author used the adjusted questionnaire to continue discussing with the subjects until the following questions gave results similar to the results that had been implemented.
Qualitative research results
After completing the qualitative research, the author used the research results to calibrate the scale. The qualitative research results showed that most of the opinions of the research subjects agreed with the content of the factors affecting consumers' intention to buy household appliances online. However, some people suggested that the questions should be adjusted to be worded and presented concisely to limit the boredom of survey participants. Finally, the author designed an official survey questionnaire with 33 observed variables for the research model (presented in Appendix 2: survey questionnaire).
2.2.2 Sampling and data processing methods
After completing the design of the official survey questionnaire, the author proceeds to collect data for quantitative research. This quantitative data will be used to assess the reliability of the scale, test the scale and test the hypothesis.
2.2.2.1 Sampling method
The research sample was selected by the author using the convenience method, one of the non-probability sampling methods. Hair, et al. (2014) suggested that the number of samples should be 5 times larger than the number of observed variables, n=5k in which n is the number of samples to be surveyed, k is the number of observed variables. Therefore, the minimum number of samples for this study is 165 samples for 33 observed variables.
2.2.2.2 Data collection
Data collection was conducted through interviews using questionnaires. The survey subjects were customers aged 20-55, living in Hanoi, and had purchased household products online. The survey was conducted by designing an online questionnaire on Google Form and sending the link to the survey subjects to answer online.
Research location: Hanoi City Number of questionnaires distributed: 190 questionnaires
Time: From September 25, 2020 ~ October 25, 2020
The sample was collected by convenience method in the form of an online Google Form survey questionnaire sent via email. The results obtained were 181 responses, of which 11 were invalid because the respondents of this questionnaire
32
never purchased household goods online. Therefore, the final result left 170 suitable responses used for quantitative analysis.
2.2.2.3 Data analysis method
After collecting quantitative data, data analysis will be performed in the following order:
- Step 1: Clean, encode data, enter input information using SPSS 24 statistical software.
- Step 2: Perform descriptive statistics of the data
- Step 3: Evaluate the reliability of the Cronbach's Alpha scale
- Step 4: Exploratory Factor Analysis (EFA)
- Step 5: Perform multivariate regression analysis and test the proposed hypotheses of the research model.
2.3 Research results
2.3.1 Characteristics of the research sample
a) Gender
According to the statistical results in Table 2, women accounted for 55.3% of the observed sample and men accounted for 44.7%. This shows that in the observed sample of this study, the number of women shopping for household appliances through online sites is 11% more than that of men.
Sex
Quantity | Ratio | |
Female | 94 | 55.3% |
Male | 76 | 44.7% |
Total | 170 | 100% |
Maybe you are interested!
-

 Factors affecting the level of Internet Banking usage of customers in Ho Chi Minh City - 1
 -
 Home business households and preferential loan procedures at banks today - 3
 -
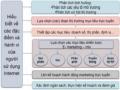 Online Marketing Operation Process According to Hvntd Model on the Internet
 -
 The Fundamentals of Home Finance
 -
 Experience in Improving the Investment Environment at Home and Abroad

Table 2. Sample classification by gender
b) Age
The age of the survey subjects is most concentrated in 3 age groups: 25-29 years old (47.1%), 20-24 years old (33.5%). This is the group of subjects with the most frequent Internet usage and a lot of experience in online shopping. At the same time, these are 3 age groups of young families with high demand for household appliances to serve family life. The two age groups with the lowest rates are 2.9% and 1.8%, respectively, for the 41-50 and over 50 age groups.
Age
Quantity | Ratio | |
20 - 24 years old | 57 | 33.5% |
25 – 29 years old | 80 | 47.1% |
30 – 40 years old | 25 | 14.7% |
41 – 50 years old | 5 | 2.9% |
Over 50 years old | 3 | 1.8% |
Total | 170 | 100% |
Table 3. Sample classification by age
2.3.2 Internet usage and online home appliance shopping behavior
a) Experience using the Internet
In the 170 questionnaires collected, the highest proportion of subjects with experience using the Internet for more than 3 years (63%), followed by those with experience using the Internet from 1 to 3 years (33%). There were only 7 subjects with experience using the Internet for less than 1 year, accounting for 4% of the total 170 people.
Number of years of use
Internet
Quantity | Ratio | |
Under 1 year | 7 | 4% |
From 1 to 3 years | 56 | 33% |
34
Over 3 years
107 | 63% | |
Total | 170 | 100% |
Table 4. Experience using the Internet
b) Time spent using the Internet
Of the 170 research subjects, 165 subjects used the Internet more than 1 hour/day, of which the group using from 2 to 4 hours had 92 subjects, accounting for the highest rate of 54.1%. Following that were the 4-6 hour group (25.3%) and the 1-2 hour group (11.2%). Only 5 subjects used the Internet less than 1 hour/day, accounting for the lowest rate compared to the other groups (2.9%). This data shows that most of the research subjects spent quite a lot of time each day using the Internet.
Access duration
everyday
Quantity | Ratio | |
Under 1 hour | 5 | 2.9% |
1 – 2 hours | 19 | 11.2% |
From 2 – 4 hours | 92 | 54.1% |
From 4 -6 hours | 43 | 25.3% |
Over 6 hours | 11 | 6.5% |
Total | 170 | 100% |
Table 5. Internet access time
c) Household products purchased online
In the research group, there were 105 people who bought household appliances online, accounting for the highest percentage of 61.8%, followed by large household appliances with 30%. The number of people buying consumer electronics online was the lowest, accounting for only 8.2%. This shows that small household appliances such as pots and pans,
Small electrical appliances and kitchen appliances are the product groups that many people choose to buy online. Meanwhile, shopping for consumer electronics products such as TVs and technology devices through e-commerce channels is still not popular.
Product Group
Quantity | Ratio | |
Small appliances | 105 | 61.8% |
Large Appliances | 51 | 30% |
Consumer Electronics | 14 | 8.2% |
Total | 170 | 100% |
Table 6. Household product groups purchased online
d) Value of online household basket
The results show that 90% of the research subjects spend less than 5 million VND for each time they shop for household appliances through e-commerce channels. Of these, 83 subjects spend less than 1 million VND, accounting for the highest rate of 48.8%. This is followed by the 1-2 million VND groups (30%) and 3-5 million VND groups (11.2%). Only 17 people spend more than 6 million VND to buy household appliances online. This may show that consumers currently do not have the habit of shopping for high-value household products online. Products purchased online are mainly low- and medium-value products.
Cart Value
Quantity | Ratio | |
Under 1 million VND | 83 | 48.8% |
From 1 - 2 million VND | 51 | 30% |
From 3 - 5 million VND | 19 | 11.2% |
From 6 - 10 million VND | 11 | 6.5% |
36
Over 10 million VND
6 | 3.5% | |
Total | 170 | 100% |
Table 7. Value of online household basket
2.4 Cronbach's Alpha scale reliability analysis
Cronbach's Alpha coefficient is used to assess the reliability of the scale. Cronbach's Alpha reliability analysis method is used before EFA exploratory factor analysis to assess the level of association between measurement variables, however, this coefficient has not yet shown inappropriate garbage variables. At that time, calculating the correlation coefficient between the variable-total will help find the observed variables that do not contribute to the description of the concept to be measured, thereby eliminating inappropriate variables. The higher the variable-total correlation coefficient, the higher the correlation of the variables with other variables in the same group (DeVon, et al., 2007). The criterion for assessing the reliability of the scale is that the larger the Alpha coefficient, the greater the consistent reliability. Nunnally & Bernstein (2010) suggested that an Alpha value greater than 0.8 is a good measurement scale, from 0.7 to 0.8 is usable, and from 0.6 or higher can be used for new research concepts. Observed variables are considered suitable if the item-total correlation coefficient is greater than 0.3. Variables with item-total correlation coefficients less than 0.3 are considered junk variables and will be removed from the scale (Nunnally & Bernstein, 2010).
Factor
Cronbach's Alpha | Observation variable | Total variable correlation | Cronbach's Alpha if variable is eliminated | |
Perceived ease of use | 0.791 | PEU1 | 0.619 | 0.731 |
PEU2 | 0.654 | 0.695 | ||
PEU3 | 0.626 | 0.712 | ||
PEU4 | 0.632 | 0.703 |
Perceived usefulness
0.785 | PU5 | 0.744 | 0.747 | |
PU6 | 0.691 | 0.763 | ||
PU7 | 0.684 | 0.758 | ||
PU8 | 0.734 | 0.749 | ||
Trust | 0.819 | TR9 | 0.750 | 0.739 |
TR10 | 0.669 | 0.769 | ||
TR11 | 0.627 | 0.790 | ||
TR12 | 0.598 | 0.815 | ||
Price awareness | 0.823 | PP13 | 0.766 | 0.759 |
PP14 | 0.753 | 0.781 | ||
PP15 | 0.672 | 0.796 | ||
PP16 | 0.653 | 0.804 | ||
Online shopping experience | 0.912 | OPX17 | 0.795 | 0.880 |
OPX18 | 0.793 | 0.882 | ||
OPX19 | 0.780 | 0.885 | ||
OPX20 | 0.802 | 0.877 | ||
Online Word of Mouth | 0.841 | EWM21 | 0.698 | 0.783 |
EWM22 | 0.648 | 0.805 | ||
EWM23 | 0.622 | 0.816 | ||
EWM24 | 0.712 | 0.776 | ||
Product risk perception | 0.735 | PPR25 | 0.514 | 0.694 |
PPR26 | 0.518 | 0.686 | ||
PPR27 | 0.515 | 0.689 | ||
Security risk awareness | 0.731 | SPR28 | 0.535 | 0.695 |
SPR29 | 0.526 | 0.702 | ||
SPR30 | 0.602 | 0.691 |
38