Create Conditional Ranges for Use with Database Functions
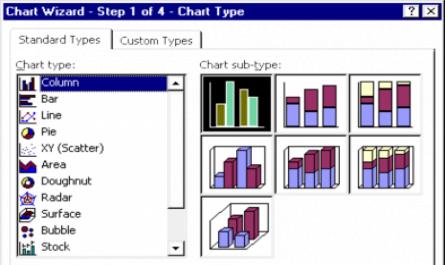
LESSON 4 CHART WIZARD In addition to using two-dimensional arrays to organize data, in Excel to show the correlation between data series we can represent them by charts. Charts are in the form of graphics, divided into many types: Area (area type); Bar (bar); Column (column); Line (line); Pie ...