Table 3.11. Energy and nutrient composition of the average diet
bottles/day/crew
Energy and substances
nutrition
Single taste | Boat pill | Standard of hard labor vn | |
Energy | Kcal | 3500.47 | 3400.00 - 3600.00 |
Protein | g | 140.80 | 127.50 - 135.00 |
Lipids (total) | g | 105.30 | 75.60 - 80.00 |
Carbohydrates (total) | g | 488.50 | 552.50 - 585.00 |
Energy ratio: Of Protein Of Lipid Of Glucid | |||
% | 15.30 | 12 | |
% | 28.60 | 15 - 20 | |
% | 59.00 | 65 - 70 |
Maybe you are interested!
-

 Identify Rating Levels and Rating Scales
zt2i3t4l5ee
zt2a3gstourism,quan lan,quang ninh,ecology,ecotourism,minh chau,van don,geography,geographical basis,tourism development,science
zt2a3ge
zc2o3n4t5e6n7ts
of the islanders. Therefore, this indicator will be divided into two sub-indicators:
a1. Natural tourism attractiveness a2. Cultural tourism attractiveness
b. Tourist capacity
The two island communes in Quan Lan have different capacities to receive tourists. Minh Chau Commune is home to many standard hotels and resorts, attracting high-income domestic and international tourists. Meanwhile, Quan Lan Commune has many motels mainly built and operated by local people, so the scale and quality are not high, and will be suitable for ordinary tourists such as students.
c. Time of exploitation of Quan Lan Island Commune:
Quan Lan tourism is seasonal due to weather and climate conditions and festivals only take place on certain days of the year, specifically in spring. In Quan Lan commune, the period from April to June and from September to November is considered the best time to visit Quan Lan because the cultural tourism activities are mainly associated with festivals taking place during this time.
Minh Chau island commune:
Tourism exploitation time is all year round, because this is a place with a number of tourist attractions with diverse ecosystems such as Bai Tu Long National Park Research Center, Tram forest, Turtle Laying Beach, so besides coming to the beach for tourism and vacation in the summer, Minh Chau will attract research groups to come for tourism combined with research at other times of the year.
d. Sustainability
The sustainability of ecotourism sites in Quan Lan and Minh Chau communes depends on the sensitivity of the ecosystems to climate changes.
landscape. In general, these tourist destinations have a fairly high level of sustainability, because they are natural ecosystems, planned and protected. However, if a large number of tourists gather at certain times, it can exceed the carrying capacity and affect the sustainability of the environment (polluted beaches, damaged trees, animals moving away from their habitats, etc.), then the sustainability of the above ecosystems (natural ecosystems, human ecosystems) will also be affected and become less sustainable.
e. Location and accessibility
Both island communes have ports to take tourists to visit from Van Don wharf:
- Quan Lan – Van Don traffic route:
Phuc Thinh – Viet Anh high-speed boat and Quang Minh high-speed boat, depart at 8am and 2pm from Van Don to Quan Lan, and at 7am and 1pm from Quan Lan to Van Don. There are also wooden boats departing at 7am and 1pm.
- Van Don - Minh Chau traffic route:
Chung Huong high-speed train, Minh Chau train, morning 7:30 and afternoon 13:30 from Van Don to Minh Chau, morning 6:30 and afternoon 13:00 from Minh Chau to Van Don.
f. Infrastructure
Despite receiving investment attention, the issue of infrastructure and technical facilities for tourism on Quan Lan Island is still an issue that needs to be resolved because it has a direct impact on the implementation of ecotourism activities. The minimum conditions for serving tourists such as accommodation, electricity, water, communication, especially medical services, and security work need to be given top priority. Ecotourism spots in Minh Chau commune are assessed to have better infrastructure and technical facilities for tourism because there are quite complete and synchronous conditions for serving tourists, meeting many needs of domestic and foreign tourists.
3.2.1.4. Determine assessment levels and assessment scales
Corresponding to the levels of each criterion, the index is the score of those levels in the order of 4, 3, 2, 1 decreasing according to the standard of each level: very attractive (4), attractive (3), average (2), less attractive (1).
3.2.1.5. Determining the coefficients of the criteria
For the assessment of DLST in the two communes of Quan Lan and Minh Chau islands, the students added evaluation coefficients to show the importance of the criteria and indicators as follows:
Coefficient 3 with criteria: Attractiveness, Exploitation time. These are the 2 most important criteria for attracting tourists to tourism in general and eco-tourism in particular, so they have the highest coefficient.
Coefficient 2 with criteria: Capacity, Infrastructure, Location and accessibility . Because the assessment area is an island commune of Van Don district, the above criteria are selected by the author with appropriate coefficients at the average level.
Coefficient 1 with criteria: Sustainability. Quan Lan has natural and human-made ecotourism sites, with high biodiversity and little impact from local human factors. Most of the ecotourism sites are still wild, so they are highly sustainable.
3.2.1.6. Results of DLST assessment on Quan Lan island
a. Assessment of the potential for natural tourism development
For Minh Chau commune:
+ Natural tourism attractiveness is determined to be very attractive (4 points) and the most important coefficient (coefficient 3), so the score of the Attractiveness criterion is 4 x 3 = 12.
+ Capacity is determined as average (2 points) and the coefficient is quite important (coefficient 2), then the score of Capacity criterion is 2 x 2 = 4.
+ Exploitation time is long (4 points), the most important coefficient (coefficient 3) so the score of the Exploitation time criterion is 4 x 3 = 12.
+ Sustainability is determined as sustainable (4 points), the important coefficient is the average coefficient (coefficient 1), so the score of the Sustainability criterion is 4 x 1 = 4 points
+ Location and accessibility are determined to be quite favorable (2 points), the coefficient is quite important (coefficient 2), the criterion score is 2 x 2 = 4 points.
+ Infrastructure is assessed as good (3 points), the coefficient is quite important (coefficient 2), then the score of the Infrastructure criterion is 3 x 2 = 6 points.
The total score for evaluating DLST in Minh Chau commune according to 6 evaluation criteria is determined as: 12 + 4 + 12 + 4 + 4 + 6 = 42 points
Similar assessment for Quan Lan commune, we have the following table:
Table 3.3: Assessment of the potential for natural ecotourism development in Quan Lan and Minh Chau communes
Attractiveness of self-tourismof course
Capacity
Mining time
Sustainability
Location and accessibility
Infrastructure
Result
Point
DarkMulti
Point
DarkMulti
Point
DarkMulti
Point
DarkMulti
Point
DarkMulti
Point
DarkMulti
CommuneMinh Chau
12
12
4
8
12
12
4
4
4
8
6
8
42/52
Quan CommuneLan
6
12
6
8
9
12
4
4
4
8
4
8
33/52
b. Assessment of the potential for humanistic tourism development
For Quan Lan commune:
+ The attractiveness of human tourism is determined to be very attractive (4 points) and the most important coefficient (coefficient 3), so the score of the Attractiveness criterion is 4 x 3 = 12.
+ Capacity is determined to be large (3 points) and the coefficient is quite important (coefficient 2), then the score of the Capacity criterion is 3 x 2 = 6.
+ Mining time is average (3 points), the most important coefficient (coefficient 3) so the score of the Mining time criterion is 3 x 3 = 9.
+ Sustainability is determined as sustainable (4 points), the important coefficient is the average coefficient (coefficient 1), so the score of the Sustainability criterion is 4 x 1 = 4 points.
+ Location and accessibility are determined to be quite favorable (2 points), the coefficient is quite important (coefficient 2), the criterion score is 2 x 2 = 4 points.
+ Infrastructure is rated as average (2 points), the coefficient is quite important (coefficient 2), then the score of the Infrastructure criterion is 2 x 2 = 4 points.
The total score for evaluating DLST in Quan Lan commune according to 6 evaluation criteria is determined as: 12 + 6 + 6 + 4 + 4 + 4 = 36 points.
Similar assessment with Minh Chau commune we have the following table:
Table 3.4: Assessment of the potential for developing humanistic eco-tourism in Quan Lan and Minh Chau communes
Attractiveness of human tourismliterature
Capacity
Mining time
Sustainability
Location and accessibility
Infrastructure
Result
Point
DarkMulti
Point
DarkMulti
Point
DarkMulti
Point
DarkMulti
Point
DarkMulti
Point
DarkMulti
Quan CommuneLan
12
12
6
8
9
12
4
4
4
8
4
8
39/52
Minh CommuneChau
6
12
4
8
12
12
4
4
4
8
6
8
36/52
Basically, both Minh Chau and Quan Lan localities have quite favorable conditions for developing ecotourism. However, Quan Lan commune has more advantages to develop ecotourism in a humanistic direction, because this is an area with many famous historical relics such as Quan Lan Communal House, Quan Lan Pagoda, Temple worshiping the hero Tran Khanh Du, ... along with local festivals held annually such as the wind praying ceremony (March 15), Quan Lan festival (June 10-19); due to its location near the port and long exploitation time, the beaches in Quan Lan commune (especially Quan Lan beach) are no longer hygienic and clean to ensure the needs of tourists coming to relax and swim; this is also an area with many beautiful landscapes such as Got Beo wind pass, Ong Phong head, Voi Voi cave, but the ability to access these places is still very limited (dirt hill road, lots of gravel and rocks), especially during rainy and windy times; In addition, other natural resources such as mangrove forests and sea worms have not been really exploited for tourism purposes and ecotourism development. On the contrary, Minh Chau commune has more advantages in developing ecotourism in the direction of natural tourism, this is an area with diverse ecosystems such as at Rua De Beach, Bai Tu Long National Park Conservation Center...; Minh Chau beach is highly appreciated for its natural beauty and cleanliness, ranked in the top ten most beautiful beaches in Vietnam; Minh Chau commune is also home to Tram forest with a large area and a purity of up to 90%, suitable for building bridges through the forest (a very effective type of natural ecotourism currently applied by many countries) for tourists to sightsee, as well as for the purpose of studying and researching.
Figure 3.1: Thenmala Forest Bridge (India) Source: https://www.thenmalaecotourism.com/(August 21, 2019)
3.2.2. Using SWOT matrix to evaluate Quan Lan island tourism
General assessment of current tourism activities of Quan Lan island is shown through the following SWOT matrix:
Table 3.5: SWOT matrix evaluating tourism activities on Quan Lan island
Internal agent
Strengths- There is a lot of potential for tourism development, especially natural ecotourism and humanistic ecotourism.- The unskilled labor force is relatively abundant.- resource environmentunpolluted, still
Weaknesses- Poorly developed infrastructure, especially traffic routes to tourist destinations on the island.- The team of professional staff is still weak.- Tourism products in general
quite wild, originalintact
general and DLST in particularalone is monotonous.
External agents
Opportunity- Tourism is a key industry in the socio-economic development strategy of the province and Van Don economic zone.- Quan Lan was selected as a pilot area for eco-tourism development within the framework of the green growth project between Quang Ninh province and the Japanese organization JICA.- The flow of tourists and especially ecotourism in the world tends toincreasing
Challenge- Weather and climate change abnormally.- Competition in tourism products is increasingly fierce, especially with other localities in the province such as Ha Long, Mong Cai...- Awareness of tourists, especially domestic tourists, about ecotourism and nature conservation is not high.
Through summary analysis using SWOT matrix we see that:
To exploit strengths and take advantage of opportunities, it is necessary to:
- Diversify products and service types (build more tourism routes aimed at specific needs of tourists: experiential tourism immersed in nature, spiritual cultural tourism...)
- Effective exploitation of resources and differentiated products (natural resources and human resources)
div.maincontent .p { color: black; font-family:"Times New Roman", serif; font-style: normal; font-weight: normal; text-decoration: none; font-size: 14pt; margin:0pt; } div.maincontent p { color: black; font-family:"Times New Roman", serif; font-style: normal; font-weight: normal; text-decoration: none; font-size: 14pt; margin:0pt; } div.maincontent .s1 { color: black; font-family:"Times New Roman", serif; font-style: normal; font-weight: normal; text-decoration: none; font-size: 13pt; } div.maincontent .s2 { color: black; font-family:"Times New Roman", serif; font-style: normal; font-weight: normal; text-decoration: none; font-size: 13pt; } div.maincontent .s3 { color: #0D0D0D; font-family:"Times New Roman", serif; font-style: normal; font-weight: bold; text-decoration: none; font-size: 14pt; } div.maincontent .s4 { color: black; font-family:"Times New Roman", serif; font-style: italic; font-weight: normal; text-decoration: none; font-size: 14pt; } div.maincontent .s5 { color: black; font-family:"Times New Roman", serif; font-style: italic; font-weight: bold; text-decoration: none; font-size: 14pt; } div.maincontent .s6 { color: black; font-family:"Times New Roman", serif; font-style: italic; font-weight: normal; text-decoration: none; font-size: 14pt; vertical-align: -3pt; } div.maincontent .s7 { color: black; font-family:"Times New Roman", serif; font-style: italic; font-weight: normal; text-decoration: none; font-size: 14pt; vertical-align: -2pt; } div.maincontent .s8 { color: black; font-family:"Times New Roman", serif; font-style: italic; font-weight: normal; text-decoration: none; font-size: 14pt; vertical-align: -1pt; } div.maincontent .s9 { color: black; font-family:"Times New Roman", serif; font-style: normal; font-weight: normal; text-decoration: none; font-size: 14pt; } div.maincontent .s10 { color: black; font-family:"Times New Roman", serif; font-style: normal; font-weight: bold; text-decoration: none; font-size: 14pt; } div.maincontent .s11 { color: black; font-family:"Times New Roman", serif; font-style: normal; font-weight: normal; text-decoration: none; font-size: 14pt; } div.maincontent .s12 { color: black; font-family:Symbol, serif; font-style: normal; font-weight: normal; text-decoration: none; font-size: 14pt; } div.maincontent .s13 { color: black; font-family:Wingdings; font-style: normal; font-weight: normal; text-decoration: none; font-size: 14pt; } div.maincontent .s14 { color: black; font-family:"Times New Roman", serif; font-style: normal; font-weight: normal; text-decoration: none; font-size: 9pt; vertical-align: 5pt; } div.maincontent .s15 { color: black; font-family:"Times New Roman", serif; font-style: normal; font-weight: normal; text-decoration: none; font-size: 9pt; vertical-align: 5pt; } div.maincontent .s16 { color: black; font-family:Cambria, serif; font-style: italic; font-weight: normal; text-decoration: none; font-size: 14pt; } div.maincontent .s17 { color: #080808; font-family:"Times New Roman", serif; font-style: normal; font-weight: bold; text-decoration: none; font-size: 14pt; } div.maincontent .s18 { color: #080808; font-family:"Times New Roman", serif; font-style: normal; font-weight: normal; text-decoration: none; font-size: 14pt; } div.maincontent .s19 { color: black; font-family:"Times New Roman", serif; font-style: normal; font-weight: normal; text-decoration: none; font-size: 11pt; } div.maincontent .s20 { color: black; font-family:"Times New Roman", serif; font-style: normal; font-weight: normal; text-decoration: none; font-size: 10pt; } div.maincontent .s21 { color: black; font-family:"Times New Roman", serif; font-style: normal; font-weight: bold; text-decoration: none; font-size: 11pt; } div.maincontent .s22 { color: black; font-family:"Times New Roman", serif; font-style: normal; font-weight: normal; text-decoration: none; font-size: 11pt; } div.maincontent .s23 { color: black; font-family:"Times New Roman", serif; font-style: italic; font-weight: normal; text-decoration: none; font-size: 14pt; } div.maincontent .s24 { color: #212121; font-family:"Times New Roman", serif; font-style: normal; font-weight: normal; tex
Identify Rating Levels and Rating Scales
zt2i3t4l5ee
zt2a3gstourism,quan lan,quang ninh,ecology,ecotourism,minh chau,van don,geography,geographical basis,tourism development,science
zt2a3ge
zc2o3n4t5e6n7ts
of the islanders. Therefore, this indicator will be divided into two sub-indicators:
a1. Natural tourism attractiveness a2. Cultural tourism attractiveness
b. Tourist capacity
The two island communes in Quan Lan have different capacities to receive tourists. Minh Chau Commune is home to many standard hotels and resorts, attracting high-income domestic and international tourists. Meanwhile, Quan Lan Commune has many motels mainly built and operated by local people, so the scale and quality are not high, and will be suitable for ordinary tourists such as students.
c. Time of exploitation of Quan Lan Island Commune:
Quan Lan tourism is seasonal due to weather and climate conditions and festivals only take place on certain days of the year, specifically in spring. In Quan Lan commune, the period from April to June and from September to November is considered the best time to visit Quan Lan because the cultural tourism activities are mainly associated with festivals taking place during this time.
Minh Chau island commune:
Tourism exploitation time is all year round, because this is a place with a number of tourist attractions with diverse ecosystems such as Bai Tu Long National Park Research Center, Tram forest, Turtle Laying Beach, so besides coming to the beach for tourism and vacation in the summer, Minh Chau will attract research groups to come for tourism combined with research at other times of the year.
d. Sustainability
The sustainability of ecotourism sites in Quan Lan and Minh Chau communes depends on the sensitivity of the ecosystems to climate changes.
landscape. In general, these tourist destinations have a fairly high level of sustainability, because they are natural ecosystems, planned and protected. However, if a large number of tourists gather at certain times, it can exceed the carrying capacity and affect the sustainability of the environment (polluted beaches, damaged trees, animals moving away from their habitats, etc.), then the sustainability of the above ecosystems (natural ecosystems, human ecosystems) will also be affected and become less sustainable.
e. Location and accessibility
Both island communes have ports to take tourists to visit from Van Don wharf:
- Quan Lan – Van Don traffic route:
Phuc Thinh – Viet Anh high-speed boat and Quang Minh high-speed boat, depart at 8am and 2pm from Van Don to Quan Lan, and at 7am and 1pm from Quan Lan to Van Don. There are also wooden boats departing at 7am and 1pm.
- Van Don - Minh Chau traffic route:
Chung Huong high-speed train, Minh Chau train, morning 7:30 and afternoon 13:30 from Van Don to Minh Chau, morning 6:30 and afternoon 13:00 from Minh Chau to Van Don.
f. Infrastructure
Despite receiving investment attention, the issue of infrastructure and technical facilities for tourism on Quan Lan Island is still an issue that needs to be resolved because it has a direct impact on the implementation of ecotourism activities. The minimum conditions for serving tourists such as accommodation, electricity, water, communication, especially medical services, and security work need to be given top priority. Ecotourism spots in Minh Chau commune are assessed to have better infrastructure and technical facilities for tourism because there are quite complete and synchronous conditions for serving tourists, meeting many needs of domestic and foreign tourists.
3.2.1.4. Determine assessment levels and assessment scales
Corresponding to the levels of each criterion, the index is the score of those levels in the order of 4, 3, 2, 1 decreasing according to the standard of each level: very attractive (4), attractive (3), average (2), less attractive (1).
3.2.1.5. Determining the coefficients of the criteria
For the assessment of DLST in the two communes of Quan Lan and Minh Chau islands, the students added evaluation coefficients to show the importance of the criteria and indicators as follows:
Coefficient 3 with criteria: Attractiveness, Exploitation time. These are the 2 most important criteria for attracting tourists to tourism in general and eco-tourism in particular, so they have the highest coefficient.
Coefficient 2 with criteria: Capacity, Infrastructure, Location and accessibility . Because the assessment area is an island commune of Van Don district, the above criteria are selected by the author with appropriate coefficients at the average level.
Coefficient 1 with criteria: Sustainability. Quan Lan has natural and human-made ecotourism sites, with high biodiversity and little impact from local human factors. Most of the ecotourism sites are still wild, so they are highly sustainable.
3.2.1.6. Results of DLST assessment on Quan Lan island
a. Assessment of the potential for natural tourism development
For Minh Chau commune:
+ Natural tourism attractiveness is determined to be very attractive (4 points) and the most important coefficient (coefficient 3), so the score of the Attractiveness criterion is 4 x 3 = 12.
+ Capacity is determined as average (2 points) and the coefficient is quite important (coefficient 2), then the score of Capacity criterion is 2 x 2 = 4.
+ Exploitation time is long (4 points), the most important coefficient (coefficient 3) so the score of the Exploitation time criterion is 4 x 3 = 12.
+ Sustainability is determined as sustainable (4 points), the important coefficient is the average coefficient (coefficient 1), so the score of the Sustainability criterion is 4 x 1 = 4 points
+ Location and accessibility are determined to be quite favorable (2 points), the coefficient is quite important (coefficient 2), the criterion score is 2 x 2 = 4 points.
+ Infrastructure is assessed as good (3 points), the coefficient is quite important (coefficient 2), then the score of the Infrastructure criterion is 3 x 2 = 6 points.
The total score for evaluating DLST in Minh Chau commune according to 6 evaluation criteria is determined as: 12 + 4 + 12 + 4 + 4 + 6 = 42 points
Similar assessment for Quan Lan commune, we have the following table:
Table 3.3: Assessment of the potential for natural ecotourism development in Quan Lan and Minh Chau communes
Attractiveness of self-tourismof course
Capacity
Mining time
Sustainability
Location and accessibility
Infrastructure
Result
Point
DarkMulti
Point
DarkMulti
Point
DarkMulti
Point
DarkMulti
Point
DarkMulti
Point
DarkMulti
CommuneMinh Chau
12
12
4
8
12
12
4
4
4
8
6
8
42/52
Quan CommuneLan
6
12
6
8
9
12
4
4
4
8
4
8
33/52
b. Assessment of the potential for humanistic tourism development
For Quan Lan commune:
+ The attractiveness of human tourism is determined to be very attractive (4 points) and the most important coefficient (coefficient 3), so the score of the Attractiveness criterion is 4 x 3 = 12.
+ Capacity is determined to be large (3 points) and the coefficient is quite important (coefficient 2), then the score of the Capacity criterion is 3 x 2 = 6.
+ Mining time is average (3 points), the most important coefficient (coefficient 3) so the score of the Mining time criterion is 3 x 3 = 9.
+ Sustainability is determined as sustainable (4 points), the important coefficient is the average coefficient (coefficient 1), so the score of the Sustainability criterion is 4 x 1 = 4 points.
+ Location and accessibility are determined to be quite favorable (2 points), the coefficient is quite important (coefficient 2), the criterion score is 2 x 2 = 4 points.
+ Infrastructure is rated as average (2 points), the coefficient is quite important (coefficient 2), then the score of the Infrastructure criterion is 2 x 2 = 4 points.
The total score for evaluating DLST in Quan Lan commune according to 6 evaluation criteria is determined as: 12 + 6 + 6 + 4 + 4 + 4 = 36 points.
Similar assessment with Minh Chau commune we have the following table:
Table 3.4: Assessment of the potential for developing humanistic eco-tourism in Quan Lan and Minh Chau communes
Attractiveness of human tourismliterature
Capacity
Mining time
Sustainability
Location and accessibility
Infrastructure
Result
Point
DarkMulti
Point
DarkMulti
Point
DarkMulti
Point
DarkMulti
Point
DarkMulti
Point
DarkMulti
Quan CommuneLan
12
12
6
8
9
12
4
4
4
8
4
8
39/52
Minh CommuneChau
6
12
4
8
12
12
4
4
4
8
6
8
36/52
Basically, both Minh Chau and Quan Lan localities have quite favorable conditions for developing ecotourism. However, Quan Lan commune has more advantages to develop ecotourism in a humanistic direction, because this is an area with many famous historical relics such as Quan Lan Communal House, Quan Lan Pagoda, Temple worshiping the hero Tran Khanh Du, ... along with local festivals held annually such as the wind praying ceremony (March 15), Quan Lan festival (June 10-19); due to its location near the port and long exploitation time, the beaches in Quan Lan commune (especially Quan Lan beach) are no longer hygienic and clean to ensure the needs of tourists coming to relax and swim; this is also an area with many beautiful landscapes such as Got Beo wind pass, Ong Phong head, Voi Voi cave, but the ability to access these places is still very limited (dirt hill road, lots of gravel and rocks), especially during rainy and windy times; In addition, other natural resources such as mangrove forests and sea worms have not been really exploited for tourism purposes and ecotourism development. On the contrary, Minh Chau commune has more advantages in developing ecotourism in the direction of natural tourism, this is an area with diverse ecosystems such as at Rua De Beach, Bai Tu Long National Park Conservation Center...; Minh Chau beach is highly appreciated for its natural beauty and cleanliness, ranked in the top ten most beautiful beaches in Vietnam; Minh Chau commune is also home to Tram forest with a large area and a purity of up to 90%, suitable for building bridges through the forest (a very effective type of natural ecotourism currently applied by many countries) for tourists to sightsee, as well as for the purpose of studying and researching.
Figure 3.1: Thenmala Forest Bridge (India) Source: https://www.thenmalaecotourism.com/(August 21, 2019)
3.2.2. Using SWOT matrix to evaluate Quan Lan island tourism
General assessment of current tourism activities of Quan Lan island is shown through the following SWOT matrix:
Table 3.5: SWOT matrix evaluating tourism activities on Quan Lan island
Internal agent
Strengths- There is a lot of potential for tourism development, especially natural ecotourism and humanistic ecotourism.- The unskilled labor force is relatively abundant.- resource environmentunpolluted, still
Weaknesses- Poorly developed infrastructure, especially traffic routes to tourist destinations on the island.- The team of professional staff is still weak.- Tourism products in general
quite wild, originalintact
general and DLST in particularalone is monotonous.
External agents
Opportunity- Tourism is a key industry in the socio-economic development strategy of the province and Van Don economic zone.- Quan Lan was selected as a pilot area for eco-tourism development within the framework of the green growth project between Quang Ninh province and the Japanese organization JICA.- The flow of tourists and especially ecotourism in the world tends toincreasing
Challenge- Weather and climate change abnormally.- Competition in tourism products is increasingly fierce, especially with other localities in the province such as Ha Long, Mong Cai...- Awareness of tourists, especially domestic tourists, about ecotourism and nature conservation is not high.
Through summary analysis using SWOT matrix we see that:
To exploit strengths and take advantage of opportunities, it is necessary to:
- Diversify products and service types (build more tourism routes aimed at specific needs of tourists: experiential tourism immersed in nature, spiritual cultural tourism...)
- Effective exploitation of resources and differentiated products (natural resources and human resources)
div.maincontent .p { color: black; font-family:"Times New Roman", serif; font-style: normal; font-weight: normal; text-decoration: none; font-size: 14pt; margin:0pt; } div.maincontent p { color: black; font-family:"Times New Roman", serif; font-style: normal; font-weight: normal; text-decoration: none; font-size: 14pt; margin:0pt; } div.maincontent .s1 { color: black; font-family:"Times New Roman", serif; font-style: normal; font-weight: normal; text-decoration: none; font-size: 13pt; } div.maincontent .s2 { color: black; font-family:"Times New Roman", serif; font-style: normal; font-weight: normal; text-decoration: none; font-size: 13pt; } div.maincontent .s3 { color: #0D0D0D; font-family:"Times New Roman", serif; font-style: normal; font-weight: bold; text-decoration: none; font-size: 14pt; } div.maincontent .s4 { color: black; font-family:"Times New Roman", serif; font-style: italic; font-weight: normal; text-decoration: none; font-size: 14pt; } div.maincontent .s5 { color: black; font-family:"Times New Roman", serif; font-style: italic; font-weight: bold; text-decoration: none; font-size: 14pt; } div.maincontent .s6 { color: black; font-family:"Times New Roman", serif; font-style: italic; font-weight: normal; text-decoration: none; font-size: 14pt; vertical-align: -3pt; } div.maincontent .s7 { color: black; font-family:"Times New Roman", serif; font-style: italic; font-weight: normal; text-decoration: none; font-size: 14pt; vertical-align: -2pt; } div.maincontent .s8 { color: black; font-family:"Times New Roman", serif; font-style: italic; font-weight: normal; text-decoration: none; font-size: 14pt; vertical-align: -1pt; } div.maincontent .s9 { color: black; font-family:"Times New Roman", serif; font-style: normal; font-weight: normal; text-decoration: none; font-size: 14pt; } div.maincontent .s10 { color: black; font-family:"Times New Roman", serif; font-style: normal; font-weight: bold; text-decoration: none; font-size: 14pt; } div.maincontent .s11 { color: black; font-family:"Times New Roman", serif; font-style: normal; font-weight: normal; text-decoration: none; font-size: 14pt; } div.maincontent .s12 { color: black; font-family:Symbol, serif; font-style: normal; font-weight: normal; text-decoration: none; font-size: 14pt; } div.maincontent .s13 { color: black; font-family:Wingdings; font-style: normal; font-weight: normal; text-decoration: none; font-size: 14pt; } div.maincontent .s14 { color: black; font-family:"Times New Roman", serif; font-style: normal; font-weight: normal; text-decoration: none; font-size: 9pt; vertical-align: 5pt; } div.maincontent .s15 { color: black; font-family:"Times New Roman", serif; font-style: normal; font-weight: normal; text-decoration: none; font-size: 9pt; vertical-align: 5pt; } div.maincontent .s16 { color: black; font-family:Cambria, serif; font-style: italic; font-weight: normal; text-decoration: none; font-size: 14pt; } div.maincontent .s17 { color: #080808; font-family:"Times New Roman", serif; font-style: normal; font-weight: bold; text-decoration: none; font-size: 14pt; } div.maincontent .s18 { color: #080808; font-family:"Times New Roman", serif; font-style: normal; font-weight: normal; text-decoration: none; font-size: 14pt; } div.maincontent .s19 { color: black; font-family:"Times New Roman", serif; font-style: normal; font-weight: normal; text-decoration: none; font-size: 11pt; } div.maincontent .s20 { color: black; font-family:"Times New Roman", serif; font-style: normal; font-weight: normal; text-decoration: none; font-size: 10pt; } div.maincontent .s21 { color: black; font-family:"Times New Roman", serif; font-style: normal; font-weight: bold; text-decoration: none; font-size: 11pt; } div.maincontent .s22 { color: black; font-family:"Times New Roman", serif; font-style: normal; font-weight: normal; text-decoration: none; font-size: 11pt; } div.maincontent .s23 { color: black; font-family:"Times New Roman", serif; font-style: italic; font-weight: normal; text-decoration: none; font-size: 14pt; } div.maincontent .s24 { color: #212121; font-family:"Times New Roman", serif; font-style: normal; font-weight: normal; tex -
 Environmental impact assessment of Thanh Minh industrial cluster infrastructure investment project, Phu Tho town, Phu Tho Province - 2
 -
 Assessment of the Impact of Land Acquisition on Employment and Multi-Employability of People
 -
 General Comments and Assessment of Basic Conditions of the Study Area
 -
 Group of Research Projects on Assessment of Geographical Conditions and Tourism Resources
Comment: The results from the table above show that: the crew's food rations have higher energy value than the energy standards for heavy laborers in Vietnam. But the energy ratio between food and foodstuffs is not balanced (Lipid and Protein are high, but Glucid is low).
3.2. HEALTH STATUS AND ILLNESS STRUCTURE OF SEAFAR TRANSPORT SEAFAR ...
3.2.1. Some physical indicators of ocean-going ship crew members
C
Table 3.12. Physical fitness index of crew members (n=600)
Result
Target
Ship crew ocean freight X SD | Work on mainland (n=300) X SD | p | |
Height (cm) | 166.92 ± 4.81 | 164.00 ± 5.04 | <0.05 |
Weight (kg) | 62.63 ± 7.81 | 53.32 ± 6.44 | <0.05 |
VNTB (cm) | 86.92 ± 2.25 | 83.01 ± 4.86 | <0.05 |
BMI index | 22.43 ± 2.48 | 19.81 ± 2.20 | <0.05 |
Comment: The research results in the table above show that the physical indicators of TVVTVD are higher than those of workers on land [38].
Crew ratio by BMI
14.34%
9.33%
Thin (BMI < 18.5)
10.83%
12.5%
53%
Normal (18.5 ≤
BMI < 22.9)
Overweight (BMI =
23)
Pre-obese (23 < BMI ≤ 24.9)
Obesity (BMI ≥ 25)
Figure 3.1. Classification of BMI index of crew members (n=600)
Comment: The results of BMI classification of crew members showed that the rate of overweight crew members was 12.50%, pre-obese was 10.83%, obese was 14.34%. The number of thin crew members accounted for only 9.33%.
3.2.2. Some functional indicators of ocean transport crew
3.2.2.1. Functions of the circulatory and respiratory systems of ocean-going crew members
Table 3.13. Characteristics of pulse rate and blood pressure of crew members (n=600)
Research criteria
Research results ( X SD ) | p | ||
Ship crew ocean freight | Work on mainland (n=300) | ||
Pulse (beats/minute) | 82.55 ± 9.54 | 76.22 ± 7.25 | <0.05 |
Ps (mmHg) | 127.87 ± 14.54 | 118.16 12.68 | <0.05 |
d (mmHg) | 80.22 ± 8.10 | 75.20 7.43 | <0.05 |
P
Comments: Research results show that pulse and blood pressure indicators
of seafarers are higher than that of workers on land.
Electrocardiographic characteristics of TVVTVD
31.67%
Normal ECG
68.33%
Electrocardiogram changes
Figure 3.2. Electrocardiographic characteristics of ocean-going ship crew (n=600)
Comment: The research results from Figure 3.2 show that the electrocardiogram ratio
The turnover of ocean-going crew members is up to 31.67%.
Table 3.14. Respiratory function of crew members (n=600)
Research criteria
Research results ( X SD ) | p | ||||
Ship crew ocean freight | Labor on the land consecutive (n=300) | ||||
VC (liter) | 3.52 ± 0.34 | 3.40 ± 0.34 | >0.05 | ||
FVC (liter) | 3.34 ± 0.32 | 3.20 ± 0.30 | >0.05 | ||
FEV1 (%) | 96.67 ± 8.11 | 93.54 ± 7.69 | >0.05 | ||
FEV1 /VC (% ) | 78.48 ± 5.21 | 77.37 ± 6.87 | >0.05 | ||
FEV1 / FVC (%) | 85.73 ± 7.73 | 79.38 ± 5.93 | <0.05 | ||
FEF 25-75 (%) | 83.95 ± 11.18 | 75.32 ± 7.31 | <0.05 | ||
dysfunction breathing: | Number of cases | Percentage | Number of cases | Percentage | |
- Respiratory restriction | 0 | 0 | 13 | 4.33 | |
respiratory obstruction | 0 | 0 | 0 | 0 | |
mixed segment | 0 | 0 | 0 | 0 | |
- Blockage
- Confused
Comment: The research results from the above table show that the communication function
The pulmonary ventilation of seafarers was within normal limits. No seafarers had respiratory dysfunction (according to the pulmonary ventilation function assessment table [140]). Only 4.33% of land workers had respiratory restriction syndrome.
3.2.2.2. Blood and urine tests
Table 3.15. Hematological characteristics of crew members (n=600)
Research criteria
Research results | p | ||
Ship crew ocean freight | Work on mainland(n=300) | ||
White blood cell count (G/L) | 7.97 1.94 | 7.50 ± 1.40 | > 0.05 |
Red blood cell count (T/L) | 4.69 ± 0.52 | 4.24 1.09 | < 0.05 |
Hematocrit (l/L) | 0.43 ± 0.05 | 0.44 0.025 | > 0.05 |
Hemoglobin (mg/100ml) | 15.70 12.10 | 14.30 ± 0.70 | < 0.05 |
Platelet count (G/L) | 225.60 44.70 | 210.00 37.00 | < 0.05 |
H
Comment : The research results from the table above show that in the peripheral blood indicators of ocean-going crew members, the number of red blood cells, hemoglobin and platelets of crew members is slightly higher than that of workers on land.
9.33%
3.5%
Normal
Fasting glucose tolerance disorder
87.17%
Diabetes
Figure 3.3. Classification of blood sugar disorders in seafarers (n=600)
Comment: The study results showed that the average blood sugar level
The average blood glucose level of the crew members was within normal limits; the rate of crew members with impaired fasting glucose tolerance and diabetes was quite high (12.83%).
Table 3.16. Blood lipid status of crew members (n=600)
Research criteria
Research results ( X SD ) | p | ||
Ocean freight crew | Land labor (n=300) | ||
Cholesterol (mmol/L) | 5.77 ± 1.64 | 5.12 ± 0.78 | < 0.05 |
Triglyceride (mmol/L) | 3.17 ± 1.40 | 2.16 ± 0.53 | < 0.05 |
HDL-C (mmol/L) | 1.29 ± 0.17 | 1.19 ± 0.21 | < 0.05 |
LDL-C (mmol/L) | 3.94 ± 0.20 | 3.50 ± 0.41 | < 0.05 |
Comment: The research results from the table above show that the blood lipids of seafarers have higher HDL-C content than those of workers on land. The rate of seafarers with lipid disorders (Cholesterol > 5.2 and or triglyceride > 2.3) is 394/600 seafarers, accounting for 65.67%.
Table 3.17. Urine component indexes of crew members (n=600)
Research criteria
Number of changes (n) | Rate (%) | |
White blood cells | 52 | 8.67 |
Red blood cells | 62 | 10.33 |
Nitrite | 30 | 5.00 |
Protein | 40 | 6.67 |
Glucose | 22 | 3.67 |
Urobilinogen | 34 | 5.67 |
bin | 16 | 2.67 |
ng, pH | Within normal limits | |
Bilirubin
Rate of occupancy
Comment: The research results from the table above show that the density and pH
The crew's urine was within normal limits, the proportion of urine with
Red blood cells, white blood cells and protein account for 6.67 to 10.33%.
Table 3.18. Characteristics of some psychological indicators of crew members (n=600)
Research criteria
There is change mentality | No variables change mentality | |||
Number of cases | Proportion (%) | Number of cases | Proportion (%) | |
Worry about accidents and disasters | 536 | 89.33 | 64 | 10.67 |
Stress from noise, vibration, gasoline fumes | 542 | 90.33 | 58 | 9.67 |
The feeling of loneliness is tormenting | 394 | 65.67 | 206 | 34.33 |
Sexual emotional tension | 416 | 69.33 | 184 | 30.67 |
Harsh working environment at sea | 372 | 62.00 | 228 | 38.00 |
Economic burden | 330 | 55.00 | 270 | 45.00 |
Thinking too much about family | 334 | 55.66 | 266 | 44.34 |
Comments : The results of the table above show that the majority of crew members are worried about accidents and disasters (89.33%) and have nervous tension due to noise, vibration, and gasoline fumes in the environment (90.33%), followed by feelings of loneliness (65.67%), emotional and sexual tension (69.33%) and
burden
economic (55.00%).
3.2.3. Disease structure of ocean-going crew members
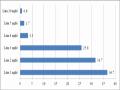
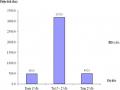
Table 3.19. General disease prevalence in seafarers (n=600)
Disease group name
Number of cases (n) | Rate (%) | |
Infections and parasites | 100 | 16.67 |
Tumors | 8 | 1.33 |
Blood and blood-forming organ diseases | 1 | 0.17 |
Endocrine and metabolic nutritional diseases | 415 | 69.17 |
Mental behavioral disorders | 134 | 22.33 |
Neurological and sensory organ diseases | 16 | 2.67 |
Eye disease | 147 | 24.5 |
Disease of the ear | 19 | 3.17 |
Diseases of the circulatory system | 206 | 34.33 |
Diseases of the respiratory system | 197 | 32.83 |
Diseases of the digestive system Including: Constipation | 354 122 | 59.00 20.33 |
Diseases of the urinary and reproductive systems | 74 | 12.33 |
Skin and subcutaneous system diseases | 19 | 3.17 |
Diseases of the musculoskeletal system and its tissues related functions | 2 | 0.33 |
Poisoning accidents and injuries other due to external causes | 3 | 0.5 |
often
nourish,
Comment: The research results in Table 3.19 show that the group of diseases found in sailors on ocean-going ships is endocrine and metabolic diseases with the highest rate (415 people with the disease, accounting for 69.17%); followed by
diseases of the digestive system, respiratory diseases, diseases of the circulatory system and infections-parasites.
Table 3.20. Disease incidence by occupational group in seafarers (n=600)
Disease group name
Deck Group (n=219) | Machine group (n=225) | Service group case (n=156) | ||||
Number of cases (n) | Rate (%) | Number of cases (n) | Rate (%) | Number of cases (n) | Rate (%) | |
Infections and parasites | 40 | 18.26 | 38 | 16.89 | 22 | 14.10 |
Nutritional disorders, endocrine, metabolism | 137 | 62.56 | 151 | 67.11 | 127 | 81.41 |
Behavioral disorders and mental | 84 | 38.36 | 34 | 15.11 | 16 | 10.26 |
Eye disease | 66 | 30.14 | 39 | 30.67 | 12 | 7.69 |
Disease of the ear | 2 | 0.91 | 14 | 6.22 | 3 | 1.92 |
Circulatory disease | 77 | 35.16 | 75 | 33.33 | 54 | 34.62 |
Respiratory disease | 67 | 31.16 | 78 | 34.67 | 52 | 33.33 |
Digestive system disease | 126 | 57.53 | 137 | 60.89 | 91 | 58.33 |
high
most endocrine
Comments : The research results from the table above show that: the incidence of endocrine disorders, nutritional and metabolic disorders; digestive system diseases; circulatory system diseases; respiratory system diseases; eye diseases in all three groups are higher, the service group has a higher incidence of nutritional disorders,
, highest metabolism, the group of ships with high digestive system diseases