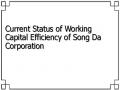
Chart 2.14: Fluctuations in other current assets items.
Unit: VND.
1,600,000,000
1,400,000,000
1,200,000,000
1,000,000,000
800,000,000
600,000,000
400,000,000
200,000,000
-
1,430,943,387
1,408,287,157
1,170,442,241
133,816,390
Deductible VAT
Taxes and government receivables
0
119,777,097
2011 2012 2013
(Source: Accounting Department).
The company's other current assets mainly consist of two main items: deductible VAT and Taxes and receivables from the state. The fluctuations of the two items are as follows:
In 2011, the company's deductible VAT was VND 1,430,943,387, accounting for 100% of the total value of other fixed assets.
In 2012, deductible VAT decreased by 18.20% compared to 2011 to VND 1,170,442,241, accounting for 89.74% of the total value of other fixed assets. In this year, a new item appeared, which is taxes and receivables from the state, with a value of VND 133,816,390, accounting for 10.26% of the total value of fixed assets.
In 2013, the company's VAT was VND 1,408,287,157, an increase of 20.32% compared to 2012 and accounted for 92.16% of the total value of other working assets. Taxes and receivables from the state decreased by 10.49% compared to 2012 to VND 119,777,097, accounting for 7.84% of the total value of other working assets.
The amount of corporate income tax that the company must pay to the state is always less than the amount of tax the company has provisionally paid, so the remaining amount is entered by the company into code 152 "taxes and receivables from the state" on the balance sheet for tracking.
The company's other current assets are increasing, although not significantly, but the company needs to manage the value of other current assets more closely to avoid excessive increases. Reduce the amount of deductible VAT by increasing revenue further, promoting sales, avoiding excess and waste of capital.
2.2.2. Analysis of the efficiency of working capital use at the company.
2.2.2.1. General analysis of working capital efficiency.
In the production and business process, working capital is constantly operating, it is a part with a fast circulation speed. The circulation speed of working capital is an indicator reflecting the overall quality, level of business management and corporate finance. Accelerating the circulation speed of working capital contributes to solving the capital needs of the unit, improving the efficiency of capital use.
The efficiency of the company's working capital use is shown in the following summary table:
71
Graduation thesis Associate Professor, Dr. Phan Dinh Nguyen
Table 2.15. Working capital turnover situation.
Unit: VND.
Target
2011 | 2012 | 2013 | Difference | ||||
2012/2011 | 2013/2012 | ||||||
Relative | Absolute (%) | Relative | Absolute (%) | ||||
1. Net revenue. | 35,253,421,588 | 47,278,474,643 | 69,088,638,800 | 12,025,053,055 | 34.11 | 21.810.164.157 | 46.13 |
2. Average working capital. | 12,063,432,083 | 15.175.240.139 | 25,276,437,125 | 3.111.808.056 | 25.80 | 10.101.196.986 | 66.56 |
3. Working capital turnover | 2.92 | 3.12 | 2.73 | 0.19 | 6.61 | (0.38) | (12.27) |
4. Number of days for capital turnover mobile. | 123.19 | 115.55 | 131.71 | (7.64) | (6.20) | 16.16 | 13.98 |
5. Working capital coverage ratio. | 0.34 | 0.32 | 0.37 | ( 0.02) | (6.20) | 0.04 | 13.98 |
Maybe you are interested!
-

 Working Capital Turnover Analysis
 -
 Analysis of capital efficiency at Kinh Do Northern Food Processing Joint Stock Company - 13
 -
 Factors Affecting the Efficiency of Working Capital Use in Enterprises
 -
 Current Status of Working Capital Efficiency of Song Da Corporation
 -
 Solutions for tourism development in Tien Lang - 10
zt2i3t4l5ee
zt2a3gstourism, tourism development
zt2a3ge
zc2o3n4t5e6n7ts
- District People's Committees and authorities of communes with tourist attractions should support, promote, and provide necessary information to people, helping them improve their knowledge about tourism. Raise tourism awareness for local people.
*
* *
Due to limited knowledge and research time, the thesis inevitably has shortcomings. Therefore, I look forward to receiving guidance from teachers, experts as well as your comments to make the thesis more complete.
Chapter III Conclusion
Through the issues presented in Chapter II, we can come to some conclusions:
Based on the strengths of available tourism resources, the types of tourism in Tien Lang that need to be promoted in the coming time are sightseeing and resort tourism, discovery tourism, weekend tourism. To improve the quality and diversify tourism products, Tien Lang district needs to combine with local cultural tourism resources, at the same time combine with surrounding areas, build rich tourism products. The strengths of Tien Lang tourism are eco-tourism and cultural tourism, so developing Tien Lang tourism must always go hand in hand with restoring and preserving types of cultural tourism resources. Some necessary measures to support and improve the efficiency of exploiting tourism resources in Tien Lang are: strengthening the construction of technical facilities and labor force serving tourism, actively promoting and advertising tourism, and expanding forms of capital mobilization for tourism development.
CONCLUDE
I Conclusion
1. Based on the results achieved within the framework of the thesis's needs, some basic conclusions can be drawn as follows:
Tien Lang is a locality with great potential for tourism development. The relatively abundant cultural tourism resources and ecological tourism resources have great appeal to tourists. Based on this potential, Tien Lang can build a unique tourism industry that is competitive enough with other localities within Hai Phong city and neighboring areas.
In recent years, the exploitation of the advantages of resources to develop tourism and build tourist routes in Tien Lang has not been commensurate with the available potential. In terms of quantity, many resource objects have not been brought into the purpose of tourism development. In terms of time, the regular service time has not been extended to attract more visitors. Infrastructure and technical facilities are still weak. The labor force is still thin and weak in terms of expertise. Tourism programs and routes have not been organized properly, the exploitation content is still monotonous, so it has not attracted many visitors. Although resources have not been mobilized much for tourism development, they are facing the risk of destruction and degradation.
2. Based on the results of investigation, analysis, synthesis, evaluation and selective absorption of research results of related topics, the thesis has proposed a number of necessary solutions to improve the efficiency of exploiting tourism resources in Tien Lang such as: promoting the restoration and conservation of tourism resources, focusing on investment and key exploitation of ecotourism resources, strengthening the construction of infrastructure and tourism workforce. Expanding forms of capital mobilization. In addition, the thesis has built a number of tourist routes of Hai Phong in which Tien Lang tourism resources play an important role.
Exploiting Tien Lang tourism resources for tourism development is currently facing many difficulties. The above measures, if applied synchronously, will likely bring new prospects for the local tourism industry, contributing to making Tien Lang tourism an important economic sector in the district's economic structure.
REFERENCES
1. Nhuan Ha, Trinh Minh Hien, Tran Phuong, Hai Phong - Historical and cultural relics, Hai Phong Publishing House, 1993
2. Hai Phong City History Council, Hai Phong Gazetteer, Hai Phong Publishing House, 1990.
3. Hai Phong City History Council, History of Tien Lang District Party Committee, Hai Phong Publishing House, 1990.
4. Hai Phong City History Council, University of Social Sciences and Humanities, VNU, Hai Phong Place Names Encyclopedia, Hai Phong Publishing House. 2001.
5. Law on Cultural Heritage and documents guiding its implementation, National Political Publishing House, Hanoi, 2003.
6. Tran Duc Thanh, Lecture on Tourism Geography, Faculty of Tourism, University of Social Sciences and Humanities, VNU, 2006
7. Hai Phong Center for Social Sciences and Humanities, Some typical cultural heritages of Hai Phong, Hai Phong Publishing House, 2001
8. Nguyen Ngoc Thao (editor-in-chief, Tourism Geography, Hai Phong Publishing House, two volumes (2001-2002)
9. Nguyen Minh Tue and group of authors, Hai Phong Tourism Geography, Ho Chi Minh City Publishing House, 1997.
10. Nguyen Thanh Son, Hai Phong Tourism Territory Organization, Associate Doctoral Thesis in Geological Geography, Hanoi, 1996.
11. Decision No. 2033/QD – UB on detailed planning of Tien Lang town, Hai Phong city until 2020.
12. Department of Culture, Information, Hai Phong Museum, Hai Phong relics
- National ranked scenic spot, Hai Phong Publishing House, 2005. 13. Tien Lang District People's Committee, Economic Development Planning -
Culture - Society of Tien Lang district to 2010.
14.Website www.HaiPhong.gov.vn
APPENDIX 1
List of national ranked monuments
STT
Name of the monument
Number, year of decisiondetermine
Location
1
Gam Temple
938 VH/QĐ04/08/1992
Cam Khe Village- Toan Thang commune
2
Doc Hau Temple
9381 VH/QĐ04/08/1992
Doc Hau Village –Toan Thang commune
3
Cuu Doi Communal House
3207 VH/QĐDecember 30, 1991
Zone II of townTien Lang
4
Ha Dai Temple
938 VH/QĐ04/08/1992
Ha Dai Village –Tien Thanh commune
APPENDIX II
STT
Name of the monument
Number, year of decision
Location
1
Phu Ke Pagoda Temple
178/QD-UBJanuary 28, 2005
Zone 1 - townTien Lang
2
Trung Lang Temple
178/QD-UBJanuary 28, 2005
Zone 4 – townTien Lang
3
Bao Khanh Pagoda
1900/QD-UBAugust 24, 2006
Nam Tu Village -Kien Thiet commune
4
Bach Da Pagoda
1792/QD-UB11/11/2002
Hung Thang Commune
5
Ngoc Dong Temple
177/QD-UBNovember 27, 2005
Tien Thanh Commune
6
Tomb of Minister TSNhu Van Lan
2848/QD-UBSeptember 19, 2003
Nam Tu Village -Kien Thiet commune
7
Canh Son Stone Temple
2160/QD-UBSeptember 19, 2003
Van Doi Commune –Doan Lap
8
Meiji Temple
2259/QD-UBSeptember 19, 2002
Toan Thang Commune
9
Tien Doi Noi Temple
477/QD-UBSeptember 19, 2005
Doan Lap Commune
10
Tu Doi Temple
177/QD-UBJanuary 28, 2005
Doan Lap Commune
11
Duyen Lao Temple
177/QD-UBJanuary 28, 2005
Tien Minh Commune
12
Dinh Xuan Uc Pagoda
177/QD-UBJanuary 28, 2005
Bac Hung Commune
13
Chu Khe Pagoda
177/QD-UBJanuary 28, 2005
Hung Thang Commune
14
Dong Dinh
2848/QD-UBNovember 21, 2002
Vinh Quang Commune
15
President's Memorial HouseTon Duc Thang
177/QD-UBJanuary 28, 2005
NT Quy Cao
Ha Dai Temple
Ben Vua Temple
Tien Lang hot spring
div.maincontent .p { color: black; font-family:"Times New Roman", serif; font-style: normal; font-weight: normal; text-decoration: none; font-size: 14pt; margin:0pt; } div.maincontent p { color: black; font-family:"Times New Roman", serif; font-style: normal; font-weight: normal; text-decoration: none; font-size: 14pt; margin:0pt; } div.maincontent .s1 { color: black; font-family:"Times New Roman", serif; font-style: normal; font-weight: normal; font-size: 16pt; } div.maincontent .s2 { color: black; font-family:"Times New Roman", serif; font-style: italic; font-weight: bold; text-decoration: none; font-size: 14pt; } div.maincontent .s3 { color: black; font-family:"Times New Roman", serif; font-style: italic; font-weight: normal; text-decoration: none; font-size: 14pt; } div.maincontent .s4 { color: black; font-family:"Times New Roman", serif; font-style: normal; font-weight: normal; font-size: 14pt; } div.maincontent .s5 { color: black; font-family:"Times New Roman", serif; font-style: normal; font-weight: bold; font-size: 14pt; } div.maincontent .s6 { color: black; font-family:"Times New Roman", serif; font-style: normal; font-weight: normal; text-decoration: none; font-size: 14pt; } div.maincontent .s7 { color: black; font-family:"Times New Roman", serif; font-style: normal; font-weight: bold; text-decoration: none; font-size: 14pt; } div.maincontent .s8 { color: black; font-family:"Times New Roman", serif; font-style: normal; font-weight: normal; text-decoration: none; font-size: 9pt; vertical-align: 6pt; } div.maincontent .s9 { color: black; font-family:"Times New Roman", serif; font-style: normal; font-weight: bold; text-decoration: none; font-size: 12pt; } div.maincontent .s11 { color: black; font-family:"Times New Roman", serif; font-style: normal; font-weight: normal; tex
Solutions for tourism development in Tien Lang - 10
zt2i3t4l5ee
zt2a3gstourism, tourism development
zt2a3ge
zc2o3n4t5e6n7ts
- District People's Committees and authorities of communes with tourist attractions should support, promote, and provide necessary information to people, helping them improve their knowledge about tourism. Raise tourism awareness for local people.
*
* *
Due to limited knowledge and research time, the thesis inevitably has shortcomings. Therefore, I look forward to receiving guidance from teachers, experts as well as your comments to make the thesis more complete.
Chapter III Conclusion
Through the issues presented in Chapter II, we can come to some conclusions:
Based on the strengths of available tourism resources, the types of tourism in Tien Lang that need to be promoted in the coming time are sightseeing and resort tourism, discovery tourism, weekend tourism. To improve the quality and diversify tourism products, Tien Lang district needs to combine with local cultural tourism resources, at the same time combine with surrounding areas, build rich tourism products. The strengths of Tien Lang tourism are eco-tourism and cultural tourism, so developing Tien Lang tourism must always go hand in hand with restoring and preserving types of cultural tourism resources. Some necessary measures to support and improve the efficiency of exploiting tourism resources in Tien Lang are: strengthening the construction of technical facilities and labor force serving tourism, actively promoting and advertising tourism, and expanding forms of capital mobilization for tourism development.
CONCLUDE
I Conclusion
1. Based on the results achieved within the framework of the thesis's needs, some basic conclusions can be drawn as follows:
Tien Lang is a locality with great potential for tourism development. The relatively abundant cultural tourism resources and ecological tourism resources have great appeal to tourists. Based on this potential, Tien Lang can build a unique tourism industry that is competitive enough with other localities within Hai Phong city and neighboring areas.
In recent years, the exploitation of the advantages of resources to develop tourism and build tourist routes in Tien Lang has not been commensurate with the available potential. In terms of quantity, many resource objects have not been brought into the purpose of tourism development. In terms of time, the regular service time has not been extended to attract more visitors. Infrastructure and technical facilities are still weak. The labor force is still thin and weak in terms of expertise. Tourism programs and routes have not been organized properly, the exploitation content is still monotonous, so it has not attracted many visitors. Although resources have not been mobilized much for tourism development, they are facing the risk of destruction and degradation.
2. Based on the results of investigation, analysis, synthesis, evaluation and selective absorption of research results of related topics, the thesis has proposed a number of necessary solutions to improve the efficiency of exploiting tourism resources in Tien Lang such as: promoting the restoration and conservation of tourism resources, focusing on investment and key exploitation of ecotourism resources, strengthening the construction of infrastructure and tourism workforce. Expanding forms of capital mobilization. In addition, the thesis has built a number of tourist routes of Hai Phong in which Tien Lang tourism resources play an important role.
Exploiting Tien Lang tourism resources for tourism development is currently facing many difficulties. The above measures, if applied synchronously, will likely bring new prospects for the local tourism industry, contributing to making Tien Lang tourism an important economic sector in the district's economic structure.
REFERENCES
1. Nhuan Ha, Trinh Minh Hien, Tran Phuong, Hai Phong - Historical and cultural relics, Hai Phong Publishing House, 1993
2. Hai Phong City History Council, Hai Phong Gazetteer, Hai Phong Publishing House, 1990.
3. Hai Phong City History Council, History of Tien Lang District Party Committee, Hai Phong Publishing House, 1990.
4. Hai Phong City History Council, University of Social Sciences and Humanities, VNU, Hai Phong Place Names Encyclopedia, Hai Phong Publishing House. 2001.
5. Law on Cultural Heritage and documents guiding its implementation, National Political Publishing House, Hanoi, 2003.
6. Tran Duc Thanh, Lecture on Tourism Geography, Faculty of Tourism, University of Social Sciences and Humanities, VNU, 2006
7. Hai Phong Center for Social Sciences and Humanities, Some typical cultural heritages of Hai Phong, Hai Phong Publishing House, 2001
8. Nguyen Ngoc Thao (editor-in-chief, Tourism Geography, Hai Phong Publishing House, two volumes (2001-2002)
9. Nguyen Minh Tue and group of authors, Hai Phong Tourism Geography, Ho Chi Minh City Publishing House, 1997.
10. Nguyen Thanh Son, Hai Phong Tourism Territory Organization, Associate Doctoral Thesis in Geological Geography, Hanoi, 1996.
11. Decision No. 2033/QD – UB on detailed planning of Tien Lang town, Hai Phong city until 2020.
12. Department of Culture, Information, Hai Phong Museum, Hai Phong relics
- National ranked scenic spot, Hai Phong Publishing House, 2005. 13. Tien Lang District People's Committee, Economic Development Planning -
Culture - Society of Tien Lang district to 2010.
14.Website www.HaiPhong.gov.vn
APPENDIX 1
List of national ranked monuments
STT
Name of the monument
Number, year of decisiondetermine
Location
1
Gam Temple
938 VH/QĐ04/08/1992
Cam Khe Village- Toan Thang commune
2
Doc Hau Temple
9381 VH/QĐ04/08/1992
Doc Hau Village –Toan Thang commune
3
Cuu Doi Communal House
3207 VH/QĐDecember 30, 1991
Zone II of townTien Lang
4
Ha Dai Temple
938 VH/QĐ04/08/1992
Ha Dai Village –Tien Thanh commune
APPENDIX II
STT
Name of the monument
Number, year of decision
Location
1
Phu Ke Pagoda Temple
178/QD-UBJanuary 28, 2005
Zone 1 - townTien Lang
2
Trung Lang Temple
178/QD-UBJanuary 28, 2005
Zone 4 – townTien Lang
3
Bao Khanh Pagoda
1900/QD-UBAugust 24, 2006
Nam Tu Village -Kien Thiet commune
4
Bach Da Pagoda
1792/QD-UB11/11/2002
Hung Thang Commune
5
Ngoc Dong Temple
177/QD-UBNovember 27, 2005
Tien Thanh Commune
6
Tomb of Minister TSNhu Van Lan
2848/QD-UBSeptember 19, 2003
Nam Tu Village -Kien Thiet commune
7
Canh Son Stone Temple
2160/QD-UBSeptember 19, 2003
Van Doi Commune –Doan Lap
8
Meiji Temple
2259/QD-UBSeptember 19, 2002
Toan Thang Commune
9
Tien Doi Noi Temple
477/QD-UBSeptember 19, 2005
Doan Lap Commune
10
Tu Doi Temple
177/QD-UBJanuary 28, 2005
Doan Lap Commune
11
Duyen Lao Temple
177/QD-UBJanuary 28, 2005
Tien Minh Commune
12
Dinh Xuan Uc Pagoda
177/QD-UBJanuary 28, 2005
Bac Hung Commune
13
Chu Khe Pagoda
177/QD-UBJanuary 28, 2005
Hung Thang Commune
14
Dong Dinh
2848/QD-UBNovember 21, 2002
Vinh Quang Commune
15
President's Memorial HouseTon Duc Thang
177/QD-UBJanuary 28, 2005
NT Quy Cao
Ha Dai Temple
Ben Vua Temple
Tien Lang hot spring
div.maincontent .p { color: black; font-family:"Times New Roman", serif; font-style: normal; font-weight: normal; text-decoration: none; font-size: 14pt; margin:0pt; } div.maincontent p { color: black; font-family:"Times New Roman", serif; font-style: normal; font-weight: normal; text-decoration: none; font-size: 14pt; margin:0pt; } div.maincontent .s1 { color: black; font-family:"Times New Roman", serif; font-style: normal; font-weight: normal; font-size: 16pt; } div.maincontent .s2 { color: black; font-family:"Times New Roman", serif; font-style: italic; font-weight: bold; text-decoration: none; font-size: 14pt; } div.maincontent .s3 { color: black; font-family:"Times New Roman", serif; font-style: italic; font-weight: normal; text-decoration: none; font-size: 14pt; } div.maincontent .s4 { color: black; font-family:"Times New Roman", serif; font-style: normal; font-weight: normal; font-size: 14pt; } div.maincontent .s5 { color: black; font-family:"Times New Roman", serif; font-style: normal; font-weight: bold; font-size: 14pt; } div.maincontent .s6 { color: black; font-family:"Times New Roman", serif; font-style: normal; font-weight: normal; text-decoration: none; font-size: 14pt; } div.maincontent .s7 { color: black; font-family:"Times New Roman", serif; font-style: normal; font-weight: bold; text-decoration: none; font-size: 14pt; } div.maincontent .s8 { color: black; font-family:"Times New Roman", serif; font-style: normal; font-weight: normal; text-decoration: none; font-size: 9pt; vertical-align: 6pt; } div.maincontent .s9 { color: black; font-family:"Times New Roman", serif; font-style: normal; font-weight: bold; text-decoration: none; font-size: 12pt; } div.maincontent .s11 { color: black; font-family:"Times New Roman", serif; font-style: normal; font-weight: normal; tex

(Source: Accounting Department).
72
Changes in net revenue and working capital value affect average working capital turnover and working capital turnover ratio.
Through table 2.15, we can see that net revenue and working capital value increase over the years, however, with different growth rates, the number of working capital turnovers as well as the working capital turnover ratio fluctuate erratically. That erraticity is shown through the following charts:
Chart 2.15: Fluctuations in net revenue and average working capital.
Unit: VND.
80,000,000,000
69,088,638,800
60,000,000,000
40,000,000,000
47,278,474,643
35,253,421,888
Revenue
20,000,000,000
-
25,276,437,125
15.175.240.139
12,036,432,083
TSLD
average
2011 2012 2013
(Source: Accounting Department).
Chart 2.16. Average number of working capital cycles.
3.2
3
2.8
2.6
2.4
3.12
2.92
2.73
Year Year Year 2011 2012 2013
Number of VLD revolutions
average
Unit: Rounds/year.
(Source: Accounting Department).
Through table 2.15 and two charts, we can see: In 2011, the company's net revenue was 35,253,421,588 VND, the average working capital was 12,063,342,083 VND. The average number of working capital turnovers was 2.92 times/year, with each turnover taking 123.19 days. The working capital turnover ratio was 0.34, meaning that to generate 1 VND of net revenue, the company lost 0.34 VND of working capital.
In 2012, net revenue increased by 34.11% compared to 2011 to VND 47,278,474,643, while average working capital increased by 25.80% compared to 2011. This made the average number of working capital turnovers this year to be 3.12, an increase of 0.19 compared to 2011. The average number of working capital turnovers decreased by 7.64 days to 115.55 days/turn. In this year, to create one dong of net revenue, the company only spent 0.32 dong of working capital, a decrease of 0.02 dong compared to 2011. The increase in the number of days per average working capital turnover and the decrease in the working capital utilization ratio showed that the company used working capital better than in 2011. At the same time, it also helped the company save capital. The amount of saved capital is calculated according to the following formula:
Number of days per round
average rotation
-
∆V=
Business
collect
net year n+1
x
year n+1
Number of days per round
average turnover of year n
360
In 2012, the company saved the following capital:
∆V= 47,278,474,643 x
115.55
- 123.19
= (1,003,354,295) VND
360
Rapid turnover of working capital not only saves capital but also increases the ability to generate money and increase profits for the company.
In 2013, although the net revenue rate increased by 46.13% compared to 2012, the excessive increase in working capital caused the working capital turnover to decrease by 0.38 times, lower than in 2011. The average working capital turnover was 2.73 times/year, the number of days
One rotation increased by 13.98 days compared to 2012 to 131.71 days/rotation. The responsibility ratio increased to 0.37.
With the situation in 2013, the company's management and use of working capital is gradually losing efficiency. Therefore, the company needs to have measures to improve and take advantage of this asset source. On the other hand, the company needs to always seek and expand the consumption market to contribute to accelerating sales, and at the same time have better inventory management and sales credit policies to improve the efficiency of asset use in the unit.
2.2.2.2. Working capital return ratio.
Managers are not only interested in the ability to convert current assets into cash and the turnover rate of those assets, but also aim for the long term, such as evaluating the profitability of the enterprise. This is a basic factor that shows the ability to pay of the enterprise. The ultimate goal of production and business activities is profit. The higher the profit, the more the enterprise affirms its existence in the market. If we only look at the high or low business performance results to evaluate the good or bad performance of the enterprise, it is not accurate. Therefore, to more accurately evaluate the performance of the enterprise, we use the profitability index of working capital. This index of Jadeluck Company Limited is shown in the following table:
75
Graduation thesis Associate Professor, Dr. Phan Dinh Nguyen
Table 2.16: Profitability of working capital
Unit: VND.
Target
2011 | 2012 | 2013 | Difference | ||||
2012/2011 | 2013/2012 | ||||||
Relative | Great opposite to (%) | Relative | Great opposite to (%) | ||||
1. Profit after tax | 2,605,864,255 | (2,021,371,927) | (575,636,017) | (4,627,236,182) | (177.57) | 1,445,735,910 | (71.52) |
2. Value of working capital average | 12,063,432,083 | 15.175.240.139 | 25,276,437,125 | 3.111.808.056 | 25.80 | 10.101.196.986 | 66.56 |
3. Profitability of short-term capital limit (%) | 21.60 | (13.32) | (2.28) | (34.92) | ( 161.66) | 11.04 | (82.90) |
(Source: Accounting Department).
76
Through table 2.16 we can see that two factors directly affect short-term capital profitability including after-tax profit and average working capital value.
The higher the profit of the company, the better. However, the company's profit has been decreasing over the years and is in a bad situation. The company is in a state of loss-making business, showing:
In 2011, the company's after-tax profit was VND 2,605,864,255. A garment company with such profit is quite good.
In 2012, the company's after-tax profit decreased and lost an amount almost equivalent to the profit in 2011, a loss of VND 2,021,371,927. Business activities were assessed as poor and ineffective.
In 2013, despite measures to improve sales and minimize costs, the company's profit was still negative 575,636,017 VND. Although not low, this still shows ineffective operations.
Decreased and negative corporate profits negatively impact the profitability of working capital. To see this, look at the following chart:
25
20
15
10
5
0
-5
-10
-15
-20
21.60
2011
2012
-2.28
2013
Short-term TS profitability
-13.32
Chart 2.17: Profitability of working capital.
(Source: Accounting Department).
Through the chart we see that short-term asset profitability, also known as working capital profitability, fluctuates erratically and is in an unfavorable state.
In 2011, every 100 dong of current assets generated 21.60 dong of profit. The company uses current assets very well.
In 2012 and 2013, because the company's profit was negative, the profitability of short-term assets was also negative.