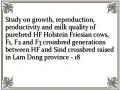
0.66kg. After 24 months of raising, the weight of the cow groups reached: 352.50
± 1.38kg, 370.71 ± 1.19kg, 402.45 ± 1.34kg and 423.55 ± 1.14kg. Mass gain
The average absolute weight gain during 24 months of rearing was respectively: 448.65g, 472.03g, 511.94g and 539.03g/day. Thus, the highest absolute weight gain was achieved in HF cows and the lowest in F1 cows , in order of decreasing HF blood ratio in crossbred animals.
The coefficient of variation of weight over the corresponding months of rearing in the groups of F 1 , F 2 , F 3 and HF cows at birth was: 8.10%, 7.52%, 7.59% and 6.61%, with a tendency to decrease after 24 months of age and reached respectively: 4.17%, 3.49%, 3.58% and 4.33%.
4 5 0
4 0 0
3 5 0
3 0 0
2 5 0
2 0 0
1 5 0
F 1
F 2
F 3
HF
1 0 0
5 0
0
SS
6
1 2
Last month
1 8
2 4
The weight of HF cows at different ages is always larger than that of crossbred cows. Statistical comparison shows that the weight of cows at different ages is significantly different (P < 0.05) and when the HF blood ratio increases, the weight of cows at different ages also increases. The change in weight of cows at different ages can be seen more clearly in Figure 3.1.
Weight (kg)
Figure 3.1. Cow weight by month of age
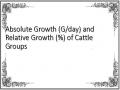
The results of absolute and relative growth of the monitored cow groups are presented in table 3.2; charts 3.1 and figure 3.3.
Table 3.2. Absolute growth (g/day) and relative growth (%) of cattle groups
statistics
Months old stage
Group
SS – 6 7 – 12 13 –18 19 – 24
Th.s | absolute | relative | absolute | relative | absolute | relative | absolute | relative |
558.58a | 125.92 | 456.79a | 47.80 | 413.09a | 29.98 | 366.19a | 20.64 | |
F 1 SE | 5.03 | 0.62 | 8.84 | 0.84 | 9.21 | 0.69 | 5.47 | 0.31 |
(n = 114) Cv% | 9.61 | 5.23 | 20.67 | 15.74 | 23.81 | 24.60 | 15.95 | 15.94 |
592.36 b | 126.53 | 479.79 b | 47.73 | 415.77a | 28.60 | 399.45 b | 21.62 | |
F 2 SE | 4.91 | 0.56 | 8.36 | 0.76 | 7.15 | 0.41 | 6.77 | 0.40 |
(n = 118) Cv% | 8.99 | 4.78 | 18.93 | 17.31 | 18.36 | 15.24 | 18.42 | 19.52 |
643.31 c | 126.14 | 518.69 c | 47.54 | 471.49b | 29.71 | 414.26 BC | 20.46 | |
F 3 SE | 4.15 | 0.53 | 5.47 | 0.45 | 7.37 | 0.44 | 5.86 | 0.31 |
(n = 116) Cv% | 6.88 | 4.54 | 11.35 | 10.27 | 16.85 | 16.02 | 15.24 | 16.37 |
681.15 d | 126.55 | 554.04 d | 47.94 | 490.49b | 29.33 | 430.40 c | 20.14 | |
HF SE | 3.71 | 0.35 | 5.09 | 0.41 | 4.68 | 0.30 | 5.02 | 0.23 |
(n = 257) Cv% | 8.73 | 4.44 | 14.72 | 13.60 | 15.29 | 16.54 | 18.69 | 18.32 |
Maybe you are interested!
-
 Absolute Growth (G/day) and Relative Growth (%) of Cattle Groups
 -
 Absolute growth rate of experimental chickens over weeks of age
 -
 Study on growth, reproduction, productivity and milk quality of purebred HF Holstein Friesian cows, F1, F2 and F3 crossbred generations between HF and Sind crossbred raised in Lam Dong province - 18
 -
![Pre-tax Profit of Bidv Tien Giang in the Period 2011-2015
zt2i3t4l5ee
zt2a3gsnon-credit services, joint stock commercial bank
zt2a3ge
zc2o3n4t5e6n7ts
At that time, the Branch had to set aside a provision for credit risks, which reduced the Branchs income.
Chart 2.2. Pre-tax profit of BIDV Tien Giang in the period 2011-2015
Unit: Billion VND
140
120
100
80
60
40
20
0
63.3
80.34
89.29
110.08
131.99
2011 2012 2013 2014 2015
Profit before tax
(Source: Report on the implementation of the annual business plan of the General Planning Department of BIDV Tien Giang [24])
However, through chart 2.2, it can be seen that BIDV Tien Giangs profit is still increasing continuously, and its operating efficiency is currently leaking. This is a contribution of non-credit services, and this service segment will be increasingly focused on growth by BIDV Tien Giang to ensure the highest profit safety because credit activities have many potential risks. At the same time, focusing on developing non-credit services is consistent with one of the contents of restructuring the financial activities of credit institutions in the project Restructuring the system of credit institutions in the period 2011-2015 approved by the Prime Minister in Decision No. 254/QD-TTg dated March 1, 2012 [14]: Gradually shifting the business model of commercial banks towards reducing dependence on credit activities and increasing income from non-credit services.
2.2. Current status of non-credit service development at BIDV Tien Giang.
2.2.1. BIDV Tien Giang has deployed the development of non-credit services in recent times.
Along with the development of the Head Office, BIDV Tien Giangs products and services are constantly improved and deployed in a diverse manner to ensure provision for many different customer groups in the area: individual customers, corporate customers, and financial institutions. Typical services are as follows: Payment services, treasury services, guarantee services, card services, trade finance, other services: Western Union, insurance commissions, consulting services, foreign exchange derivatives trading, e-banking services,...
2.2.1.1. Payment services:
In accordance with the Prime Ministers Project to promote non-cash payments in Vietnam [15], banks in Tien Giang province have continuously developed payment services to reduce customers cash usage habits through card services and electronic banking services such as: salary payment through accounts, focusing on developing card acceptance points, developing multi-purpose cards, paying social insurance by transfer, paying bills through banks, etc.
Chart 2.3. Net income from payment services in the period 2011-2015
Unit: Million VND
6000
5000
4000
3000
2000
1000
0
3922 4065
4720 5084 5324
2011 2012 2013 2014 2015
Net income from payment services
(Source: Report on the implementation of the annual business plan of the General Planning Department of BIDV Tien Giang [24])
Along with the technological development of the entire system, BIDV Tien Giang has a payment system with a fairly stable transaction processing speed, bringing many conveniences to customers. The results of observing chart 2.3 show that the income from payment services that the Branch has achieved has grown over the years but the speed is not high and the products are not outstanding compared to other banks. Domestic payment products such as: Online bill payment, electricity bills, water bills, insurance premiums, cable TV bills, telecommunications fees, airline tickets, etc. bring many conveniences to customers. Regarding international payment, this is an indispensable activity for foreign economic activities, BIDV Tien Giang is providing international payment methods for small enterprises producing agriculture, aquatic food and seafood that have credit relationships with banks in industrial parks in Tien Giang province such as: money transfer, collection, L/C payment.
2.2.1.2. Treasury services:
BIDV Tien Giang always focuses on ensuring treasury safety and currency security, always complies with legal regulations, and minimizes risks in operations such as: counting and collecting money from customers, receiving and delivering internal transactions, collecting from the State Bank (SBV) or other credit institutions, receiving ATM funds, bundling money, etc. BIDV Tien Giangs treasury service management department is always fully equipped with modern machinery and equipment such as: money transport vehicles, fire prevention tools, money counters, money detectors, magnifying glasses, etc. to ensure absolute safety in treasury operations, immediately identifying real and fake money and other risks that may affect people and assets of the bank and customers. In addition, implementing regulation 2480/QC dated October 28, 2008 between the State Bank of Tien Giang province and the Provincial Police on coordination in the fight against counterfeit money, in the 3-year review of implementation, BIDV Tien Giang discovered, seized and submitted to the State Bank of Tien Giang province 475 banknotes of various denominations and was commended by the Provincial Police and the State Bank of Tien Giang province [17].
Chart 2.4. Net income from treasury services in the period 2011-2015
Unit: Million VND
350
300
250
200
150
100
50
0
105 122
309 289 279
2011 2012 2013 2014 2015
Net income from treasury services
(Source: Report on the implementation of the annual business plan of the General Planning Department of BIDV Tien Giang [24])
However, as shown in Figure 2.4, income from treasury operations is not high and fluctuates. Specifically, in the period 2011-2013, net income increased and increased most sharply in 2013, then in the period 2013-2015, there was a downward trend. This fluctuation is due to the fact that fees collected from treasury services are often very low and can even be waived to attract customers to use other services.
2.2.1.3. Guarantee and trade finance services:
BIDV Tien Giang, thanks to the advantages of the province and the favorable location of the Branch, has continuously focused on developing income from guarantee services and trade finance.
Chart 2.5. Net income from guarantee and trade finance services in the period 2011-2015
Unit: Million VND
14000
12000
10000
8000
6000
4000
2000
0
5193 5695
2742 3420
8889
3992
11604 12206
5143 5312
2011 2012 2013 2014 2015
Net income from guarantee services Net income from Trade Finance
(Source: Report on the implementation of the annual business plan of the General Planning Department of BIDV Tien Giang [24])
Through chart 2.5, we can see that BIDV Tien Giangs income from guarantee services and trade finance has grown over the years. The reason is: Among BIDV Tien Giangs corporate customers, the construction industry is the industry with the highest proportion of customers after the trading industry, this is a group of customers with potential to develop guarantee services. The second group of customers is corporate customers in the fields of agricultural production, livestock and seafood processing with high import and export turnover in the area.
are the target of trade finance development. In addition, BIDV Tien Giang also focuses on continuously developing these customer groups to increase revenue for many other products and services in the future.
2.2.1.4. Card and POS services:
As a service that BIDV Tien Giang has recently developed strongly, it can be said that this is a very potential market and has the ability to develop even more strongly in the future. Card services with outstanding advantages such as fast payment time, wide payment range, quite safe, effective and suitable for the integration trend and the Project to promote non-cash payments in Vietnam. Cards have become a modern and popular payment tool. BIDV Tien Giang early identified that developing card services is to expand the market to people in society, create capital mobilized from card-opened accounts, contribute to diversifying banking activities, enhance the image of the bank, bring the BIDV Tien Giang brand to people as quickly and easily as possible. BIDV Tien Giang is currently providing card types such as: credit cards (BIDV MasterCard Platinum, BIDV Visa Gold Precious, BIDV Visa Manchester United, BIDV Visa Classic), international debit cards (BIDV Ready Card, BIDV Manu Debit Card), domestic debit cards (BIDV Harmony Card, BIDV eTrans Card, BIDV Moving Card, BIDV-Lingo Co-branded Card, BIDV-Co.opmart Co-branded Card). These cards can be paid via POS/EDC or on the ATM system. In addition, with debit cards, customers can not only withdraw money via ATMs but also perform utilities such as mobile top-up, online payment, money transfer,... through electronic banking services.
In order to attract customers with card services, BIDV Tien Giang has continuously increased the installation of ATMs. As of December 31, 2015, BIDV Tien Giang has 23 ATMs combined with 7 ATMs in the same system of BIDV My Tho, so the number of ATMs is quite large, especially in the center of My Tho City, but is not yet fully present in the districts. Basic services on ATMs such as withdrawing money, checking balances, printing short statements,... BIDV ATMs accept cards from banks in the system.
Banknetvn and Smartlink, cards branded by international card organizations Union Pay (CUP), VISA, MasterCard and cards of banks in the Asian Payment Network. From here, cardholders can make bill payments for themselves or others at ATMs, by simply entering the subscriber number or customer code, booking code that service providers notify and make bill payments.
Chart 2.6. Net income from card services in the period 2011-2015
Unit: Million VND
3500
3000
2500
2000
1500
1000
500
0
687
1023
1547
2267
3104
2011 2012 2013 2014 2015
Net income from card services
(Source: Report on the implementation of the annual business plan of the General Planning Department of BIDV Tien Giang [24])
Through chart 2.6, it can be seen that BIDV Tien Giangs card service income is constantly growing because the Branch focuses on developing businesses operating in industrial parks, which are the source of customers for salary payment products, ATMs, BSMS. Specifically, there are companies such as Freeview, Quang Viet, Dai Thanh, which are businesses with a large number of card openings at the Branch, contributing to the increase in card service fees [25].
Table 2.6. Number of ATMs and POS machines in 2015 of some banks in Tien Giang area.
Unit: Machine
STT
Bank name
Number of ATMs
Cumulative number of ATM cards
POS machine
1
BIDV Tien Giang
23
97,095
22
2
BIDV My Tho
7
21,325
0
3
Agribank Tien Giang
29
115,743
77
4
Vietinbank Tien Giang
16
100,052
54
5
Dong A Tien Giang
26
97,536
11
6
Sacombank Tien Giang
24
88,513
27
7
Vietcombank Tien Giang
15
61,607
96
8
Vietinbank - Tay Tien Giang Branch
6
46,042
38
(Source: 2015 Banking Activity Data Report of the General and Internal Control Department of the Provincial State Bank [21])
Through table 2.6, the author finds that the number of ATMs of BIDV Tien Giang is not much, ranking fourth after Agribank Tien Giang, Dong A Tien Giang, Sacombank Tien Giang. The number of POS machines of BIDV Tien Giang is very small, only higher than Dong A Tien Giang and BIDV My Tho in the initial stages of merging the BIDV system. Besides, BIDV Tien Giang has a high number of cards increasing over the years (table 2.7) but the cumulative number of cards issued up to December 31, 2015 is still relatively low compared to Agribank, Vietcombank, Dong A (table 2.6).
div.maincontent .content_head3 { color: black; font-family:Times New Roman, serif; font-style: normal; font-weight: bold; text-decoration: none; font-size: 14pt; }
div.maincontent .p { color: black; font-family:Times New Roman, serif; font-style: normal; font-weight: normal; text-decoration: none; font-size: 14pt; margin:0pt; }
div.maincontent p { color: black; font-family:Times New Roman, serif; font-style: normal; font-weight: normal; text-decoration: none; font-size: 14pt; margin:0pt; }
div.maincontent .s1 { color: black; font-family:Courier New, monospace; font-style: normal; font-weight: normal; text-decoration: none; font-size: 14pt; }
div.maincontent .s2 { color: black; font-family:Times New Roman, serif; font-style: italic; font-weight: normal; text-decoration: none; font-size: 13pt; }
div.maincontent .s3 { color: black; font-family:Times New Roman, serif; font-style: italic; font-weight: bold; text-decoration: none; font-size: 14pt; }
div.maincontent .s4 { color: black; font-family:Times New Roman, serif; font-style: italic; font-weight: normal; text-decoration: none; font-size: 14pt; }
div.maincontent .s5 { color: black; font-family:Times New Roman, serif; font-style: normal; font-weight: normal; text-decoration: none; font-size: 14pt; }
div.maincontent .s6 { color: black; font-family:Times New Roman, serif; font-style: normal; font-weight: bold; text-decoration: none; font-size: 14pt; }
div.maincontent .s7 { color: black; font-family:Times New Roman, serif; font-style: normal; font-weight: normal; text-decoration: none; font-size: 13.5pt; }
div.maincontent .s8 { color: black; font-family:Arial, sans-serif; font-style: normal; font-weight: normal; text-decoration: none; font-size: 9pt; }
div.maincontent .s9 { color: black; font-family:Arial, sans-serif; font-style: normal; font-weight: normal; text-decoration: none; font-size: 9pt; vertical-align: -2pt; }
div.maincontent .s10 { color: black; font-family:Arial, sans-serif; font-style: normal; font-weight: normal; text-decoration: none; font-size: 9pt; vertical-align: 5pt; }
div.maincontent .s11 { color: black; font-family:Arial, sans-serif; font-style: normal; font-weight: normal; text-decoration: none; font-size: 9pt; vertical-align: -5pt; }
div.maincontent .s12 { color: black; font-family:Arial, sans-serif; font-style: normal; font-weight: normal; text-decoration: none; font-size: 9pt; vertical-align: -3pt; }
div.maincontent .s13 { color: black; font-family:Arial, sans-serif; font-style: normal; font-weight: normal; text-decoration: none; font-size: 9pt; vertical-align: -4pt; }
div.maincontent .s14 { color: black; font-family:Arial, sans-serif; font-style: normal; font-weight: normal; text-decoration: none; font-size: 7.5pt; }
div.maincontent .s15 { color: black; font-family:Times New Roman, serif; font-style: italic; font-weight: normal; text-decoration: none; font-size: 14pt; }
div.maincontent .s16 { color: black; font-family:Arial, sans-serif; font-style: normal; font-weight: normal; text-decoration: none; font-size: 10.5pt; }
div.maincontent .s17 { color: black; font-family:Arial, sans-serif; font-style: normal; font-weight: normal; text-decoration: none; font-size: 9.5pt; }
div.maincontent .s18 { color: black; font-family:Arial, sans-serif; font-style: normal; font-weight: normal; text-decoration: none; font-size: 10.5pt; vertical-align: -1pt; }
div.maincontent .s19 { color: black; font-family:Arial, sans-serif; font-style: normal; font-weight: normal; text-decoration: none; font-size: 10.5pt; vertical-align: -5pt; }
div.maincontent .s20 { color: black; font-family:Arial, sans-serif; font-style: normal; font-weight: normal; text-decoration: none; font-size: 10.5pt; vertical-align: -2pt; }
div.maincontent .s21 { color: black; font-family:Arial, sans-serif; font-style: normal; font-weight: normal; text-decoration: none; font-size: 10pt; }
div.maincontent .s22 { color: black; font-family:Calibri, sans-serif; font-style: normal; font-weight: normal; text-decoration: none; font-size: 10.5pt; }
div.maincontent .s23 { color: black; font-family:Calibri, sans-serif; font-style: normal; font-weight: normal; text-decoration: none; font-size: 10.5pt; vertical-align: -3pt; }
div.maincontent .s24 { color: black; font-family:Calibri, sans-serif; font-style: normal; font-weight: normal; text-decoration: none; font-size: 10.5pt; vertical-align: -5pt; }
div.maincontent .s25 { color: black; font-family:Times New Roman, serif; font-style: normal; font-weight: normal; text-decoration: none; font-size: 10.5pt; }
div.maincontent .s26 { color: black; font-family:Calibri, sans-serif; font-style: normal; font-weight: normal; text-decoration: none; font-size: 10.5pt; vertical-align: -4pt; }
div.maincontent .s27 { color: black; font-family:Calibri, sans-serif; font-style: normal; font-weight: normal; text-decoration: none; font-size: 10.5pt; vertical-align: -6pt; }
div.maincontent .s28 { color: black; font-family:Calibri, sans-serif; font-style: normal; font-weight: normal; text-decoration: none; font-size: 10.5pt; vertical-align: -1pt; }
div.maincontent .s29 { color: black; font-family:Calibri, sans-serif; font-style: normal; font-weight: normal; text-decoration: none; font-size: 11.5pt; }
div.maincontent .s30 { color: black; font-family:Calibri, sans-serif; font-style: normal; font-weight: normal; text-decoration: none; font-size: 11pt; }
div.maincontent .s31 { color: black; font-family:Times New Roman, serif; font-style: normal; font-weight: normal; text-decoration: none; font-size: 11pt; }
div.maincontent .s32 { color: black; font-family:.VnTime, sans-serif; font-style: normal; font-weight: normal; text-decoration: none; font-size: 14pt; }
div.maincontent .s33 { color: black; font-family:Cambria, serif; font-style: normal; font-weight: normal; text-decoration: none; font-size: 10.5pt; }
div.maincontent .s34 { color: black; font-family:Cambria, serif; font-style: normal; font-weight: normal; text-decoration: none; font-size: 10.5pt; vertical-align: -4pt; }
div.maincontent .s35 { color: black; font-family:Arial, sans-serif; font-style: normal; font-weight: normal; text-decoration: none; font-size: 11.5pt; }
div.maincontent .s36 { color: black; font-family:Arial, sans-serif; font-style: normal; font-weight: bold; text-decoration: none; font-size: 14pt; }
div.maincontent .s37 { color: black; font-family:Times New Roman, serif; font-style: normal; font-weight: bold; text-decoration: none; font-size: 13pt; }
div.maincontent .s38 { color: black; font-family:Times New Roman, serif; font-style: normal; font-weight: normal; text-decoration: none; font-size: 13pt; }
div.maincontent .s39 { color: black; font-family:Times New Roman, serif; font-style: normal; font-weight: normal; text-decoration: none; font-size: 15pt; }
div.maincontent .s40 { color: black; font-family:Times New Roman, serif; font-style: normal; fo](https://tailieuthamkhao.com/uploads/2022/06/06/dich-vu-phi-tin-dung-tai-ngan-hang-thuong-mai-co-phan-dau-tu-va-phat-8-1-120x90.png) Pre-tax Profit of Bidv Tien Giang in the Period 2011-2015
zt2i3t4l5ee
zt2a3gsnon-credit services, joint stock commercial bank
zt2a3ge
zc2o3n4t5e6n7ts
At that time, the Branch had to set aside a provision for credit risks, which reduced the Branch's income.
Chart 2.2. Pre-tax profit of BIDV Tien Giang in the period 2011-2015
Unit: Billion VND
140
120
100
80
60
40
20
0
63.3
80.34
89.29
110.08
131.99
2011 2012 2013 2014 2015
Profit before tax
(Source: Report on the implementation of the annual business plan of the General Planning Department of BIDV Tien Giang [24])
However, through chart 2.2, it can be seen that BIDV Tien Giang's profit is still increasing continuously, and its operating efficiency is currently leaking. This is a contribution of non-credit services, and this service segment will be increasingly focused on growth by BIDV Tien Giang to ensure the highest profit safety because credit activities have many potential risks. At the same time, focusing on developing non-credit services is consistent with one of the contents of restructuring the financial activities of credit institutions in the project "Restructuring the system of credit institutions in the period 2011-2015" approved by the Prime Minister in Decision No. 254/QD-TTg dated March 1, 2012 [14]: "Gradually shifting the business model of commercial banks towards reducing dependence on credit activities and increasing income from non-credit services".
2.2. Current status of non-credit service development at BIDV Tien Giang.
2.2.1. BIDV Tien Giang has deployed the development of non-credit services in recent times.
Along with the development of the Head Office, BIDV Tien Giang's products and services are constantly improved and deployed in a diverse manner to ensure provision for many different customer groups in the area: individual customers, corporate customers, and financial institutions. Typical services are as follows: Payment services, treasury services, guarantee services, card services, trade finance, other services: Western Union, insurance commissions, consulting services, foreign exchange derivatives trading, e-banking services,...
2.2.1.1. Payment services:
In accordance with the Prime Minister's Project to promote non-cash payments in Vietnam [15], banks in Tien Giang province have continuously developed payment services to reduce customers' cash usage habits through card services and electronic banking services such as: salary payment through accounts, focusing on developing card acceptance points, developing multi-purpose cards, paying social insurance by transfer, paying bills through banks, etc.
Chart 2.3. Net income from payment services in the period 2011-2015
Unit: Million VND
6000
5000
4000
3000
2000
1000
0
3922 4065
4720 5084 5324
2011 2012 2013 2014 2015
Net income from payment services
(Source: Report on the implementation of the annual business plan of the General Planning Department of BIDV Tien Giang [24])
Along with the technological development of the entire system, BIDV Tien Giang has a payment system with a fairly stable transaction processing speed, bringing many conveniences to customers. The results of observing chart 2.3 show that the income from payment services that the Branch has achieved has grown over the years but the speed is not high and the products are not outstanding compared to other banks. Domestic payment products such as: Online bill payment, electricity bills, water bills, insurance premiums, cable TV bills, telecommunications fees, airline tickets, etc. bring many conveniences to customers. Regarding international payment, this is an indispensable activity for foreign economic activities, BIDV Tien Giang is providing international payment methods for small enterprises producing agriculture, aquatic food and seafood that have credit relationships with banks in industrial parks in Tien Giang province such as: money transfer, collection, L/C payment.
2.2.1.2. Treasury services:
BIDV Tien Giang always focuses on ensuring treasury safety and currency security, always complies with legal regulations, and minimizes risks in operations such as: counting and collecting money from customers, receiving and delivering internal transactions, collecting from the State Bank (SBV) or other credit institutions, receiving ATM funds, bundling money, etc. BIDV Tien Giang's treasury service management department is always fully equipped with modern machinery and equipment such as: money transport vehicles, fire prevention tools, money counters, money detectors, magnifying glasses, etc. to ensure absolute safety in treasury operations, immediately identifying real and fake money and other risks that may affect people and assets of the bank and customers. In addition, implementing regulation 2480/QC dated October 28, 2008 between the State Bank of Tien Giang province and the Provincial Police on coordination in the fight against counterfeit money, in the 3-year review of implementation, BIDV Tien Giang discovered, seized and submitted to the State Bank of Tien Giang province 475 banknotes of various denominations and was commended by the Provincial Police and the State Bank of Tien Giang province [17].
Chart 2.4. Net income from treasury services in the period 2011-2015
Unit: Million VND
350
300
250
200
150
100
50
0
105 122
309 289 279
2011 2012 2013 2014 2015
Net income from treasury services
(Source: Report on the implementation of the annual business plan of the General Planning Department of BIDV Tien Giang [24])
However, as shown in Figure 2.4, income from treasury operations is not high and fluctuates. Specifically, in the period 2011-2013, net income increased and increased most sharply in 2013, then in the period 2013-2015, there was a downward trend. This fluctuation is due to the fact that fees collected from treasury services are often very low and can even be waived to attract customers to use other services.
2.2.1.3. Guarantee and trade finance services:
BIDV Tien Giang, thanks to the advantages of the province and the favorable location of the Branch, has continuously focused on developing income from guarantee services and trade finance.
Chart 2.5. Net income from guarantee and trade finance services in the period 2011-2015
Unit: Million VND
14000
12000
10000
8000
6000
4000
2000
0
5193 5695
2742 3420
8889
3992
11604 12206
5143 5312
2011 2012 2013 2014 2015
Net income from guarantee services Net income from Trade Finance
(Source: Report on the implementation of the annual business plan of the General Planning Department of BIDV Tien Giang [24])
Through chart 2.5, we can see that BIDV Tien Giang's income from guarantee services and trade finance has grown over the years. The reason is: Among BIDV Tien Giang's corporate customers, the construction industry is the industry with the highest proportion of customers after the trading industry, this is a group of customers with potential to develop guarantee services. The second group of customers is corporate customers in the fields of agricultural production, livestock and seafood processing with high import and export turnover in the area.
are the target of trade finance development. In addition, BIDV Tien Giang also focuses on continuously developing these customer groups to increase revenue for many other products and services in the future.
2.2.1.4. Card and POS services:
As a service that BIDV Tien Giang has recently developed strongly, it can be said that this is a very potential market and has the ability to develop even more strongly in the future. Card services with outstanding advantages such as fast payment time, wide payment range, quite safe, effective and suitable for the integration trend and the Project to promote non-cash payments in Vietnam. Cards have become a modern and popular payment tool. BIDV Tien Giang early identified that developing card services is to expand the market to people in society, create capital mobilized from card-opened accounts, contribute to diversifying banking activities, enhance the image of the bank, bring the BIDV Tien Giang brand to people as quickly and easily as possible. BIDV Tien Giang is currently providing card types such as: credit cards (BIDV MasterCard Platinum, BIDV Visa Gold Precious, BIDV Visa Manchester United, BIDV Visa Classic), international debit cards (BIDV Ready Card, BIDV Manu Debit Card), domestic debit cards (BIDV Harmony Card, BIDV eTrans Card, BIDV Moving Card, BIDV-Lingo Co-branded Card, BIDV-Co.opmart Co-branded Card). These cards can be paid via POS/EDC or on the ATM system. In addition, with debit cards, customers can not only withdraw money via ATMs but also perform utilities such as mobile top-up, online payment, money transfer,... through electronic banking services.
In order to attract customers with card services, BIDV Tien Giang has continuously increased the installation of ATMs. As of December 31, 2015, BIDV Tien Giang has 23 ATMs combined with 7 ATMs in the same system of BIDV My Tho, so the number of ATMs is quite large, especially in the center of My Tho City, but is not yet fully present in the districts. Basic services on ATMs such as withdrawing money, checking balances, printing short statements,... BIDV ATMs accept cards from banks in the system.
Banknetvn and Smartlink, cards branded by international card organizations Union Pay (CUP), VISA, MasterCard and cards of banks in the Asian Payment Network. From here, cardholders can make bill payments for themselves or others at ATMs, by simply entering the subscriber number or customer code, booking code that service providers notify and make bill payments.
Chart 2.6. Net income from card services in the period 2011-2015
Unit: Million VND
3500
3000
2500
2000
1500
1000
500
0
687
1023
1547
2267
3104
2011 2012 2013 2014 2015
Net income from card services
(Source: Report on the implementation of the annual business plan of the General Planning Department of BIDV Tien Giang [24])
Through chart 2.6, it can be seen that BIDV Tien Giang's card service income is constantly growing because the Branch focuses on developing businesses operating in industrial parks, which are the source of customers for salary payment products, ATMs, BSMS. Specifically, there are companies such as Freeview, Quang Viet, Dai Thanh, which are businesses with a large number of card openings at the Branch, contributing to the increase in card service fees [25].
Table 2.6. Number of ATMs and POS machines in 2015 of some banks in Tien Giang area.
Unit: Machine
STT
Bank name
Number of ATMs
Cumulative number of ATM cards
POS machine
1
BIDV Tien Giang
23
97,095
22
2
BIDV My Tho
7
21,325
0
3
Agribank Tien Giang
29
115,743
77
4
Vietinbank Tien Giang
16
100,052
54
5
Dong A Tien Giang
26
97,536
11
6
Sacombank Tien Giang
24
88,513
27
7
Vietcombank Tien Giang
15
61,607
96
8
Vietinbank - Tay Tien Giang Branch
6
46,042
38
(Source: 2015 Banking Activity Data Report of the General and Internal Control Department of the Provincial State Bank [21])
Through table 2.6, the author finds that the number of ATMs of BIDV Tien Giang is not much, ranking fourth after Agribank Tien Giang, Dong A Tien Giang, Sacombank Tien Giang. The number of POS machines of BIDV Tien Giang is very small, only higher than Dong A Tien Giang and BIDV My Tho in the initial stages of merging the BIDV system. Besides, BIDV Tien Giang has a high number of cards increasing over the years (table 2.7) but the cumulative number of cards issued up to December 31, 2015 is still relatively low compared to Agribank, Vietcombank, Dong A (table 2.6).
div.maincontent .content_head3 { color: black; font-family:"Times New Roman", serif; font-style: normal; font-weight: bold; text-decoration: none; font-size: 14pt; }
div.maincontent .p { color: black; font-family:"Times New Roman", serif; font-style: normal; font-weight: normal; text-decoration: none; font-size: 14pt; margin:0pt; }
div.maincontent p { color: black; font-family:"Times New Roman", serif; font-style: normal; font-weight: normal; text-decoration: none; font-size: 14pt; margin:0pt; }
div.maincontent .s1 { color: black; font-family:"Courier New", monospace; font-style: normal; font-weight: normal; text-decoration: none; font-size: 14pt; }
div.maincontent .s2 { color: black; font-family:"Times New Roman", serif; font-style: italic; font-weight: normal; text-decoration: none; font-size: 13pt; }
div.maincontent .s3 { color: black; font-family:"Times New Roman", serif; font-style: italic; font-weight: bold; text-decoration: none; font-size: 14pt; }
div.maincontent .s4 { color: black; font-family:"Times New Roman", serif; font-style: italic; font-weight: normal; text-decoration: none; font-size: 14pt; }
div.maincontent .s5 { color: black; font-family:"Times New Roman", serif; font-style: normal; font-weight: normal; text-decoration: none; font-size: 14pt; }
div.maincontent .s6 { color: black; font-family:"Times New Roman", serif; font-style: normal; font-weight: bold; text-decoration: none; font-size: 14pt; }
div.maincontent .s7 { color: black; font-family:"Times New Roman", serif; font-style: normal; font-weight: normal; text-decoration: none; font-size: 13.5pt; }
div.maincontent .s8 { color: black; font-family:Arial, sans-serif; font-style: normal; font-weight: normal; text-decoration: none; font-size: 9pt; }
div.maincontent .s9 { color: black; font-family:Arial, sans-serif; font-style: normal; font-weight: normal; text-decoration: none; font-size: 9pt; vertical-align: -2pt; }
div.maincontent .s10 { color: black; font-family:Arial, sans-serif; font-style: normal; font-weight: normal; text-decoration: none; font-size: 9pt; vertical-align: 5pt; }
div.maincontent .s11 { color: black; font-family:Arial, sans-serif; font-style: normal; font-weight: normal; text-decoration: none; font-size: 9pt; vertical-align: -5pt; }
div.maincontent .s12 { color: black; font-family:Arial, sans-serif; font-style: normal; font-weight: normal; text-decoration: none; font-size: 9pt; vertical-align: -3pt; }
div.maincontent .s13 { color: black; font-family:Arial, sans-serif; font-style: normal; font-weight: normal; text-decoration: none; font-size: 9pt; vertical-align: -4pt; }
div.maincontent .s14 { color: black; font-family:Arial, sans-serif; font-style: normal; font-weight: normal; text-decoration: none; font-size: 7.5pt; }
div.maincontent .s15 { color: black; font-family:"Times New Roman", serif; font-style: italic; font-weight: normal; text-decoration: none; font-size: 14pt; }
div.maincontent .s16 { color: black; font-family:Arial, sans-serif; font-style: normal; font-weight: normal; text-decoration: none; font-size: 10.5pt; }
div.maincontent .s17 { color: black; font-family:Arial, sans-serif; font-style: normal; font-weight: normal; text-decoration: none; font-size: 9.5pt; }
div.maincontent .s18 { color: black; font-family:Arial, sans-serif; font-style: normal; font-weight: normal; text-decoration: none; font-size: 10.5pt; vertical-align: -1pt; }
div.maincontent .s19 { color: black; font-family:Arial, sans-serif; font-style: normal; font-weight: normal; text-decoration: none; font-size: 10.5pt; vertical-align: -5pt; }
div.maincontent .s20 { color: black; font-family:Arial, sans-serif; font-style: normal; font-weight: normal; text-decoration: none; font-size: 10.5pt; vertical-align: -2pt; }
div.maincontent .s21 { color: black; font-family:Arial, sans-serif; font-style: normal; font-weight: normal; text-decoration: none; font-size: 10pt; }
div.maincontent .s22 { color: black; font-family:Calibri, sans-serif; font-style: normal; font-weight: normal; text-decoration: none; font-size: 10.5pt; }
div.maincontent .s23 { color: black; font-family:Calibri, sans-serif; font-style: normal; font-weight: normal; text-decoration: none; font-size: 10.5pt; vertical-align: -3pt; }
div.maincontent .s24 { color: black; font-family:Calibri, sans-serif; font-style: normal; font-weight: normal; text-decoration: none; font-size: 10.5pt; vertical-align: -5pt; }
div.maincontent .s25 { color: black; font-family:"Times New Roman", serif; font-style: normal; font-weight: normal; text-decoration: none; font-size: 10.5pt; }
div.maincontent .s26 { color: black; font-family:Calibri, sans-serif; font-style: normal; font-weight: normal; text-decoration: none; font-size: 10.5pt; vertical-align: -4pt; }
div.maincontent .s27 { color: black; font-family:Calibri, sans-serif; font-style: normal; font-weight: normal; text-decoration: none; font-size: 10.5pt; vertical-align: -6pt; }
div.maincontent .s28 { color: black; font-family:Calibri, sans-serif; font-style: normal; font-weight: normal; text-decoration: none; font-size: 10.5pt; vertical-align: -1pt; }
div.maincontent .s29 { color: black; font-family:Calibri, sans-serif; font-style: normal; font-weight: normal; text-decoration: none; font-size: 11.5pt; }
div.maincontent .s30 { color: black; font-family:Calibri, sans-serif; font-style: normal; font-weight: normal; text-decoration: none; font-size: 11pt; }
div.maincontent .s31 { color: black; font-family:"Times New Roman", serif; font-style: normal; font-weight: normal; text-decoration: none; font-size: 11pt; }
div.maincontent .s32 { color: black; font-family:.VnTime, sans-serif; font-style: normal; font-weight: normal; text-decoration: none; font-size: 14pt; }
div.maincontent .s33 { color: black; font-family:Cambria, serif; font-style: normal; font-weight: normal; text-decoration: none; font-size: 10.5pt; }
div.maincontent .s34 { color: black; font-family:Cambria, serif; font-style: normal; font-weight: normal; text-decoration: none; font-size: 10.5pt; vertical-align: -4pt; }
div.maincontent .s35 { color: black; font-family:Arial, sans-serif; font-style: normal; font-weight: normal; text-decoration: none; font-size: 11.5pt; }
div.maincontent .s36 { color: black; font-family:Arial, sans-serif; font-style: normal; font-weight: bold; text-decoration: none; font-size: 14pt; }
div.maincontent .s37 { color: black; font-family:"Times New Roman", serif; font-style: normal; font-weight: bold; text-decoration: none; font-size: 13pt; }
div.maincontent .s38 { color: black; font-family:"Times New Roman", serif; font-style: normal; font-weight: normal; text-decoration: none; font-size: 13pt; }
div.maincontent .s39 { color: black; font-family:"Times New Roman", serif; font-style: normal; font-weight: normal; text-decoration: none; font-size: 15pt; }
div.maincontent .s40 { color: black; font-family:"Times New Roman", serif; font-style: normal; fo
Pre-tax Profit of Bidv Tien Giang in the Period 2011-2015
zt2i3t4l5ee
zt2a3gsnon-credit services, joint stock commercial bank
zt2a3ge
zc2o3n4t5e6n7ts
At that time, the Branch had to set aside a provision for credit risks, which reduced the Branch's income.
Chart 2.2. Pre-tax profit of BIDV Tien Giang in the period 2011-2015
Unit: Billion VND
140
120
100
80
60
40
20
0
63.3
80.34
89.29
110.08
131.99
2011 2012 2013 2014 2015
Profit before tax
(Source: Report on the implementation of the annual business plan of the General Planning Department of BIDV Tien Giang [24])
However, through chart 2.2, it can be seen that BIDV Tien Giang's profit is still increasing continuously, and its operating efficiency is currently leaking. This is a contribution of non-credit services, and this service segment will be increasingly focused on growth by BIDV Tien Giang to ensure the highest profit safety because credit activities have many potential risks. At the same time, focusing on developing non-credit services is consistent with one of the contents of restructuring the financial activities of credit institutions in the project "Restructuring the system of credit institutions in the period 2011-2015" approved by the Prime Minister in Decision No. 254/QD-TTg dated March 1, 2012 [14]: "Gradually shifting the business model of commercial banks towards reducing dependence on credit activities and increasing income from non-credit services".
2.2. Current status of non-credit service development at BIDV Tien Giang.
2.2.1. BIDV Tien Giang has deployed the development of non-credit services in recent times.
Along with the development of the Head Office, BIDV Tien Giang's products and services are constantly improved and deployed in a diverse manner to ensure provision for many different customer groups in the area: individual customers, corporate customers, and financial institutions. Typical services are as follows: Payment services, treasury services, guarantee services, card services, trade finance, other services: Western Union, insurance commissions, consulting services, foreign exchange derivatives trading, e-banking services,...
2.2.1.1. Payment services:
In accordance with the Prime Minister's Project to promote non-cash payments in Vietnam [15], banks in Tien Giang province have continuously developed payment services to reduce customers' cash usage habits through card services and electronic banking services such as: salary payment through accounts, focusing on developing card acceptance points, developing multi-purpose cards, paying social insurance by transfer, paying bills through banks, etc.
Chart 2.3. Net income from payment services in the period 2011-2015
Unit: Million VND
6000
5000
4000
3000
2000
1000
0
3922 4065
4720 5084 5324
2011 2012 2013 2014 2015
Net income from payment services
(Source: Report on the implementation of the annual business plan of the General Planning Department of BIDV Tien Giang [24])
Along with the technological development of the entire system, BIDV Tien Giang has a payment system with a fairly stable transaction processing speed, bringing many conveniences to customers. The results of observing chart 2.3 show that the income from payment services that the Branch has achieved has grown over the years but the speed is not high and the products are not outstanding compared to other banks. Domestic payment products such as: Online bill payment, electricity bills, water bills, insurance premiums, cable TV bills, telecommunications fees, airline tickets, etc. bring many conveniences to customers. Regarding international payment, this is an indispensable activity for foreign economic activities, BIDV Tien Giang is providing international payment methods for small enterprises producing agriculture, aquatic food and seafood that have credit relationships with banks in industrial parks in Tien Giang province such as: money transfer, collection, L/C payment.
2.2.1.2. Treasury services:
BIDV Tien Giang always focuses on ensuring treasury safety and currency security, always complies with legal regulations, and minimizes risks in operations such as: counting and collecting money from customers, receiving and delivering internal transactions, collecting from the State Bank (SBV) or other credit institutions, receiving ATM funds, bundling money, etc. BIDV Tien Giang's treasury service management department is always fully equipped with modern machinery and equipment such as: money transport vehicles, fire prevention tools, money counters, money detectors, magnifying glasses, etc. to ensure absolute safety in treasury operations, immediately identifying real and fake money and other risks that may affect people and assets of the bank and customers. In addition, implementing regulation 2480/QC dated October 28, 2008 between the State Bank of Tien Giang province and the Provincial Police on coordination in the fight against counterfeit money, in the 3-year review of implementation, BIDV Tien Giang discovered, seized and submitted to the State Bank of Tien Giang province 475 banknotes of various denominations and was commended by the Provincial Police and the State Bank of Tien Giang province [17].
Chart 2.4. Net income from treasury services in the period 2011-2015
Unit: Million VND
350
300
250
200
150
100
50
0
105 122
309 289 279
2011 2012 2013 2014 2015
Net income from treasury services
(Source: Report on the implementation of the annual business plan of the General Planning Department of BIDV Tien Giang [24])
However, as shown in Figure 2.4, income from treasury operations is not high and fluctuates. Specifically, in the period 2011-2013, net income increased and increased most sharply in 2013, then in the period 2013-2015, there was a downward trend. This fluctuation is due to the fact that fees collected from treasury services are often very low and can even be waived to attract customers to use other services.
2.2.1.3. Guarantee and trade finance services:
BIDV Tien Giang, thanks to the advantages of the province and the favorable location of the Branch, has continuously focused on developing income from guarantee services and trade finance.
Chart 2.5. Net income from guarantee and trade finance services in the period 2011-2015
Unit: Million VND
14000
12000
10000
8000
6000
4000
2000
0
5193 5695
2742 3420
8889
3992
11604 12206
5143 5312
2011 2012 2013 2014 2015
Net income from guarantee services Net income from Trade Finance
(Source: Report on the implementation of the annual business plan of the General Planning Department of BIDV Tien Giang [24])
Through chart 2.5, we can see that BIDV Tien Giang's income from guarantee services and trade finance has grown over the years. The reason is: Among BIDV Tien Giang's corporate customers, the construction industry is the industry with the highest proportion of customers after the trading industry, this is a group of customers with potential to develop guarantee services. The second group of customers is corporate customers in the fields of agricultural production, livestock and seafood processing with high import and export turnover in the area.
are the target of trade finance development. In addition, BIDV Tien Giang also focuses on continuously developing these customer groups to increase revenue for many other products and services in the future.
2.2.1.4. Card and POS services:
As a service that BIDV Tien Giang has recently developed strongly, it can be said that this is a very potential market and has the ability to develop even more strongly in the future. Card services with outstanding advantages such as fast payment time, wide payment range, quite safe, effective and suitable for the integration trend and the Project to promote non-cash payments in Vietnam. Cards have become a modern and popular payment tool. BIDV Tien Giang early identified that developing card services is to expand the market to people in society, create capital mobilized from card-opened accounts, contribute to diversifying banking activities, enhance the image of the bank, bring the BIDV Tien Giang brand to people as quickly and easily as possible. BIDV Tien Giang is currently providing card types such as: credit cards (BIDV MasterCard Platinum, BIDV Visa Gold Precious, BIDV Visa Manchester United, BIDV Visa Classic), international debit cards (BIDV Ready Card, BIDV Manu Debit Card), domestic debit cards (BIDV Harmony Card, BIDV eTrans Card, BIDV Moving Card, BIDV-Lingo Co-branded Card, BIDV-Co.opmart Co-branded Card). These cards can be paid via POS/EDC or on the ATM system. In addition, with debit cards, customers can not only withdraw money via ATMs but also perform utilities such as mobile top-up, online payment, money transfer,... through electronic banking services.
In order to attract customers with card services, BIDV Tien Giang has continuously increased the installation of ATMs. As of December 31, 2015, BIDV Tien Giang has 23 ATMs combined with 7 ATMs in the same system of BIDV My Tho, so the number of ATMs is quite large, especially in the center of My Tho City, but is not yet fully present in the districts. Basic services on ATMs such as withdrawing money, checking balances, printing short statements,... BIDV ATMs accept cards from banks in the system.
Banknetvn and Smartlink, cards branded by international card organizations Union Pay (CUP), VISA, MasterCard and cards of banks in the Asian Payment Network. From here, cardholders can make bill payments for themselves or others at ATMs, by simply entering the subscriber number or customer code, booking code that service providers notify and make bill payments.
Chart 2.6. Net income from card services in the period 2011-2015
Unit: Million VND
3500
3000
2500
2000
1500
1000
500
0
687
1023
1547
2267
3104
2011 2012 2013 2014 2015
Net income from card services
(Source: Report on the implementation of the annual business plan of the General Planning Department of BIDV Tien Giang [24])
Through chart 2.6, it can be seen that BIDV Tien Giang's card service income is constantly growing because the Branch focuses on developing businesses operating in industrial parks, which are the source of customers for salary payment products, ATMs, BSMS. Specifically, there are companies such as Freeview, Quang Viet, Dai Thanh, which are businesses with a large number of card openings at the Branch, contributing to the increase in card service fees [25].
Table 2.6. Number of ATMs and POS machines in 2015 of some banks in Tien Giang area.
Unit: Machine
STT
Bank name
Number of ATMs
Cumulative number of ATM cards
POS machine
1
BIDV Tien Giang
23
97,095
22
2
BIDV My Tho
7
21,325
0
3
Agribank Tien Giang
29
115,743
77
4
Vietinbank Tien Giang
16
100,052
54
5
Dong A Tien Giang
26
97,536
11
6
Sacombank Tien Giang
24
88,513
27
7
Vietcombank Tien Giang
15
61,607
96
8
Vietinbank - Tay Tien Giang Branch
6
46,042
38
(Source: 2015 Banking Activity Data Report of the General and Internal Control Department of the Provincial State Bank [21])
Through table 2.6, the author finds that the number of ATMs of BIDV Tien Giang is not much, ranking fourth after Agribank Tien Giang, Dong A Tien Giang, Sacombank Tien Giang. The number of POS machines of BIDV Tien Giang is very small, only higher than Dong A Tien Giang and BIDV My Tho in the initial stages of merging the BIDV system. Besides, BIDV Tien Giang has a high number of cards increasing over the years (table 2.7) but the cumulative number of cards issued up to December 31, 2015 is still relatively low compared to Agribank, Vietcombank, Dong A (table 2.6).
div.maincontent .content_head3 { color: black; font-family:"Times New Roman", serif; font-style: normal; font-weight: bold; text-decoration: none; font-size: 14pt; }
div.maincontent .p { color: black; font-family:"Times New Roman", serif; font-style: normal; font-weight: normal; text-decoration: none; font-size: 14pt; margin:0pt; }
div.maincontent p { color: black; font-family:"Times New Roman", serif; font-style: normal; font-weight: normal; text-decoration: none; font-size: 14pt; margin:0pt; }
div.maincontent .s1 { color: black; font-family:"Courier New", monospace; font-style: normal; font-weight: normal; text-decoration: none; font-size: 14pt; }
div.maincontent .s2 { color: black; font-family:"Times New Roman", serif; font-style: italic; font-weight: normal; text-decoration: none; font-size: 13pt; }
div.maincontent .s3 { color: black; font-family:"Times New Roman", serif; font-style: italic; font-weight: bold; text-decoration: none; font-size: 14pt; }
div.maincontent .s4 { color: black; font-family:"Times New Roman", serif; font-style: italic; font-weight: normal; text-decoration: none; font-size: 14pt; }
div.maincontent .s5 { color: black; font-family:"Times New Roman", serif; font-style: normal; font-weight: normal; text-decoration: none; font-size: 14pt; }
div.maincontent .s6 { color: black; font-family:"Times New Roman", serif; font-style: normal; font-weight: bold; text-decoration: none; font-size: 14pt; }
div.maincontent .s7 { color: black; font-family:"Times New Roman", serif; font-style: normal; font-weight: normal; text-decoration: none; font-size: 13.5pt; }
div.maincontent .s8 { color: black; font-family:Arial, sans-serif; font-style: normal; font-weight: normal; text-decoration: none; font-size: 9pt; }
div.maincontent .s9 { color: black; font-family:Arial, sans-serif; font-style: normal; font-weight: normal; text-decoration: none; font-size: 9pt; vertical-align: -2pt; }
div.maincontent .s10 { color: black; font-family:Arial, sans-serif; font-style: normal; font-weight: normal; text-decoration: none; font-size: 9pt; vertical-align: 5pt; }
div.maincontent .s11 { color: black; font-family:Arial, sans-serif; font-style: normal; font-weight: normal; text-decoration: none; font-size: 9pt; vertical-align: -5pt; }
div.maincontent .s12 { color: black; font-family:Arial, sans-serif; font-style: normal; font-weight: normal; text-decoration: none; font-size: 9pt; vertical-align: -3pt; }
div.maincontent .s13 { color: black; font-family:Arial, sans-serif; font-style: normal; font-weight: normal; text-decoration: none; font-size: 9pt; vertical-align: -4pt; }
div.maincontent .s14 { color: black; font-family:Arial, sans-serif; font-style: normal; font-weight: normal; text-decoration: none; font-size: 7.5pt; }
div.maincontent .s15 { color: black; font-family:"Times New Roman", serif; font-style: italic; font-weight: normal; text-decoration: none; font-size: 14pt; }
div.maincontent .s16 { color: black; font-family:Arial, sans-serif; font-style: normal; font-weight: normal; text-decoration: none; font-size: 10.5pt; }
div.maincontent .s17 { color: black; font-family:Arial, sans-serif; font-style: normal; font-weight: normal; text-decoration: none; font-size: 9.5pt; }
div.maincontent .s18 { color: black; font-family:Arial, sans-serif; font-style: normal; font-weight: normal; text-decoration: none; font-size: 10.5pt; vertical-align: -1pt; }
div.maincontent .s19 { color: black; font-family:Arial, sans-serif; font-style: normal; font-weight: normal; text-decoration: none; font-size: 10.5pt; vertical-align: -5pt; }
div.maincontent .s20 { color: black; font-family:Arial, sans-serif; font-style: normal; font-weight: normal; text-decoration: none; font-size: 10.5pt; vertical-align: -2pt; }
div.maincontent .s21 { color: black; font-family:Arial, sans-serif; font-style: normal; font-weight: normal; text-decoration: none; font-size: 10pt; }
div.maincontent .s22 { color: black; font-family:Calibri, sans-serif; font-style: normal; font-weight: normal; text-decoration: none; font-size: 10.5pt; }
div.maincontent .s23 { color: black; font-family:Calibri, sans-serif; font-style: normal; font-weight: normal; text-decoration: none; font-size: 10.5pt; vertical-align: -3pt; }
div.maincontent .s24 { color: black; font-family:Calibri, sans-serif; font-style: normal; font-weight: normal; text-decoration: none; font-size: 10.5pt; vertical-align: -5pt; }
div.maincontent .s25 { color: black; font-family:"Times New Roman", serif; font-style: normal; font-weight: normal; text-decoration: none; font-size: 10.5pt; }
div.maincontent .s26 { color: black; font-family:Calibri, sans-serif; font-style: normal; font-weight: normal; text-decoration: none; font-size: 10.5pt; vertical-align: -4pt; }
div.maincontent .s27 { color: black; font-family:Calibri, sans-serif; font-style: normal; font-weight: normal; text-decoration: none; font-size: 10.5pt; vertical-align: -6pt; }
div.maincontent .s28 { color: black; font-family:Calibri, sans-serif; font-style: normal; font-weight: normal; text-decoration: none; font-size: 10.5pt; vertical-align: -1pt; }
div.maincontent .s29 { color: black; font-family:Calibri, sans-serif; font-style: normal; font-weight: normal; text-decoration: none; font-size: 11.5pt; }
div.maincontent .s30 { color: black; font-family:Calibri, sans-serif; font-style: normal; font-weight: normal; text-decoration: none; font-size: 11pt; }
div.maincontent .s31 { color: black; font-family:"Times New Roman", serif; font-style: normal; font-weight: normal; text-decoration: none; font-size: 11pt; }
div.maincontent .s32 { color: black; font-family:.VnTime, sans-serif; font-style: normal; font-weight: normal; text-decoration: none; font-size: 14pt; }
div.maincontent .s33 { color: black; font-family:Cambria, serif; font-style: normal; font-weight: normal; text-decoration: none; font-size: 10.5pt; }
div.maincontent .s34 { color: black; font-family:Cambria, serif; font-style: normal; font-weight: normal; text-decoration: none; font-size: 10.5pt; vertical-align: -4pt; }
div.maincontent .s35 { color: black; font-family:Arial, sans-serif; font-style: normal; font-weight: normal; text-decoration: none; font-size: 11.5pt; }
div.maincontent .s36 { color: black; font-family:Arial, sans-serif; font-style: normal; font-weight: bold; text-decoration: none; font-size: 14pt; }
div.maincontent .s37 { color: black; font-family:"Times New Roman", serif; font-style: normal; font-weight: bold; text-decoration: none; font-size: 13pt; }
div.maincontent .s38 { color: black; font-family:"Times New Roman", serif; font-style: normal; font-weight: normal; text-decoration: none; font-size: 13pt; }
div.maincontent .s39 { color: black; font-family:"Times New Roman", serif; font-style: normal; font-weight: normal; text-decoration: none; font-size: 15pt; }
div.maincontent .s40 { color: black; font-family:"Times New Roman", serif; font-style: normal; fo -
 Growth Parameters of Plants in Strip No. 1 Growth Measurement Chart of Seedlings in Strip No. 1

TT TT cow
TT TT
TT TT
TT TT


(Mean numbers with different letters in the same column are statistically different, P < 0.05).
The data in Table 3.2 show that the average daily growth of the F 1 , F 2 , F 3 and HF cow groups reached their highest from birth to 6 months of age, respectively: 558.58 ± 5.03g, 592.36 ± 4.91g, 643.31 ± 4.15g and 681.15
±3.71g, at age 7 - 12 months old: 456.79 ± 8.84g, 479.79 ± 8.36g, 518.69
± 5.47g and 554.04 ± 5.09g and the age group of 19 to 24 months reached respectively: 366.19 ± 5.47g, 399.45 ± 6.77g, 414.26 ± 5.86g and 430.40 ± 5.02g. Thus,
The growth of the cow groups is highest in the newborn - 6 month old stage, then gradually decreases, the lowest is in the 19 - 24 month old stage. The growth of F1 cows is lowest and the highest is in HF cows (in increasing order as the HF blood ratio increases). Absolute growth is low from the 7 - 12 month old stage onwards, proving that the growth of cows follows the main law of absolute growth. Statistical comparison shows that the absolute growth in the newborn - 6 month, 7 - 12 month stages of different cow groups is statistically significant (P < 0.05). At the stage
In the period of 19-24 months, the absolute growth of F 3 cows compared to HF, and of F 2 cows compared to F 3 cows were not statistically different (P > 0.05). The difference in this index between F 1 cows compared to F 2 , F 3 and HF cows was significant (P < 0.05).
Similar to absolute growth, relative growth of cow groups reached its highest in the neonatal – 6-month period, respectively: 125.92
± 0.62%; 126.53 ± 0.56%; 126.14 ± 0.53% and 126.55 ± 0.35% then decreased
gradually, reaching 20.64 ± 0.31% at 19 - 24 months of age; 21.62 ± 0.40%;
20.46 ± 0.31% and 20.14 ± 0.23% respectively.
F 1
F 2
F 3
HF
7 0 0
6 0 0
5 0 0
4 0 0
3 0 0
2 0 0
1 0 0
0
SS _ 6
7 _ 1 2
1 3 _ 1 8
1 9 _ 2 4
Early adolescence
Absolute growth (g/day)
Figure 3.1. Absolute growth of cattle groups
F 1
F 2
F 3
HF
1 4 0
1 2 0
1 0 0
8 0
6 0
4 0
2 0
0
SS _ 6
7 _ 1 2
1 3 _ 1 8
1 9 _ 2 4
Early adolescence
Relative density (%)
Figure 3.2. Relative growth of cattle groups
57
3.1.1. 2 Dimensions of some dimensions and body composition indexes of cattle groups
The dimensions and some body composition indexes of the monitored cow groups are presented in tables 3.3 and 3.4. The data obtained in tables 3.3 and 3.4 show that the measurements of fin height, chest circumference and diagonal body length of F1 cows at 6 months of age were the lowest (94.95 ± 0.36 cm, 120.39
± 0.47cm and 105.48 ± 0.43cm) and the highest was HF cow (103.79 ± 0.30cm,
126.75 ± 0.33cm and 112.87 ± 0.25cm). In general, these measurements at 6 months of age of the cow groups were in the range: 94.95 ± 0.36cm – 103.79 ± 0.30cm, 120.39 ± 0.47cm – 126.75 ± 0.33cm and 105.48 ± 0.43cm – 112.87 ±
0.25cm respectively.
At the ages of 12, 18, 24 months, the values of the measurements also had similar rules and at 24 months, these measurements of the groups of cows F 1 , F 2 , F 3 and HF were in the corresponding ranges: 125.38 ± 0.55cm - 134.65 ± 0.27cm, 173.97 ± 0.56cm - 180.52 ± 0.37cm and 144.24 ± 0.46cm - 152.15 ± 0.30cm. The results
This result shows that the dimensions of the cow group are quite large.
The coefficient of variation of the measurements of the cow groups was relatively low (2.33% - 4.90%), showing that the growth rate of the cow measurements was quite uniform.
The body length, body roundness and weight indexes at 6 months of age of the F 1 , F 2 , F 3 and HF groups ranged from 111.23 ± 0.82 – 108.76 ± 0.29; 114.68 ± 0.71 – 112.31 ± 0.28 and 126.95 ± 0.62 – 122.03 ± 0.29. After 24
The coefficient of variation in the rearing month was 115.20 ± 0.61 - 112.99 ± 0.36; 120.72 ± 0.48 - 118.78 ± 0.36 and 139.01 ± 0.70 - 134.10 ± 0.35, respectively.
The error of these indices also has relatively low values (3.35% - 7.84%).
From the above results, it can be seen that across ages, the dimensions of HF cows are the largest and the lowest are F1 cows . However, the body composition indices tend to be the highest in F1 cows and the lowest in HF cows. Body composition indices
CV | VN | DTC | CV | VN | DTC | CV | VN | DTC | CV | VN | DTC | |
| 94.95a | 120.39a | 105.48a | 103.25a | 144.18a | 115.94a | 115.85a | 160.89a | 130.83a | 125.38a | 173.97a | 144.24a |
F 1 SE | 0.36 | 0.47 | 0.43 | 0.35 | 0.45 | 0.25 | 0.49 | 0.49 | 0.37 | 0.55 | 0.56 | 0.46 |
Cv% | 4.04 | 4.11 | 4.30 | 3.56 | 3.34 | 2.38 | 4.48 | 3.25 | 3.02 | 4.71 | 3.41 | 3.39 |
| 96.88 b | 120.86a | 106.61b | 105.88b | 146.59 b | 117.16b | 118.36b | 164.43b | 133.29b | 126.47a | 175.72 b | 145.82 b |
F 2 SE | 0.41 | 0.43 | 0.40 | 0.50 | 0.44 | 0.24 | 0.45 | 0.54 | 0.48 | 0.57 | 0.48 | 0.43 |
Cv% | 4.59 | 3.86 | 4.12 | 5.07 | 3.27 | 2.47 | 4.11 | 3.56 | 3.88 | 4.90 | 2.98 | 3.19 |
| 101.80 c | 124.32b | 110.07 c | 110.16 c | 149.55 c | 120.96 c | 122.74 c | 166.51 c | 135.79 c | 129.38b | 176.84 b | 148.75 c |
F 3 SE | 0.40 | 0.37 | 0.42 | 0.33 | 0.41 | 0.31 | 0.47 | 0.43 | 0.40 | 0.51 | 0.54 | 0.40 |
Cv% | 4.23 | 3.16 | 4.12 | 3.25 | 2.98 | 2.69 | 4.08 | 2.79 | 3.16 | 4.28 | 3.31 | 2.88 |
| 103.79 d | 126.75 c | 112.87 d | 113.06 d | 151.41 d | 123.44 d | 126.56 d | 169.77 d | 138.84 d | 134.65 c | 180.52 c | 152.15 d |
(n=257) SE | 0.30 | 0.33 | 0.25 | 0.27 | 0.38 | 0.18 | 0.30 | 0.33 | 0.31 | 0.27 | 0.37 | 0.30 |
Cv% | 4.65 | 4.17 | 3.57 | 3.85 | 4.04 | 2.33 | 3.80 | 3.15 | 3.53 | 3.20 | 3.31 | 3.14 |


Cow group
Statistics
Table 3.3. Size (cm) of some measurements by month of age of cow groups
58
Months old
6 12 18 24
58
(n=114)
(n=118)
(n=116)

HF
(Mean numbers with different letters in the same column are statistically different, P < 0.05). Note: TSTK: Statistical parameters, CV: Fin height, VN: Chest circumference, DTC: Diagonal body length
Group Th.so6 | 12 | 18 | 24 | |||||||||
CSDT | CSTM | Customer Service | CSDT | CSTM | Customer Service | CSDT | CSTM | Customer Service | CSDT | CSTM | Customer Service | |
| 111.23a | 114.68a | 126.95a | 112.43a | 124.41 ab | 139.75a | 113.15a | 123.06 | 139.08a | 115.20a | 120.72a | 139.01a |
(n=114) SE | 0.82 | 0.71 | 0.62 | 0.44 | 0.45 | 0.61 | 0.56 | 0.45 | 0.60 | 0.61 | 0.48 | 0.70 |
Cv% | 7.84 | 6.58 | 5.23 | 4.20 | 3.87 | 4.68 | 5.43 | 3.94 | 4.60 | 5.65 | 4.24 | 5.34 |
110.27a | 113.43a | 124.96 b | 110.77 b | 125.18a | 138.55a | 112.81a | 123.44 | 139.12a | 115.54a | 120.63a | 139.23a | |
F 2 SE | 0.51 | 0.47 | 0.59 | 0.40 | 0.46 | 0.53 | 0.51 | 0.48 | 0.62 | 0.58 | 0.49 | 0.68 |
Cv% | 5.04 | 4.51 | 5.10 | 3.91 | 3.97 | 4.16 | 4.81 | 4.19 | 4.82 | 5.47 | 4.37 | 5.27 |
| 108.30b | 113.01 ab | 122.31 c | 109.92b | 123.73 BC | 135.86 b | 110.81b | 122.26 | 135.85 b | 115.18a | 118.96 b | 136.89 b |
(n=116) SE | 0.47 | 0.43 | 0.56 | 0.42 | 0.47 | 0.48 | 0.49 | 0.44 | 0.51 | 0.54 | 0.49 | 0.57 |
Cv% | 4.69 | 4.06 | 4.92 | 4.09 | 4.12 | 3.72 | 4.79 | 3.89 | 4.04 | 5.09 | 4.37 | 4.49 |
| 108.76 b | 112.31b | 122.03 c | 109.26b | 122.65 c | 134.21 c | 109.56 c | 122.59 | 134.21 c | 112.99 b | 118.78b | 134.10 c |
(n=257) SE | 0.29 | 0.28 | 0.29 | 0.23 | 0.28 | 0.36 | 0.33 | 0.33 | 0.39 | 0.36 | 0.36 | 0.35 |
Cv% | 4.21 | 3.96 | 3.83 | 3.35 | 3.36 | 4.26 | 4.78 | 4.34 | 4.71 | 5.12 | 4.87 | 4.20 |


beef
Table 3.4. Some physical structure indexes of cattle groups
59
Months old

F 1

(n=118)

59
F 3

HF
(The average numbers with different letters in the same column are statistically different, P < 0.05). Note: TSTK: Statistical parameters, CSDT: Body length index, CSTM: Body roundness index, CSKL: Mass index
This figure of the cow groups approximates the corresponding indices of specialized dairy cows. This shows that when crossing HF cows and Sind crossbred cows, the crossbreds have a body constitution index that is inclined towards milk production.
3.1.2 Growth ability of experimental cow groups
3.1.2.1 Cumulative, absolute and relative growth
The results of growth performance of the experimental cattle group are presented in tables 3.5; 3.6 and illustrated in figures 3.3; graphs
3.2 and figure 3.4.
Table 3.5. Weight of cows (kg) from birth to 24 months of age
statistics | Newborn | 6 months | 12 months | 18 months | 24 months |
F | 33.46 | 143.49b | 227.51 b | 305.25 b | 374.59 b |
1 SE | 0.17 | 0.68 | 0.88 | 0.91 | 1.16 |
(n = 20) Cv% | 2.33 | 2.11 | 1.74 | 1.33 | 1.38 |
F | 33.42 | 148.42 c | 246.78 c | 328.22 c | 401.18 c |
2 SE | 0.20 | 0.41 | 1.44 | 1.82 | 3.03 |
(n = 20) Cv% | 2.66 | 1.25 | 2.61 | 2.49 | 3.37 |
F | 33.64 | 157.40 d | 258.18 d | 342.63 d | 420.89 d |
3 SE | 0.11 | 0.91 | 1.39 | 1.14 | 2.37 |
(n = 20) Cv% | 1.52 | 2.60 | 2.41 | 1.49 | 2.52 |
HF | 33.58 | 164.67a | 274.60a | 362.30a | 448.96a |
(n = 20) SE | 0.12 | 0.52 | 0.93 | 0.78 | 2.25 |
Cv% | 1.57 | 1.40 | 1.51 | 0.96 | 2.24 |
Cow group Th. number
Months old


(Mean numbers with different letters in the same column are statistically different, P < 0.05)
.
The results obtained in Table 3.5 show that the birth weight of the cow groups F 1 , F 2 , F 3 and HF are respectively: 33.46 ± 0.17kg, 33.42 ± 0.20kg, 33.64
± 0.11kg and 33.58 ± 0.12kg. After 24 months of age, the weight of F1 cows is low.
First, the mass increased gradually with increasing HF blood percentage and was highest in HF cows.
The weight at 24 months of age of the F 1 , F 2 , F 3 and HF groups was respectively: 374.59 ± 1.16 kg, 401.18 ± 3.03 kg, 420.89 ± 2.37 kg and 448.96 ± 2.25 kg.
During the 24 months of raising, the coefficient of variation in weight of the F1, F2, F3 and HF experimental groups had lower values than the monitoring group. This shows that the experimental group of cows grew and developed quite evenly, this uniformity was due to the result of the selection process right from the beginning of the experiment.
Thus, across ages, the weight of HF cows was higher than that of crossbreds. Similar to the monitored cow group, the weight of the cow groups tended to increase as the percentage of HF blood in crossbreds increased.
At birth, the weight of the cow groups was quite uniform. Therefore, the difference in weight between the cow groups was not statistically significant (P > 0.05). However, at other ages, the weight of the cow groups was statistically significant (P < 0.05).
Compared with the monitoring group, the experimental group had higher weights across ages. The low coefficient of variation in weight over months of rearing (monitoring: 3.49% - 8.10%, experimental rearing: 0.96% - 3.37%) demonstrated that the difference in weight at the beginning of rearing did not adversely affect the difference in weight of individuals during the rearing process.
Nguyen Kim Ninh (1994)[72] reported that the F 1 herd (HF x crossbred Sind) raised in mass in Ba Vi at 6 months old reached 98.4 ± 1.37 kg, 12 months old was 151.4 ± 1.53 kg, in the experimental herd the corresponding weight was 115.3 ± 3.78 kg and 183.0 ± 5.01 kg. The F 3 herd (HF x crossbred Sind) had corresponding weights according to these ages: 119.1 - 128.9 kg and 191.17 - 200.6 kg.
According to Nguyen Van Thuong and CS (2008)[189], HF cows raised in households in Moc Chau at birth, 6 months and 12 months reached the following weights: 34.42 ± 3.43kg - 35.02 ± 3.41kg, 132.20 ± 11.47kg - 133.30 ± 11.53kg, respectively.
According to Tran Trong Them (2006)[92], the average weight of F2 cows ( HF x crossbred Sind) in Ha Tay, Hanoi and Ho Chi Minh City at birth, 6 months, 12 months, 18 months and 24 months is respectively: 32.46 ± 0.37kg, 128.83 ± 1.54kg,