Hue University of Economics
1.2.3. The relationship between customer satisfaction and service quality
Some researchers believe that service quality and customer satisfaction are similar. Therefore, these two concepts can be used interchangeably. However, many subsequent studies have shown that service quality and customer satisfaction are two distinct concepts. According to Parasuraman et al. (1993), the difference is reflected in the following aspects:
Customer satisfaction is seen as the result, service quality is seen as the cause. Satisfaction is predictive; service quality is an ideal standard.
Customer satisfaction depends on the customer's inherent experience. Meanwhile, service quality depends less on the supplier's experience.
Service quality is related to service delivery, while satisfaction can only be assessed after using the service through evaluating service quality.
Specific criteria for measuring service quality. Meanwhile, to measure satisfaction, other factors such as price, customer experience, etc. need to be considered.
1.3. PREVIOUS RESEARCH MODELS
1.3.1. Service quality research models
1.3.1.1. Gronroos's (1984) technical-functional quality model
In business activities, to achieve customer satisfaction, in service quality management, businesses need to combine both expected quality and perceived quality. Gronroos (1984) believes that a business's service quality is determined by three components: technical quality, functional quality and image. In which:
Technical quality: Is the value that customers actually receive from the supplier's service.
Functional quality: Represents the way the service is delivered to the consumer.
Hue University of Economics
service provider use
Service expectations
CLDV
feel
Service perception
Traditional marketing activities and external influences
Image
Technical quality
Functional quality
Image: plays a very important role for service providers. This factor is built mainly on two components: technical quality and functional quality.
(Source: Nguyen Thanh Cong, Banking University of Ho Chi Minh City, 2010 [4] )
Figure 1. 2: Gronroos's technical quality model
Besides, Gronroos also believes that customer expectations are also influenced by traditional marketing methods and external factors such as customs, habits, word of mouth...
The disadvantage of this model is that it does not provide an explanation or a way to measure functional quality and technical quality.
1.3.1.2. Parasuraman & ctg (1985) gap quality model
Based on the service quality model of Gronroos (1984), Parasuraman & ctg (1985) also built a quality gap model based on different levels. The model gives 5 service quality gaps:
Hue University of Economics
Word of mouth
Personal needs
Experience
Distance 5
CLIENT
Service perception
Distance 4
Transfer service
Information to customers
Distance 3
Convert corporate perception into quality criteria
Distance 2
MARKETER
Company perception of
customer expectations
Service expectations
Distance 1
(Source: Nguyen Thanh Cong, Banking University of Ho Chi Minh City, 2010 [4] )
Figure 1. 3: Parasuraman & ctg (1985) service quality model
Gap 1: Appears when there is a difference between customer expectations and the supplier's perception of customer expectations. This gap appears because the supplier does not clearly understand what the customer wants. This shows that the supplier does not always have a clear understanding of its customers.
Gap 2 (GAP 2): Appears when suppliers have difficulty converting customer perceptions into specific quality criteria due to both subjective and objective reasons, which can come from the expertise of employees but sometimes because customer demands exceed the supplier's ability to meet.
Gap 3: Appears when service staff do not perform
Hue University of Economics
service delivery as defined criteria. From here, it can be seen that employees have an important impact on customers' evaluation of service quality.
Gap 4 (GAP 4): Appears when there are actions that make customers increase their expectations about service quality but then are not performed as committed. These actions can be promotional information, advertising programs that exaggerate service quality compared to reality.
Gap 5: Appears when there is a difference between reality and customer expectations when using the service.
Service quality depends on gap number 5. Gap number 5 depends on gaps 1, 2, 3, 4. Service quality improvement is the adjustment to minimize gap number 5.
1.3.1.3. SERVQUAL service quality model (1988, 1991)
The distance service quality model was further developed, revised and introduced by Parasuraman into the SERVQUAL service quality measurement model (Parasuraman & ctg, 1988, 1991).
This CDL model initially had 10 components including: Reliability; Responsive-ness; Competence, Access, Courtesy, Communication; Credibility; Security; Understanding/Knowing the customer; Tangibles. However, this model was difficult to apply due to its complexity and many unpredictable factors, so Parasuraman & ctg (1988, 1991) combined the correlated variables together and reduced them to 5 components: Tangibles; Reliability; Empathy; Competence; Responsive-ness.
Hue University of Economics
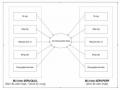
Original 1985 model
1988 calibration model | |
Tangibles | Tangibles |
Reliability | Reliability |
Responsiveness | Responsiveness |
Service capacity (competence) Courtesy Credibility Security Security | Assurance |
Access Communication Understanding/Knowing the customer | Empathy |
Maybe you are interested!
-

 The impact of online banking service quality of Vietnam Development Investment Bank on customer satisfaction in Ho Chi Minh City market - 14
 -
 The impact of online banking service quality of Vietnam Development Investment Bank on customer satisfaction in Ho Chi Minh City market - 2
 -
 The Relationship Between Service Quality and Customer Satisfaction:
 -
 Analysis of Customer Satisfaction with Bidv Hcmc Internet Banking Service Quality
 -
 The Relationship Between Service Quality and Customer Satisfaction

(Source: Zaithaml, parasuraman &Berry (1988))
Figure 1. 4: Relationship between Parasuraman 1985 and 1988 models
Although this model is more complete, it still has some disadvantages that require appropriate adjustments when applying the model to different industries. If applied completely to commercial banks, there are still some inappropriate aspects.
1.3.1.4. Avkiran's (1994) BANKSERV model
Based on the SERVQUAL measurement tool of Parasuraman & ctg (1985), Avkiran (1994) proposed a BANKSERV service quality measurement model at commercial banks in Australia consisting of 4 components with 17 observed variables to measure the operational efficiency of bank branches as well as to predict problems arising in the service provision process. Including: (1) Staff conduct; (2) Credibility; (3) Communication; (4) Access to teller services [4] .
However, the disadvantage of the model is that it is difficult to identify the influencing components.
Hue University of Economics
to CDLV but has not shown the importance of each factor.
1.3.1.5. SERVPERF model of Cronin & Taylor, (1992)
There is also much debate about the use of quality and gap models as a basis for assessing service quality (Carmen, 1990; Babakus & Boller, 1992; Cronin & Taylor, 1992). Cronin and Taylor (1992) with the SERVPERF model, argued that the level of customer perception of the service performance of the business best reflects service quality.
According to the SERVPERF model: Service quality = Perception level
The SERVPERF scale also uses 22 statements similar to the customer perception section in the SERVQUAL model, omitting the expectation section.
1.3.1.6. Some domestic research models
Phan Chi Anh (2013), “Research on service quality assessment models”. The author gives specific assessments of service quality assessment models, points out the advantages and limitations of each model to serve the following studies. The author points out that research on service quality has developed continuously over the past two decades, attracting much attention from scholars and providing valuable findings for society. The author focuses on introducing 7 typical service quality assessment models, analyzing the characteristics of the models, and the results of applying these models to practical research. The synthesis and analysis of these models show that the assessment of service quality depends significantly on the type of service, time factor, customer needs, etc. In addition, customer expectations for specific services also change according to factors such as time, number of times of service use, competition in the industry environment, etc. In addition, the article also points out the limitations of each model to provide reference materials as well as suggestions for new research directions in this field.
Nguyen Thanh Cong (2010), “Models for measuring banking service quality”. From the systematization of 10 measurement models and research results, the article
Hue University of Economics
shows that whether it is a general model or a specific model designed specifically for the banking industry, it cannot be applied in its original form in different regions or countries but needs to be adjusted appropriately. In addition, this article also points out the limitations of the models and issues related to QDLV to help researchers and managers have a basis in choosing appropriate evaluation criteria or measurement models when implementing subsequent research projects.
1.3.2. Customer satisfaction assessment models
1.3.2.1. Customer satisfaction index model (CIS Model) in banking
CSI (Customer Satisfaction Index) is built to measure customer satisfaction for industries and businesses in many developed countries in the world. Building and applying the CSI index of banks helps to build a data system of information on customer satisfaction, as a basis for planning competitive strategies, marketing, branding and trade promotion.
The model is built on the following factors [3] :
Image : This variable is represented by the reputation, prestige, and trust of consumers towards the brand. In the banking sector, image plays a very important role in deciding where to borrow or deposit money.
Expectations : Represents the level of quality that customers expect to receive. This is the result of previous consumer experience or information through communication channels for the product or service.
Perceived quality: There are two types of perceived quality:
(1) perceived product quality (tangible): is the customer's recent consumption assessment of the product and (2) perceived service quality (intangible) is the assessment of related services such as service during and after the sale, supply conditions, delivery... of the product itself.
Perceived value: The difference between value and cost.
Hue University of Economics
is the perceived value that banking services bring to customers.
Loan Rate: The bank rate is considered as the price factor for a product. This variable plays a mediating role in the relationship between image, expectations and perceived quality with customer perceived value.
Loyalty:
This is a variable related to the future of a business. Whether customers continue to buy products or consume services or not. Whether customers are willing to recommend friends and relatives to use the service or not.
1.3.2.2. Some domestic studies
Ho Huy Tuu (2014), "Customer satisfaction and loyalty to banking services in Hau Giang province". The author proposed hypotheses about service quality, satisfaction and complaints affecting customer loyalty, all of which were accepted. Based on satisfaction, the author built a model to evaluate customer loyalty by establishing a regression model with different levels of influence of different factors. From there, propose appropriate solutions for banks in Hau Giang province.
Huynh Thi Thuy Phuong (2010), “Improving customer satisfaction with Connect 24 card service of Joint Stock Commercial Bank for Foreign Trade - Ho Chi Minh City Branch”. Through the research, the author surveys which issues customers are not satisfied with and which criteria are important for the bank’s Connect 24 card service. From there, proposes some solutions to improve customer satisfaction with ATM card service of Joint Stock Commercial Bank for Foreign Trade - Ho Chi Minh City Branch
1.4. PROPOSED RESEARCH MODEL
1.4.1. Proposed research model
Based on previous research models, researchers evaluate service quality based on analyzing the impact of influencing factors. The SERVQUAL model is taken as the main model for the author to build.