Table 3.1: Description of variables used in model 1
Variable
How to calculate | Expected | |
Dependent variable measuring RRTD: Non-performing loan ratio (NPL) | Bad debt/Total outstanding debt | |
Independent variable Bank internal | ||
RRTD Reserve (LLR) | RRTD Provision/Total Outstanding Debt | + |
Operating Cost Inefficiency (EFF) | Operating Expenses/Operating Income | + |
Leverage (LEV) | Total mobilized/Total assets | + |
Non-interest income (NII) | Non-interest income/Total income | - |
Size | Logarithm of Total Assets | + |
Return on Equity (ROE) | Profit after tax/Equity | - |
Macroeconomic variables | ||
Inflation (INF) | Inflation rate | + |
GDP growth (GGDP) | GDP growth rate | - |
Nominal Interest Rate (INR) | Nominal interest rate | + |
Unemployment Rate (UNR) | Unemployment rate | + |
Exchange Rate (EXR) | VND/USD exchange rate | - |
Maybe you are interested!
-

 The impact of credit risk on business performance of Vietnamese commercial banks - 1
 -
 The Impact of Macroeconomic Factors on Credit Risk at Vietnamese Commercial Banks from 2007 to 2014
 -
 Factors affecting credit risk in credit card business at Vietnam Joint Stock Commercial Bank for Industry and Trade - 14
 -
 Perfecting the Last Line of Defense (Internal Control) in the 3 Lines of Defense Model, Perfecting the Early Warning System for Credit Risk (Ews) to
 -
 Impact of liquidity risk, credit risk on the sustainability of Vietnam Joint Stock Commercial Bank in 2008 - 2018 - 12
Source: Author compiled from relevant studies
3.2 MODEL OF IMPACT OF CREDIT RISK ON BUSINESS PERFORMANCE OF COMMERCIAL BANKS
In the studies of authors Nicolae Petria (2013), Hasan Ayaydin (2014), Aremu Mukaila Ayanda (2013), when studying the factors affecting the business performance of commercial banks, the above studies all concluded: the ratio of bad debt and RRTD provisions have an impact on the business performance of commercial banks. Based on the model of the above authors, the author built a model to study the impact of RRTD on the business performance of banks. Using the ROE variable as the dependent variable, RRTD is represented by the variable of bad debt ratio (NPL) and RRTD provisions ratio (LLR), other control variables are also included in the model through the vector X. The multivariate regression model used, referring to the studies of Athanasolou et al. (2006), Aremu Mukaila Ayanda (2013), Hasan Ayaydin (2014), Alshatti (2015) specifically as follows:
(ROE it , ROA it ) = α+ β 1 NPL i,t + β 2 PLL i,t + β j X i,t + v i + ε i,t (2)
In there:
α is the intercept coefficient
β1 and β2 are the impacts of NPL and LLR on ROE and ROA.
X i,t is a vector of variables: including internal variables in the bank: EFF i,t , LEV i,t ,
NII i,t , SIZE i,t and macro variables: GGDP t , INR t , INF t , UNR t , EXR t β j is the impact of independent variables i on ROE, ROA
v i are unobserved individual characteristics among commercial banks. ε i,t are the residuals of the model.
RRTD is one of the main variables affecting the performance of commercial banks, because it represents the probability of borrowers being unable to fully perform their obligations to the bank. Concerned with the impact of RRTD on the performance of banks, the author uses a multivariate regression model with the main independent variables in the model.
Figure 2 is the non-performing loan ratio (NPL) and the loan loss provision ratio (LLR). The author expects a negative impact of these two variables on the bank's operating performance.
The author will estimate by four Pooed OLS, Fixed Effect and Random Effect models and FGLS on panel data to examine the impact of RRTD on the business performance of commercial banks. The hypotheses of the regression model by OLS method will also be considered and corrected to bring the model results with the best estimates for analysis for the research paper.
Previous studies have used various approaches to measure the performance of banks. Two ratios commonly used to measure performance are the ROE ratio (return on equity), and the ROA ratio (return on assets). Athanasoglou et al. (2005), argue that compared to using ROE, using ROA will include in assets the risks arising from the use of debt leverage - this is the key factor that increases the profitability of banks. Another disadvantage of calculating ROA is the inclusion of off-balance sheet accounts, which have many important sources affecting profits. Therefore, Goddard (2004) argues that using ROE is more appropriate than ROA. In this study, using ROE as the dependent variable and used to measure the performance of commercial banks. The higher the ROE, the more efficient the bank's business operations.
Hypothesis 12 : There is a negative correlation between NPL, LLR and ROE and
ROA
Table 3.2: Description of variables used in model 2
Variable
How to calculate | Expected | |
Return on Equity (ROE) | Profit after tax/Equity | |
Return on Assets (ROA) | Profit after tax/Total assets | |
Non-performing loan ratio (NPL) | Bad debt/Total outstanding debt | - |
RRTD Reserve (LLR) | Credit Loss Provision/Total Outstanding Loan | - |
Leverage (LEV)
Total mobilized/Total assets | - | |
Non-interest income (NII) | Non-interest income/Total income | + |
Size | Logarithm of Total Assets | + |
Inefficient (EFF) | Operating Expenses/Operating Income | - |
Macroeconomic variables | ||
Inflation (INF) | Inflation rate | +/- |
GDP growth (GGDP) | GDP growth rate | + |
Nominal Interest Rate (INR) | Nominal interest rate | - |
Unemployment Rate (UNR) | Unemployment rate | - |
Exchange Rate (EXR) | VND/USD exchange rate | +/- |
Source: author compiled from relevant studies
3.3 DATA
Internal bank data is taken from audited financial statements of 26 Vietnamese commercial banks from 2005 to 2015. The author uses data from 26 commercial banks, the total assets of 26 commercial banks account for over 75% of total assets of commercial banks in Vietnam, ensuring representativeness for Vietnamese commercial banks. At the same time, because the data of some commercial banks is not fully published, the author has difficulty in collecting complete data of commercial banks for a long period from 2005 to 2015. The selection of representative samples as above was also used by Louzis et al (2010) in the study of macroeconomic factors and bank-side factors affecting bad debt at the 9 largest Greek banks in the years 2003-2009. Nicolae Petria (2013) studied the factors affecting bank profits of 27 EU countries from 2004-2011. Or in Vietnam, the authors Do Quynh Anh and Nguyen Duc Hung (2013) used panel data to study 10 banks from 2005 to 2011 on the factors affecting bad debt of
Vietnamese commercial banks. Macro data extracted from ADB Indicators from 2005 to 2015.
CHAPTER 3 SUMMARY
The content of this chapter analyzes and selects a regression model that is suitable for the research objectives. Measures factors affecting RRTD of Vietnamese commercial banks with dynamic panel data; the dependent variable is the bad debt ratio representing RRTD. Researches the impact of RRTD on business performance. Macro variables and internal variables in the bank have been analyzed and selected in turn. The hypotheses are presented specifically to determine the direction of the impact of the variables.
CHAPTER 4: RESEARCH RESULTS AND DISCUSSION
4.1. MACROECONOMIC SITUATION
According to empirical studies, macroeconomic factors have an impact on RRTD as well as the business performance of commercial banks. In recent times, Vietnam's economy has fluctuated a lot due to the impact of the global financial crisis, in the context of Vietnam's international integration in many economic fields. Changes in GDP growth, inflation, interest rates, and exchange rates will change the macroeconomic situation. Changes in monetary policy and interest rates will affect the bank's credit channel, thereby creating bad debt, affecting the business performance of commercial banks.
- GDP growth
Chart 4.1: Vietnam's GDP growth
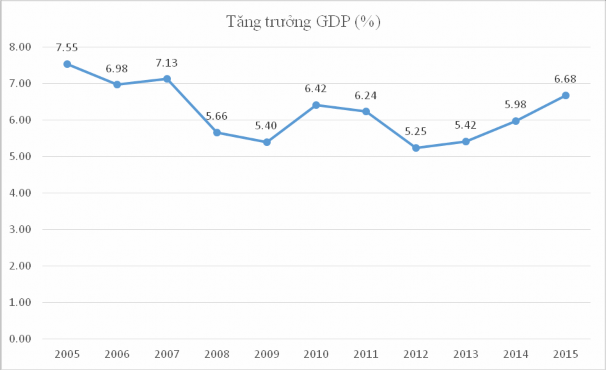
Source: VietNam Key Indicators (2015), ADB
Vietnam's GDP growth has been on a downward trend from 2005 to 2009. From 7.55% in 2005, GDP growth was only 5.4% in 2009. Since 2009, GDP has grown to 6.42% and 6.24% in the years
2010 and 2011. Vietnam's GDP growth was lower than 6% in the following years, specifically: 5.25% in 2012, 5.42% in 2013 and 5.98% in 2014. In 2015, GGP growth exceeded 6.68%, which is an impressive growth rate in the past 7 years. In recent years, inflation has been well controlled, GDP growth has been stable and nominal interest rates have been kept at reasonable levels.
- Inflation:
Chart 4.2: Inflation rate in Vietnam
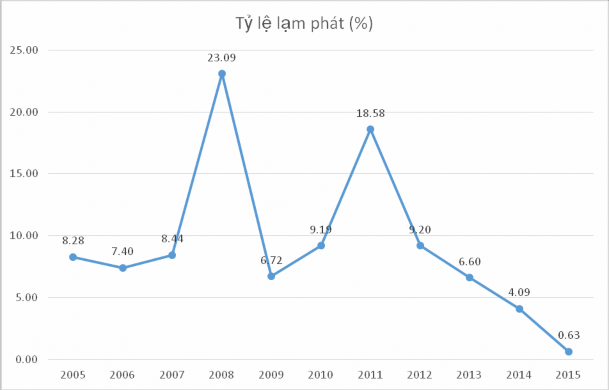
Source: VietNam Key Indicators (2015), ADB
Before the 2008 global economic crisis, Vietnam's inflation rate was stable at a single digit. In 2006, Vietnam's inflation rate decreased from 8.28% the previous year to 7.4%. In 2007, inflation increased sharply as soon as Vietnam joined the WTO (January 11, 2007), and at the same time due to the impact of the global economic crisis in 2008. In 2008, Vietnam's inflation rate increased very high and reached 23%. The State Bank of Vietnam took many measures to control inflation, including raising interest rates to double digits in 2008. Entering the year
In 2009, with efforts to control inflation, Vietnam's inflation rate decreased sharply and this was also the time when economic growth was slower than previous years.
After the global financial crisis, from 2009 onwards, the Government implemented a policy of stimulating interest rates and increasing money supply, leading to inflation rising again in 2010 and 2011. Notably, in 2011, Vietnam's inflation rate once again exceeded double digits, reaching 18.58%. The State Bank of Vietnam continued to increase interest rates to control inflation once again. Then, in 2012, 2013 and 2014, the inflation rate dropped to double digits and reached 4.09% in 2014. In 2015, the inflation rate dropped to its lowest level in the past 10 years, reaching only 0.63%.
- Interest rate
Chart 4.3: Nominal interest rates in Vietnam
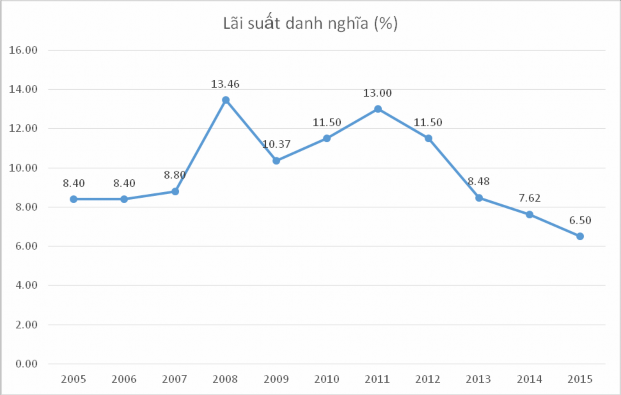
Source: VietNam Key Indicators (2015), ADB
Vietnam's nominal interest rates have developed similarly to the inflation situation. Before the 2008 crisis, Vietnam's nominal interest rates were between 8.4 and 8.8%. By 2008, in the face of high inflation, Vietnam's nominal interest rates