STT
Factor | Retained observation variables | Observable variables are eliminated. | Variable classification | |
1 | SWR | SWR5, DATR4, SWR1, SWR3, DATR5, SWR2, DATR3, DATR2, SWR4, DATR1 (10 variable) | None (SWR and DATR factors converge) | Independence |
2 | HWR | HWR2, HWR5, HWR4, HWR3, HWR1 (5 variables) | Do not have | Independence |
3 | ITAR | ITAR4, ITAR2, ITAR1, ITAR3 (4 variables) | Do not have | Independence |
4 | HRR | Do not have | All | Independence |
5 | MCR | MCR2, MCR3, MCR1, MCR4 (4 Variables) | Do not have | Independence |
6 | OCR | OCR3, OCR1, OCR2 (3 Variables) | OCR4 and OCR5 | Independence |
7 | AISQ | AISQ7, AISQ3, AISQ9, AISQ4, AISQ8, AISQ5, AISQ6 (7 Variables) | AISQ1 and AISQ2 | Dependent/ Intermediary |
Maybe you are interested!
-
 The impact of information technology risks on the quality of accounting information in enterprises in Vietnam - 10
 -
 The impact of information technology risks on the quality of accounting information in enterprises in Vietnam - 1
 -
 The impact of information technology risks on the quality of accounting information in enterprises in Vietnam 1738937919 - 35
 -
 Situation of Information Technology Application in Enterprises
 -
 The Impact of Accounting Information System Quality on Operational Performance

STT
Factor | Retained observation variables | Observable variables are eliminated. | Variable classification | |
8 | AIQ | AIQ4, AIQ8, AIQ9, AIQ5, AIQ1, AIQ3, AIQ7, AIQ2 (8 Variable) | AIQ6 | Dependent |
Total number of independent observed variables: 26 variables | ||||
Total number of dependent observed variables: 15 variables | ||||
fake
Source: Collected by author
Thus, Cronbach's Alpha analysis shows that the scales are all reliable.
This shows that this second draft survey questionnaire can be used well for official quantitative research and from here we have the official questionnaire. In addition, the preliminary EFA analysis results also demonstrated that the factors have high discriminative and convergent properties. In particular, there are 2 special cases where the observed variables of the 2 initial independent factors, Software Risk and Data Risk, have converged, meaning that the observed variables are correlated with each other, explaining 1 factor and the Human Resource Risk factor does not meet the requirements so it is temporarily removed. The formation of a new factor and the complete removal of a factor in the model will be accurately decided when testing again on a larger sample size in the official research stage.
4. Formal research
Research model and scale of formal research concepts
Through preliminary quantitative results, it shows that the scales have high reliability and the second draft scale is qualified to become the official scale for
9 NC concepts with 51 observed variables. In the preliminary EFA analysis step, the observed variables of the two factors software risk and data risk converged to the same factor, but the Human resource risk factor was at risk of being eliminated from the model because it did not meet the convergence requirements when analyzing EFA. This shows that new factors can be formed and the NC model can be adjusted. However, the sample size used in the preliminary quantitative research is very small (n = 100), so to determine for sure whether the model needs to be adjusted or not, the author still uses the NC model as proposed at the beginning of chapter 2 for the official research. And if adjustment is needed, it will be adjusted later.
Descriptive statistical results
According to Hair et al. (2019), when the study uses both EFA and CFA analysis techniques, priority should be given to sampling according to EFA analysis because EFA analysis requires a large enough sample size to achieve reliability. The formula from Hair et al.'s research experience shows how to select a sample according to a 5:1 ratio between the number of observations: the number of measured variables. So the sample required according to this study is 51*5 = 255 observations.
In fact, 408 responses were collected (1 response per company). After filtering out the unqualified responses (40 responses) due to respondents answering the same result to many different questions; some responses from universities, secondary schools, and hospitals were also eliminated because they were not suitable. The remaining responses that met the standards were 368 > 255 (minimum sample size), so this sample size can be said to be satisfactory and representative of the research population.
Statistics on some characteristics of survey respondents Table 4.5 – Some characteristics of survey respondents
Description
about survey respondents
Frequency | Rate (%) | |
Job position | 368 | 100 |
Accountant | 218 | 59.2 |
Financial and accounting manager | 43 | 11.7 |
maths | 69 | 18.8 |
General Accounting | 38 | 10.3 |
Other | ||
Years of service | 368 | 100 |
< 5 years | 234 | 63.6 |
From 5 years to ≤ 10 years | 99 | 26.9 |
> 10 years | 35 | 9.5 |
Level | 368 | 100 |
College | 32 | 8.7 |
University | 311 | 84.5 |
Postgraduate | 25 | 6.8 |
Year old | 368 | 100 |
< 30 | 249 | 67.7 |
30 – 40 | 104 | 28.3 |
> 40 | 15 | 4.1 |
Source: Results collected through software analysis
SPSS
The majority of respondents are accountants working in companies, accounting for 59.2%; these have the lowest working experience (from 2 years to 5 years) and the majority are quite young, between 25 and 29 years old (67.7%). Next, there are general accountants accounting for 18.8%, the majority of people holding this position in the company are between 30 and under 40 years old (28.3%); this is understandable because at this age
then there is
consider holding the position
This mind by accumulated
get some
terrible
working experience. Meanwhile, financial and accounting managers (including chief accountants and financial directors) account for 11.7%, the age of this group is usually between 35 and 40 and over 40, a few of them are around 30. The rest are mainly directors over 40 and auditors (10.3%). In the 2 groups holding key positions in the company are accounting and financial managers and directors.
need to be over 30 years old, even 40 and over 40 because they need experience, management skills and especially their personality is more mature and decisive. In terms of education level, most of the surveyed subjects have university and postgraduate degrees (91.3%), the remaining few have college degrees (8.7%).
Statistics on some characteristics of enterprises participating in the survey Table 4.6 - Some characteristics of enterprises participating in the survey
Descriptive features of
Enterprises participating in the survey
Frequency | Rate (%) | |
Type of business | 368 | 100 |
Private enterprise | 39 | 10.6 |
State-owned enterprise | 14 | 3.8 |
LLC | 149 | 40.5 |
Joint stock company | 123 | 33.4 |
100% foreign owned enterprise | 35 | 9.5 |
Other | 8 | 2.2 |
Business Field | 368 | 100 |
Trade/service | 243 | 66 |
Manufacture | 47 | 12.8 |
Build | 29 | 7.9 |
Other | 49 | 13.3 |
Enterprise size | 368 | 100 |
Small | 144 | 39.1 |
Fit | 97 | 26.4 |
Big | 127 | 34.5 |
Software used | 368 | 100 |
Accounting software | 263 | 71.5 |
ERP | 57 | 15.5 |
Other | 48 | 13 |
Source: Results collected through software analysis
SPSS
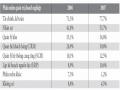
The statistical analysis of the enterprises participating in the survey shows that the LLC type accounts for the majority (40.5%); followed by joint stock enterprises (33.4%). Meanwhile, 100% foreign-owned enterprises and private enterprises have approximately the same proportion (9.5% compared to 10.6%). Other enterprises with a small number are training centers and project management boards (2.2%).
The surveyed enterprises have 144 small enterprises (39.1%) and the majority of enterprises operate in the field of trade/services. This is consistent with the current situation in Vietnam where the majority of small-scale enterprises tend to choose the business field of trade/services for convenience in organizing and managing production and business. The remaining enterprises operate in the fields of production, construction and others.
(training, auditing and banking) have nearly equal proportions of 12.8%, respectively.
7.9% and 13.3%. The number of medium and large enterprises participating in the survey in this study is also quite large (224 enterprises, accounting for 60.9%). In fact, it shows that medium and large enterprises often pay great attention to investing in IT to serve management work to aim for competitive strengths and achieve the desired efficiency, so there is a tendency that medium and large enterprises have a more systematic IT organization than small enterprises.
And finally, all enterprises participating in the survey are using software in their management (100%). These include accounting, ERP, auditing and banking software. This proves that enterprises have been increasingly focusing on applying IT to organize and implement IT systems in their enterprises.
For more detailed statistics on the subjects and companies participating in the survey, please see the results in Appendix 21, the preliminary and official quantitative NC survey form (Appendix 22) and the List of companies participating in the official survey (Appendix 23).
Assessing the reliability of the scale
At the formal research level, Cronbach's alpha analysis was further conducted to confirm the reliability of the scale, but with a larger sample size of n = 368. The reliability details of each scale are shown as follows:
Hardware Risk Scale Reliability
The results this time show that because the Corrected ItemTotal Correlation coefficient for all variables (Corrected ItemTotal Correlation) is > 0.3 and the Cronbach's Alpha coefficient for the factor is > 0.6, no observed variables are eliminated. Therefore, the hardware risk scale is reliable and all 5 observed variables are retained. (Appendix 24)
Reliability of the Software Risk Scale
This scale shows that, as before, the variable SWR6 has a Corrected ItemTotal Correlation of 0.270 <0.3; therefore, this variable should be removed and rerun a second time. Most software users understand and operate the software because they are directly trained on-site in a "hands-on" manner, and when they need to resolve business or problems, they are consulted by consultants from the consulting side or software suppliers via phone or connected via remote control software such as Teamviewer, Ultraviewer, ... Therefore, the user manual is no longer too important to users, so it is acceptable that the variable SWR6 related to the software user manual is removed. (Appendix 25)
The second time shows that because the total item correlation coefficient for all variables (Corrected ItemTotal Correlation) is > 0.3 and the Cronbach's Alpha coefficient of the factor is > 0.6, no more observed variables are eliminated. Therefore, the Software Risk scale is reliable with 5 observed variables. (Appendix 26)
Reliability of the Data Risk Scale
For the Data Risk scale, no variable was eliminated because the total item correlation coefficient of all variables (Corrected ItemTotal Correlation) was > 0.3 and the coefficient
Cronbach's Alpha of the factor > 0.6. So the Data Risk scale is reliable. (Appendix 27)
Reliability of the IT Advancement Application Risk Scale
This scale is similar, no observed variables were eliminated due to Corrected
ItemTotal Correlation of all variables > 0.3 and Cronbach's Alpha of the factor > 0.6. So the scale of Risk of applying IT advances is reliable. (Appendix 28) Reliability of the scale of Risk of human resources
Appendix 29 shows that no observed variables were eliminated because the Corrected ItemTotal Correlation of the variables were > 0.3 and the Cronbach's Alpha of the factor was > 0.6. Thus, the Human Resource Risk scale achieved reliability with 4 observed variables.
Reliability of the Management Commitment Risk Scale
This scale does not eliminate any observed variables because the Corrected ItemTotal Correlation of all variables is > 0.3 and Cronbach's Alpha of the factor is > 0.6. Therefore, the Risk Management Commitment scale is reliable with 4 observed variables retained. (Appendix 30)
Reliability of the Organizational Culture Risk Scale
Appendix 31 shows that no observed variables are eliminated because the Corrected ItemTotal Correlation of all variables is > 0.3 and the Cronbach's Alpha coefficient of the factor
> 0.6. So the Organizational Culture Risk scale is reliable with 5 observed variables.
Reliability of the CLHTTTKT scale
Appendix 32 shows that no observed variables are eliminated because the Corrected ItemTotal Correlation of all variables is > 0.3 and the Cronbach's Alpha coefficient of the factor
> 0.6. So the CLHTTTKT scale achieves reliability with 9 observed variables.
Reliability of the CLTTKT scale
No observed variables were eliminated because the Corrected ItemTotal Correlation of all variables was > 0.3 and the Cronbach's Alpha coefficient of the factor was > 0.6. So the CLTTKT scale was reliable. (Appendix 33)