3. Descriptive statistics of some characteristics of employee group respondents
sex
Freq. | Percent | Cum. | |
0 | 203 | 59.01 | 59.01 |
1 | 141 | 40.99 | 100.00 |
Total | 344 | 100.00 |
Maybe you are interested!
-
 Research on the relationship between social responsibility, brand value and financial performance of joint stock commercial banks in the Mekong Delta - 24
 -
 The relationship between social responsibility, green marketing strategy, corporate reputation and business performance - Research on tourism and travel businesses in Ho Chi Minh City - 24
 -
 Relationship Between Research Variables in the Model
 -
 Building a Research Model of Factors Affecting Agribank's Brand Value
 -
 Social Media Marketing Activities for Nestle's Nestcafé Brand in Vietnam
fresh
Freq. | Percent | Cum. | |
1 | 203 | 59.01 | 59.01 |
2 | 109 | 31.69 | 90.70 |
3 | 25 | 7.27 | 97.97 |
4 | 7 | 2.03 | 100.00 |
Total | 344 | 100.00 |
elastic
Freq. | Percent | Cum. | |
1 | 9 | 2.62 | 2.62 |
2 | 120 | 34.88 | 37.50 |
3 | 115 | 33.43 | 70.93 |
4 | 100 | 29.07 | 100.00 |
Total | 344 | 100.00 |
virgin
Freq. | Percent | Cum. | |
1 | 1 | 0.29 | 0.29 |
2 | 318 | 92.44 | 92.73 |
3 | 25 | 7.27 | 100.00 |
Total | 344 | 100.00 |
masonamlv
Freq. | Percent | Cum. | |
1 | 53 | 15.41 | 15.41 |
2 | 175 | 50.87 | 66.28 |
3 | 81 | 23.55 | 89.83 |
4 | 35 | 10.17 | 100.00 |
Total | 344 | 100.00 |
4. Test results by Cronbach's Alpha analysis of employee group
average item-test item-rest interitem
Item
Obs | Sign | correlation | correlation | covariance | alpha | |
csr101 | 344 | + | 0.8007 | 0.6718 | .3380243 | 0.7968 |
csr102 | 344 | + | 0.7377 | 0.5934 | .3732894 | 0.8181 |
csr103 | 344 | + | 0.8098 | 0.6746 | .3261817 | 0.7960 |
csr104 | 344 | + | 0.8291 | 0.7145 | .3250206 | 0.7846 |
csr105 | 344 | + | 0.7159 | 0.5527 | .3773773 | 0.8290 |
Test scale | .3479787 0.8382 | |||||
average item-test item-rest interitem
Item
Obs | Sign | correlation | correlation | covariance | alpha | |
csr201 | 344 | + | 0.8630 | 0.7901 | .5811852 | 0.8807 |
csr202 | 344 | + | 0.8363 | 0.7505 | .5927156 | 0.8870 |
csr203 | 344 | + | 0.8234 | 0.7448 | .6234736 | 0.8880 |
csr204 | 344 | + | 0.8108 | 0.7218 | .6189174 | 0.8910 |
csr205 | 344 | + | 0.7835 | 0.6941 | .6476981 | 0.8951 |
csr206 | 344 | + | 0.8278 | 0.7394 | .5991737 | 0.8886 |
Test scale | .6105273 0.9054 | |||||
average item-test item-rest interitem
Item
Obs | Sign | correlation | correlation | covariance | alpha | |
csr301 | 344 | + | 0.7081 | 0.4845 | .2581489 | 0.6877 |
csr302 | 344 | + | 0.6645 | 0.4139 | .2791333 | 0.7189 |
csr303 | 344 | + | 0.7135 | 0.5522 | .2707429 | 0.6654 |
csr304 | 344 | + | 0.6960 | 0.5028 | .2700282 | 0.6792 |
csr305 | 344 | + | 0.7090 | 0.5326 | .2678218 | 0.6695 |
Test scale | .269175 0.7300 | |||||
average item-test item-rest interitem
Item
Obs | Sign | correlation | correlation | covariance | alpha | |
csr401 | 344 | + | 0.8081 | 0.4890 | .2381687 | 0.5621 |
csr402 | 344 | + | 0.8042 | 0.5379 | .2256255 | 0.4886 |
csr403 | 344 | + | 0.7090 | 0.4188 | .3607278 | 0.6439 |
Test scale | .2748407 0.6657 | |||||
average item-test item-rest interitem
Item
Obs | Sign | correlation | correlation | covariance | alpha | |
csr501 | 344 | + | 0.8554 | 0.6564 | .3181911 | 0.6497 |
csr502 | 344 | + | 0.8510 | 0.6445 | .325039 | 0.6631 |
csr503 | 344 | + | 0.7867 | 0.5416 | .4333345 | 0.7732 |
Test scale | .3588548 0.7769 | |||||
average item-test item-rest interitem
Item
Obs | Sign | correlation | correlation | covariance | alpha | |
ebbe01 | 344 | + | 0.7470 | 0.6552 | .4890965 | 0.8828 |
ebbe02 | 344 | + | 0.7794 | 0.7089 | .4959037 | 0.8783 |
ebbe03 | 344 | + | 0.7419 | 0.6583 | .5009214 | 0.8825 |
ebbe04 | 344 | + | 0.8257 | 0.7634 | .4762466 | 0.8727 |
ebbe05 | 344 | + | 0.7483 | 0.6634 | .495867 | 0.8819 |
ebbe06 | 344 | + | 0.7311 | 0.6400 | .4987513 | 0.8841 |
ebbe07 | 344 | + | 0.7098 | 0.6093 | .5008826 | 0.8872 |
ebbe08 | 344 | + | 0.7954 | 0.7068 | .4613158 | 0.8783 |
Test scale | .4898731 0.8943 | |||||
5. EFA factor analysis results for the concepts of Social Responsibility and Brand Value – Employee group
Number of obs = | 344 | |
Method: principal-component factors | Retained factors = | 5 |
Rotation: (unrotated) | Number of params = | 100 |
Factor
Value | Difference | Proportion | cumulative | |
Factor1 | 7.00030 | 3.83670 | 0.3182 | 0.3182 |
Factor2 | 3.16360 | 1.60324 | 0.1438 | 0.4620 |
Factor3 | 1.56036 | 0.22365 | 0.0709 | 0.5329 |
Factor4 | 1.33671 | 0.30962 | 0.0608 | 0.5937 |
Factor5 | 1.02709 | 0.16529 | 0.0467 | 0.6404 |
Factor6 | 0.86180 | 0.08873 | 0.0392 | 0.6795 |
Factor7 | 0.77308 | 0.08114 | 0.0351 | 0.7147 |
Factor8 | 0.69194 | 0.05081 | 0.0315 | 0.7461 |
Factor9 | 0.64113 | 0.09182 | 0.0291 | 0.7753 |
Factor10 | 0.54931 | 0.05832 | 0.0250 | 0.8002 |
Factor11 | 0.49099 | 0.01432 | 0.0223 | 0.8226 |
Factor12 | 0.47667 | 0.03558 | 0.0217 | 0.8442 |
Factor13 | 0.44109 | 0.01751 | 0.0200 | 0.8643 |
Factor14 | 0.42358 | 0.02040 | 0.0193 | 0.8835 |
Factor15 | 0.40318 | 0.03695 | 0.0183 | 0.9019 |
Factor16 | 0.36623 | 0.01995 | 0.0166 | 0.9185 |
Factor17 | 0.34628 | 0.00752 | 0.0157 | 0.9342 |
Factor18 | 0.33877 | 0.02315 | 0.0154 | 0.9496 |
Factor19 | 0.31562 | 0.03096 | 0.0143 | 0.9640 |
Factor20 | 0.28465 | 0.00827 | 0.0129 | 0.9769 |
Factor21 | 0.27639 | 0.04516 | 0.0126 | 0.9895 |
Factor22 | 0.23123 | . | 0.0105 | 1.0000 |
LR test: independent vs. saturated: chi2(231) = 3460.45 Prob>chi2 = 0.0000
Kaiser-Meyer-Olkin measure of sampling adequacy
Variable
kmo | |
csr101 | 0.8200 |
csr102 | 0.8020 |
csr103 | 0.8529 |
csr104 | 0.8338 |
csr105 | 0.9067 |
csr201 | 0.9064 |
csr202 | 0.9364 |
csr203 | 0.9205 |
csr204 | 0.9300 |
csr205 | 0.9192 |
csr206 | 0.9347 |
csr301 | 0.9232 |
csr302 | 0.9240 |
csr303 | 0.9102 |
csr304 | 0.8702 |
csr305 | 0.8932 |
csr401 | 0.8694 |
csr402 | 0.8782 |
csr403 | 0.8811 |
csr501 | 0.8820 |
csr502 | 0.8859 |
csr503 | 0.9364 |
Overall | 0.8968 |
Rotated factor loadings (pattern matrix) and unique variances
Variable
Factor1 | Factor2 | Factor3 | Factor4 | Factor5 | Uniqueness | |
csr101 | 0.8050 | 0.3273 | ||||
csr102 | 0.7476 | 0.4105 | ||||
csr103 | 0.7714 | 0.3544 | ||||
csr104 | 0.8118 | 0.3073 | ||||
csr105 | 0.6347 | 0.4968 | ||||
csr201 | 0.8410 | 0.2496 | ||||
csr202 | 0.7782 | 0.3102 | ||||
csr203 | 0.8234 | 0.2929 | ||||
csr204 | 0.7529 | 0.3353 | ||||
csr205 | 0.7668 | 0.3643 | ||||
csr206 | 0.7843 | 0.2996 | ||||
csr301 | 0.5749 | |||||
csr302 | 0.7090 | 0.3601 | ||||
csr303 | 0.6318 | 0.4503 | ||||
csr304 | 0.7894 | 0.3157 | ||||
csr305 | 0.6872 | 0.3752 | ||||
csr401 | 0.7748 | 0.3260 | ||||
csr402 | 0.7807 | 0.3131 | ||||
csr403 | 0.5459 | 0.4569 | ||||
csr501 | 0.8064 | 0.2911 | ||||
csr502 | 0.8119 | 0.2670 | ||||
csr503 | 0.5509 | 0.4336 |
(blanks represent abs(loading)<.5)
Number of obs = | 344 | |
Method: principal-component factors | Retained factors = | 1 |
Rotation: (unrotated) | Number of params = | 8 |
Factor
Value | Difference | Proportion | cumulative | |
Factor1 | 4.63390 | 3.73806 | 0.5792 | 0.5792 |
Factor2 | 0.89584 | 0.30335 | 0.1120 | 0.6912 |
Factor3 | 0.59249 | 0.12121 | 0.0741 | 0.7653 |
Factor4 | 0.47128 | 0.02336 | 0.0589 | 0.8242 |
Factor5 | 0.44792 | 0.06620 | 0.0560 | 0.8802 |
Factor6 | 0.38172 | 0.05986 | 0.0477 | 0.9279 |
Factor7 | 0.32185 | 0.06685 | 0.0402 | 0.9681 |
Factor8 | 0.25500 | . | 0.0319 | 1.0000 |
LR test: independent vs. saturated: chi2(28) = 1402.41 Prob>chi2 = 0.0000
Kaiser-Meyer-Olkin measure of sampling adequacy
Variable
kmo | |
ebbe01 | 0.9360 |
ebbe02 | 0.8966 |
ebbe03 | 0.9291 |
ebbe04 | 0.8866 |
ebbe05 | 0.9367 |
ebbe06 | 0.8513 |
ebbe07 | 0.9285 |
ebbe08 | 0.8647 |
Overall | 0.9014 |
average item-test item-rest interitem
Item
Obs | Sign | correlation | correlation | covariance | alpha | |
csr303 | 344 | + | 0.7347 | 0.4484 | .3812886 | 0.7178 |
csr304 | 344 | + | 0.8360 | 0.5853 | .2336091 | 0.5531 |
csr305 | 344 | + | 0.8168 | 0.5675 | .2615432 | 0.5777 |
Test scale | .2921469 0.7127 | |||||
average item-test item-rest interitem
Item
Obs | Sign | correlation | correlation | covariance | alpha | |
csr302 | 344 | + | 0.8292 | 0.6472 | .3588548 | 0.7769 |
csr501 | 344 | + | 0.8057 | 0.6516 | .4032138 | 0.7698 |
csr502 | 344 | + | 0.8302 | 0.6895 | .382896 | 0.7524 |
csr503 | 344 | + | 0.7647 | 0.5970 | .4400129 | 0.7941 |
Test scale | .3962444 0.8201 | |||||
6. Results of confirmatory factor analysis CFA of employee group
Fit statistic
Value | Description | |
Likelihood ratio chi2_ms(413) p > chi2 chi2_bs(465) p > chi2 | 1011.706 | model vs. saturated |
0.000 | ||
6639.656 | baseline vs. saturated | |
0.000 | ||
Population error RMSEA 90% CI, lower bound upper bound close | 0.065 | Root mean squared error of approximation |
0.060 | ||
0.070 | ||
0.000 | Probability RMSEA <= 0.05 | |
Information criteria | ||
AIC | 23644.741 | Akaike's information criterion |
BIC | 24082.574 | Bayesian information criterion |
Baseline comparison | ||
CFI | 0.903 | Comparative fit index |
TLI | 0.891 | Tucker-Lewis index |
Size of residuals SRMR | 0.054 | Standardized root mean squared residual |
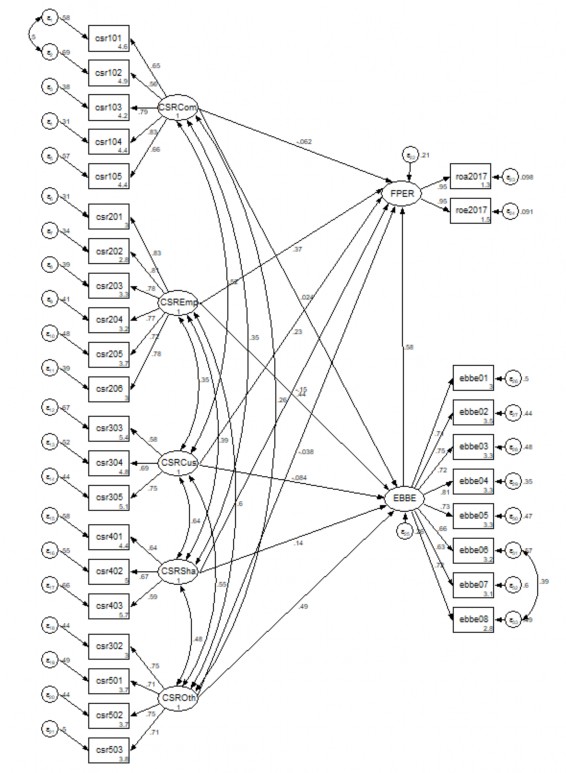
7. SEM analysis results of employee group
Structural equation model Number of obs = 344
Estimation method = ml
Log likelihood = -11647.913
( 1) [roa2017]FPER = 1
( 2) [ebbe01]EBBE = 1
( 3) [csr101]CSRCom = 1
( 4) [csr201]CSREmp = 1
( 5) [csr303]CSRCus = 1
( 6) [csr401]CSRSha = 1
( 7) [csr302]CSROth = 1
Coef. | OIM Std. Err. | z | P>|z| | [95% Conf. | Interval] | |||
Structural | ||||||||
FPER <- | ||||||||
EBBE | .4248473 | .0687247 | 6.18 | 0.000 | .2901494 | .5595451 | ||
CSRCom | -.0605672 | .0461217 | -1.31 | 0.189 | -.150964 | .0298296 | ||
CSREmp | .2214039 | .0380419 | 5.82 | 0.000 | .1468432 | .2959646 | ||
CSRCus | .275264 | .0932588 | 2.95 | 0.003 | .09248 | .458048 | ||
CSRSha | -.1363619 | .060042 | -2.27 | 0.023 | -.2540422 | -.0186817 | ||
CSROrth | -.0273465 | .0546488 | -0.50 | 0.617 | -.1344562 | .0797631 | ||
EBBE <- | ||||||||
CSRCom | .0324517 | .0719306 | 0.45 | 0.652 | -.1085298 | .1734332 | ||
CSREmp | .3591898 | .0518062 | 6.93 | 0.000 | .2576515 | .4607282 | ||
CSRCus | -.1382609 | .136475 | -1.01 | 0.311 | -.405747 | .1292252 | ||
CSRSha | .1706949 | .0884142 | 1.93 | 0.054 | -.0025938 | .3439836 | ||
CSROrth | .4742574 | .072334 | 6.56 | 0.000 | .3324854 | .6160295 | ||
Fit statistic
Value | Description | |
Likelihood ratio chi2_ms(412) p > chi2 chi2_bs(465) p > chi2 | 890,792 | model vs. saturated |
0.000 | ||
6639.656 | baseline vs. saturated | |
0.000 | ||
Population error RMSEA 90% CI, lower bound upper bound close | 0.058 | Root mean squared error of approximation |
0.053 | ||
0.063 | ||
0.006 | Probability RMSEA <= 0.05 | |
Information criteria | ||
AIC | 23525.826 | Akaike's information criterion |
BIC | 23967.500 | Bayesian information criterion |
Baseline comparison | ||
CFI | 0.922 | Comparative fit index |
TLI | 0.912 | Tucker-Lewis index |
Size of residuals SRMR | 0.065 | Standardized root mean squared residual |
8. EMPLOYEE GROUP SEM MODEL
9. BOOTSTRAP AUDIT FOR MANAGEMENT STAFF
Number of obs | = | 344 | |
Log likelihood = -11647.913 | Replications | = | 1,000 |
( 1) [roa2017]FPER = 1
( 2) [ebbe01]EBBE = 1
( 3) [csr101]CSRCom = 1
( 4) [csr201]CSREmp = 1
( 5) [csr303]CSRCus = 1
( 6) [csr401]CSRSha = 1
( 7) [csr302]CSROth = 1
( 8) [cov(CSRCom,CSREmp)]_cons = 0
Observed Coef. | Bootstrap Std. Err. | z | P>|z| | Normal-based [95% Conf. Interval] | ||||
Structural | ||||||||
FPER <- | ||||||||
EBBE | .4248473 | .0801825 | 5.30 | 0.000 | .2676926 | .582002 | ||
CSRCom | -.0605672 | .0500773 | -1.21 | 0.226 | -.1587169 | .0375825 | ||
CSREmp | .2214039 | .0389796 | 5.68 | 0.000 | .1450052 | .2978025 | ||
CSRCus | .275264 | .1094636 | 2.51 | 0.012 | .0607193 | .4898087 | ||
CSRSha | -.1363619 | .0703704 | -1.94 | 0.053 | -.2742854 | .0015616 | ||
CSROrth | -.0273465 | .0642637 | -0.43 | 0.670 | -.153301 | .098608 | ||
EBBE <- | ||||||||
CSRCom | .0324517 | .0684583 | 0.47 | 0.635 | -.1017241 | .1666274 | ||
CSREmp | .3591898 | .061278 | 5.86 | 0.000 | .2390872 | .4792925 | ||
CSRCus | -.1382609 | .1435608 | -0.96 | 0.336 | -.4196349 | .1431131 | ||
CSRSha | .1706949 | .0962568 | 1.77 | 0.076 | -.0179649 | .3593547 | ||
CSROrth | .4742574 | .0803289 | 5.90 | 0.000 | .3168157 | .6316991 | ||
10. MULTI-GROUP ANALYSIS OF EMPLOYEES AND MANAGERS
Coef. | OIM Std. Err. | z | P>|z| | [95% Conf. | Interval] | |||
Structural | ||||||||
FPER <- | ||||||||
EBBE | ||||||||
1 | .3366475 | .1580455 | 2.13 | 0.033 | .026884 | .6464111 | ||
2 | .4396069 | .0782618 | 5.62 | 0.000 | .2862166 | .5929973 | ||
CSRCom | ||||||||
1 | -.0504626 | .0806972 | -0.63 | 0.532 | -.2086263 | .107701 | ||
2 | -.0464103 | .0575597 | -0.81 | 0.420 | -.1592253 | .0664047 | ||
CSREmp | ||||||||
1 | .1918674 | .059281 | 3.24 | 0.001 | .0756787 | .3080561 | ||
2 | .2439135 | .0504437 | 4.84 | 0.000 | .1450457 | .3427813 | ||
CSRCus | ||||||||
1 | .3275522 | .4242176 | 0.77 | 0.440 | -.5038989 | 1.159003 | ||
2 | .2808577 | .0953295 | 2.95 | 0.003 | .0940153 | .4677 | ||
CSRSha | ||||||||
1 | -.0526252 | .1324168 | -0.40 | 0.691 | -.3121574 | .2069069 | ||
2 | -.2306594 | .089819 | -2.57 | 0.010 | -.4067013 | -.0546175 | ||
CSROrth | ||||||||
1 | -.0177291 | .279615 | -0.06 | 0.949 | -.5657644 | .5303062 | ||
2 | -.0074692 | .0536 | -0.14 | 0.889 | -.1125234 | .0975849 | ||
EBBE <- | ||||||||
CSRCom | ||||||||
1 | -.0659556 | .161872 | -0.41 | 0.684 | -.383219 | .2513077 | ||
2 | .075225 | .0876644 | 0.86 | 0.391 | -.0965942 | .2470441 | ||
CSREmp | ||||||||
1 | .3155372 | .1474473 | 2.14 | 0.032 | .0265458 | .6045287 | ||
2 | .4439287 | .0635246 | 6.99 | 0.000 | .3194227 | .5684347 | ||
CSRCus | ||||||||
1 | 1.292111 | 1.258007 | 1.03 | 0.304 | -1.173537 | 3.757759 | ||
2 | -.1468927 | .1368725 | -1.07 | 0.283 | -.415158 | .1213725 | ||
CSRSha | ||||||||
1 | -.2548871 | .3499461 | -0.73 | 0.466 | -.9407689 | .4309947 | ||
2 | .2033155 | .122602 | 1.66 | 0.097 | -.03698 | .443611 | ||
CSROrth | ||||||||
1 | -.014907 | .6703295 | -0.02 | 0.982 | -1.328729 | 1.298915 | ||
2 | .3828518 | .0721042 | 5.31 | 0.000 | .2415301 | .5241735 | ||