119
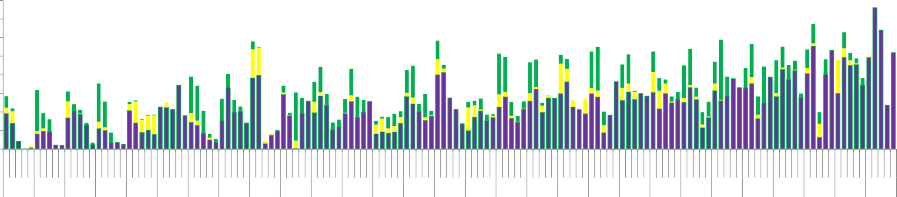
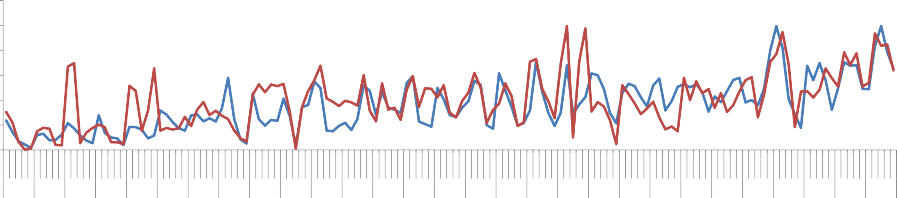
Figure 2.51: Proportion of highly liquid assets before and after deducting loans from the State Bank and credit institutions in the total assets of some commercial banks
SGB ACB NVB EAB BID VAB NASB STB CTG OCB PGB ABB MHBB KLB SHB NAB GDB EIB VCB HDB MBB VIB VPB TCB MDB MSB LVB TPB SEAB
80%
60%
40%
20%
0%
-20%
2010
2012
2014
2011
2013
2010
2012
2014
2011
2013
2010
2012
2014
2011
2013
2010
2012
2014
2011
2013
2010
2012
2014
2011
2013
2010
2012
2014
2011
2013
2010
2012
2014
2011
2013
2010
2012
2014
2011
2013
2010
2012
2014
2011
2013
2010
2012
2014
2011
2013
2010
2012
2014
2011
2013
2010
2012
2014
2011
2013
2010
2012
2014
2011
2013
2010
2012
2014
2011
2013
2010
2012
2014
-40%
Highly liquid assets Highly liquid assets - Borrow from State Bank - Borrow from credit institutions
Source: Financial reports of commercial banks
Figure 2.52: Proportion of medium and long-term debt in total debt of some commercial banks
VPB
MBB
STB
SHB
TCB
EIB
NVB
ACB
VCB
CTG
BID
80%
70%
60%
50%
40%
30%
20%
10%
2010
2011
2012
2013
2014
2010
2011
2012
2013
2014
2010
2011
2012
2013
2014
2010
2011
2012
2013
2014
2010
2011
2012
2013
2014
2010
2011
2012
2013
2014
2010
2011
2012
2013
2014
2010
2011
2012
2013
2014
2010
2011
2012
2013
2014
2010
2011
2012
2013
2014
2010
2011
2012
2013
2014
0%
Medium-term debt Long-term debt
Source: Financial reports of commercial banks
Second, low credit quality, sensitive to macroeconomic fluctuations while risk resistance is low.
Rapid credit expansion without adequate credit risk management measures leads to inadequacies in credit quality. Overdue and bad debts accumulated over time, credit structure concentrated in a number of high-risk industries, a large proportion of credit granted to a number of inefficient state-owned enterprises... are really exposed when the economy is in recession (see figure 2.53) and the State Bank applies debt classification and recognition policies towards international standards.
Figure 2.53: GDP growth rate and bad debt ratio
6.68%
6.24%
5.98%
5.25%
5.42%
4.12%
3.61%
3.06%
3.25%
2.72%
8%
7%
6%
5%
4%
3%
2%
1%
0%
2011 2012 2013 2014 2015
GDP Bad debt ratio
Source: General Statistics Office, State Bank
Low credit quality is not only reflected in the increase in bad debts but also in the sharp increase in the scale and rate of overdue debts. Initially, this situation has two potential risks: if the production and business prospects and the customers' ability to repay debts do not improve, group 2 debts will be transferred to the bad debt group and there is a not small possibility that a significant proportion of debts that should be classified as bad debts will still be kept in group 2 to avoid recording too much bad debt. Practice has shown that bad debts, especially group 5 debts, have continuously increased over the years while the rate of bad debt recovery is low (see figure 2.54).
Table 2.4: DPRR/outstanding debt and DPRR/bad debt ratio of ASEAN and Vietnam commercial banking systems
ASEAN | Vietnam | |||
DPRR/Outstanding debt | DPRR/Bad debt | DPRR/Outstanding debt | DPRR/Bad debt | |
2008 | 3.28% | 81.42% | 2.67% | 63.09% |
2009 | 3.48% | 81.20% | 2.08% | 128.36% |
2010 | 3.16% | 91.82% | 2.28% | 106.41% |
2011 | 2.75% | 96.51% | 2.44% | 86.13% |
2012 | 2.47% | 101.47% | 2.49% | 60.41% |
Maybe you are interested!
-

 Evaluating Vietnam's Monetary Policy Management Process
 -
 For Vietnam's Monetary Policy Independence
 -
 Correlation Coefficient Matrix Model Impact of Monetary Policy, Prov to Car
 -
 The impact of monetary policy on financial stability of Vietnamese commercial banks through risk tolerance - 22
 -
 Monetary Policy Transparency, Financial Repression and Dollarization
2013
2.44% | 112.33% | 2.36% | 69.06% | |
2014 | 2.26% | 113.31% | 1.85% | 60.31% |
Source: Bankscope
The DPRR level of the commercial banking system has decreased sharply as banks have continuously used reserves to handle irrecoverable bad debts. Compared to other countries in the region, the ratio of DPRR to outstanding loans and bad debts is much lower and has continuously decreased (see Table 2.4 and Figure 2.55). This situation has amplified the negative impact of the tightening monetary policy on the ability and desire to provide credit of the commercial banking system.
Figure 2.54: Overdue debt ratio and bad debt ratio of some commercial banks
CTG
STB
EIB
ACB MBB VPB
BID
VCB
TCB
SHB
NVB
20% 20%
15%
10% 15%
5%
0% 10%
-5%
-10% 5%
-15%
2010
2012
2014
2011
2013
2010
2012
2014
2011
2013
2010
2012
2014
2011
2013
2010
2012
2014
2011
2013
2010
2012
2014
2011
2013
2010
2012
2014
-20% 0%
Overdue debt ratio Bad debt ratio (right axis)
Source: Financial reports of commercial banks
Figure 2.55: Risk provision ratio on outstanding debt and bad debt of some commercial banks
EIB
CTG
VPB
STB
ACB NVB
TCB
SHB
BID
MBB VCB
8% 250%
200%
6% 150%
100%
4% 50%
0%
2% -50%
-100%
2010
2012
2014
2011
2013
2010
2012
2014
2011
2013
2010
2012
2014
2011
2013
2010
2012
2014
2011
2013
2010
2012
2014
2011
2013
2010
2012
2014
0% -150%
DPRR/DPRR outstanding debt/Bad debt (right axis)
Source: Financial reports of commercial banks
Third, mobilized capital is unstable, focusing on short terms.
The pressure to provide credit capital for the economy at the macro level, together with the pressure to compete for market share at the micro level, has led to fierce competition in capital mobilization activities. The explosive growth of joint-stock commercial banks, but not accompanied by improvements in the quality of capital mobilization products, but focusing on price competition, has expanded the deposit market share of this group, causing the market share of the state-owned commercial banks to increasingly narrow. However, it is from this choice of price competition that the joint-stock commercial banks are constantly under pressure from customers to withdraw deposits before maturity to deposit at banks that pay higher interest rates. The proportion of short-term deposits and the volume of deposits withdrawn before maturity increased continuously during the period of 2010 to 2012, which is clear evidence of this phenomenon. This situation spread to the state-owned commercial banks and led to the instability of the mobilized capital of the entire system.
Fourth, the level of dependence on the interbank market and the State Bank is high.
The imbalance between mobilization and lending in market 1 is reflected in market 2, which in principle only meets short-term liquidity needs. Some small-scale banks that cannot compete in market 1 have had to mobilize from the interbank market to lend to the economy, leading to an increasingly large gap in terms of mobilization and lending.
Figure 2.56: Loan-to-borrow ratio of total assets of the Vietnamese and ASEAN commercial banking systems
250%
200%
150%
100%
50%
0%
2008 2009 2010 2011 2012 2013 2014
ASEAN Vietnam
Source: Bankscope
If we consider the total value of the entire banking system, the loan-to-deposit ratio of the Vietnamese banking system is much higher than that of the ASEAN banking system. On the contrary, if we consider the average and median values, the loan-to-deposit ratio of the Vietnamese banking system is lower than that of the ASEAN banking system (see Figure 2.56). This reflects the existence of a few large-scale banks in the commercial banking system that both lend and mobilize on the interbank market (loan more than mobilize).
Meanwhile, many small-scale commercial banks depend heavily on borrowed capital on the interbank market (see figures 2.57, 2.58, and 2.59).
As the SBV tightened monetary policy, large-scale banks gradually limited their lending activities on the interbank market, forcing small-scale banks to seek liquidity in the third market. The lending-to-deposit ratio on the interbank market of the banking system gradually decreased as the liquidity of the system was maintained and the SBV tightened regulations on debt classification and provisioning for loans on the interbank market.
Figure 2.57: Proportion of deposits and loans from other credit institutions, debts from the State Bank and issuance of GTCG in total liabilities of some commercial banks
80%
70%
60%
50%
40%
30%
20%
10%
2010
2012
2014
2011
2013
2010
2012
2014
2011
2013
2010
2012
2014
2011
2013
2010
2012
2014
2011
2013
2010
2012
2014
2011
2013
2010
2012
2014
2011
2013
2010
2012
2014
2011
2013
2010
2012
2014
2011
2013
2010
2012
2014
2011
2013
2010
2012
2014
2011
2013
2010
2012
2014
2011
2013
2010
2012
2014
2011
2013
2010
2012
2014
2011
2013
2010
2012
2014
2011
2013
2010
2012
2014
0%
SGB EAB MBB STB VCB PGB ACB KLB NASB NVB TCB ABB BID SHB LVB CTG HDB VIB MHBB VAB OCB MSB VPB GDB NAB EIB TPB SEAB MDB


Deposits and loans from other credit institutions Debts from the State Bank of Vietnam Issuance of GTCG
Source: Financial reports of commercial banks
Figure 2.58: Ratio of lending and borrowing to total assets in some commercial banks
60%
50%
40%
30%
20%
10%
2010
2012
2014
2011
2013
2010
2012
2014
2011
2013
2010
2012
2014
2011
2013
2010
2012
2014
2011
2013
2010
2012
2014
2011
2013
2010
2012
2014
2011
2013
2010
2012
2014
2011
2013
2010
2012
2014
2011
2013
2010
2012
2014
2011
2013
2010
2012
2014
2011
2013
2010
2012
2014
2011
2013
2010
2012
2014
2011
2013
2010
2012
2014
2011
2013
2010
2012
2014
2011
2013
2010
2012
2014
0%
SGB EAB NASB STB VAB BID CTG ACB OCB NVB MHBB PGB KLB VIB HDB VPB TCB LVB TPB MBB SHB VCB MSB ABB NAB MDB GDB EIB SEAB


Interbank lending/total assets Interbank borrowing/total capital
Source: Financial reports of commercial banks
Figure 2.59: Lending, borrowing and net lending scale on the interbank market of some commercial banks
150,000
120,000
90,000
60,000
30,000
0
-30,000
-60,000
-90,000
-120,000
-150,000
50,000
SGB VAB NASB KLB MDB PGB EAB OCB NVB GDB TPB NAB MHBB STB HDB LVB ABB VIB VPB SHB MSB SEAB ACB TCB MBB EIB BID CTG VCB
40,000
30,000
20,000
10,000
0
-10,000
2010
2013
2011
2014
2012
2010
2013
2011
2014
2012
2010
2013
2011
2014
2012
2010
2013
2011
2014
2012
2010
2013
2011
2014
2012
2010
2013
2011
2014
2012
2010
2013
2011
2014
2012
2010
2013
2011
2014
2012
2010
2013
2011
2014
2012
2010
2013
2011
2014
-20,000
Net lending in the interbank market (right axis) Lending in the interbank market Borrowing in the interbank market
Source: Financial reports of commercial banks
Fifth, the financial leverage ratio is high, the capital adequacy ratio is low and tends to decrease when the State Bank tightens monetary policy due to slow increase in charter capital and declining profits.
Since 2011, charter capital growth has been difficult because banks have difficulty issuing shares when the stock market is down and the search for domestic and foreign strategic shareholders has not been successful due to the weak situation of the banks themselves. The foreign investor ownership limit of 30% is also a factor that hinders attracting foreign investors. Due to the limited ability to increase charter capital, the commercial banking system has to rely on increasing undistributed profits to improve capital adequacy.
However, during the period from 2011 to present, the profit situation of the commercial banking system has not been optimistic due to difficulties in credit growth, non-credit activities have not brought high profitability and have had to increase DPRR provisions. The capital safety ratio has decreased, the financial leverage ratio has increased, causing the credit granting capacity of the banking system to decrease (see Figures 2.60 and 2.61).
Figure 2.60: Growth in equity capital and contribution of charter capital to growth in equity capital of the state-owned commercial banking system
Figure 2.61: Growth in equity capital and contribution of charter capital to growth in equity capital of the joint stock commercial banking system
14%
12%
10%
8%
6%
4%
2%
0%
-2%
-4%
-6%
May-12 Aug-12 Nov-12 Feb-13 May-13 Aug-13 Nov-13 Feb-14 May-14 Aug-14 Nov-14 Feb-15 May-15 Aug-15
Nov-15
-8%
14%
12%
10%
8%
6%
4%
2%
0%
-2%
-4%
-6%
May-12 Aug-12 Nov-12 Feb-13 May-13 Aug-13 Nov-13 Feb-14 May-14 Aug-14 Nov-14 Feb-15 May-15 Aug-15
Nov-15
-8%
VTC Growth Contribution of Charter Capital VTC Growth Contribution of Charter Capital
Source: State Bank Source: State Bank Sixth, income structure focuses on interest income from credit activities
The level of business diversification of the banking system has not improved much. Credit accounts for a large proportion of the balance sheet and also accounts for a large proportion of total banking operating income. Compared to countries in the ASEAN region, the proportion of net interest income of Vietnamese commercial banks is 20% higher (see Figures 2.62, 2.63, 2.67, 2.68). Service activities have been invested in by banks but have not brought about the expected results when many services have not met the needs of Vietnamese consumers. Notably, the group of state-owned commercial banks has diversified better than the group of joint-stock commercial banks, mainly based on advantages of scale (in terms of capital and network) rather than on the quality of products and services.