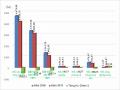
Table 3.19. Logistic regression analysis of factors related to knowledge, access to services and prevention support affecting the behavior of always using condoms when having sex with different types of partners in the past 12 months in 2006 (n=715)
Always use condoms OR
n | % | (95% confidence interval) (95% confidence interval) | |||
Correct knowledge to prevent infection | Have | 3 | 2.8 | 0.59 | |
HIV/STIs | Are not | 21 | 4.7 | (0.17 – 1.99) | |
Be aware of the risk of infection | Have | 16 | 4.8 | 1.37 | |
HIV/STIs | Are not | 8 | 3.6 | (0.57 – 3.24) | |
Receive information from TV Yes | 17 | 4.7 | 1.34 | ||
Are not | 7 | 3.6 | (0.54 -3.27) | ||
Get information from the radio | Have | 17 | 4.2 | 0.88 | |
district | Are not | 7 | 4.7 | (0.36 – 2.17) | |
Receive information from the loudspeaker of | Have | 16 | 4.2 | 0.93 | |
commune | Are not | 8 | 4.6 | (0.39 – 2.21) | |
Get information from books, newspapers, and leaflets about | Have | 14 | 11.1 | 5.23 | 4.81 |
HIV/STI prevention | Are not | 10 | 2.3 | (2.26 – 12.08) | (1.64 – 14.19) |
Get information/support from organizations | Have | 10 | 3.9 | 0.81 | |
locally | Are not | 14 | 4.7 | (0.35 – 1.86) | |
Receive information/support from health workers Yes | 15 | 4.1 | 0.82 | ||
Are not | 9 | 4.9 | (0.35 – 1.91) | ||
Get information/support from school Yes | 2 | 5.4 | 1.29 | ||
Are not | 22 | 4.3 | (0.29 – 5.69) | ||
Get BCS support for 12 months Yes | 9 | 25.0 | 11.18 | 14.19 | |
Maybe you are interested!
-
 Results of Linear Regression Analysis on Factors Affecting Land Complaints in Vinh City
 -
 Exploratory Factor Analysis (EFA) Results for Factors Affecting Customer Satisfaction
 -
 Regression Model Results of 6 Factors Affecting 8 Listed Joint Stock Companies
 -
 Regression Analysis Results With Hypothesis H2B
 -
 Analysis of factors affecting customer satisfaction with the quality of FiberVNN fiber optic internet service of Can Tho Telecom - 2
Characteristic
AOR
Get support in HIV/STI prevention for 12 months
No Yes No
15 2.9
13 5.4
11 3.6
(4.49 – 27.84)
1.52
(0.67 – 3.45)
(4.30 – 46.87)
Regarding the behavior of always using condoms when having sex with different types of partners in the 12 months before the survey, factors influencing this behavioral change include:
- Living with spouse/partner (AOR=0.13; 95% CI: 0.04 – 0.43);
- Receive information from books, newspapers, and leaflets (AOR=4.81; 95% CI: 1.64 – 14.19);
- Received condom support in the 12 months prior to the interview (AOR=14.19; 95% CI: 4.30 – 46.87).
3.2.8. Drug use behavior
Table 3.20. Drug use behavior in the study population in 2006 (n=807)
Characteristic | Percentage | |
Ever used drugs | 1.6 | |
Ever injected drugs | 0.0 |
The results of the 2006 survey in 03 communes of Van Chan district did not show that drug use was a major problem in the locality. Among the study participants, only 1.6% of respondents had ever used drugs. Among these people, there was no case of drug use by injection. Drug use in the study communes was only in the form of smoking and was considered a habit of the ethnic minorities here, especially those who had lived in the locality for a long time.
3.3. EVALUATION OF THE EFFECTIVENESS OF HIV/STI PREVENTION INTERVENTION IN DAO ETHNIC PEOPLE AGE 15-49 IN THE PERIOD 2006-2012
3.3.1. HIV/AIDS prevention activities carried out in the study area in 2006
2006 was also the year in which HIV/AIDS prevention activities began in Van Chan district. The district established a Steering Committee for HIV/AIDS prevention in the district and developed plans, directing the grassroots to implement activities according to the plan of the Yen Bai Provincial Steering Committee for HIV/AIDS Prevention. The district steering committee held quarterly meetings, assessed the actual situation, and proposed operational solutions suitable to local conditions. HIV/AIDS prevention activities implemented in 2006 included voluntary testing and counseling, communication, harm reduction interventions, and monitoring activities.
Although the district has built important activities in HIV/AIDS prevention and the locality has achieved certain results, these activities still have problems such as the selection and training of collaborators and peer educators are still limited, leading to communication activities and the distribution of free NKTs and condoms not being as effective as expected. The content of the communication program activities mainly relies on the supply from the provincial steering committee without developing and designing program content to suit local characteristics. Current harm reduction intervention activities still mainly focus on high-risk groups such as IDUs and FSWs and there is no specific program for ethnic minority groups. Voluntary testing and counseling activities in the district have just been established and have not been implemented according to the guided process. These problems have directly affected people's access to communication information and intervention services.
3.3.2. Evaluation of the results of implementing HIV/STI prevention interventions in the study area during the period 2006-2012
With intervention activities implemented synchronously in Van Chan district, the study will focus on evaluating the following contents: evaluating the results of intervention programs; changes in knowledge, attitudes and HIV/STI risk behaviors of ethnic minority groups.
Table 3.21. Results of behavior change communication activities
Result index
activities Unit 2007 2008 2009 2010 2011 2012
Radio report
provincial television number 10 35 2 0 0 0
Broadcast at
District/Province Number of Posts 9 12 2 0 0 0
Newspaper article
Province number of posts 2 28 2 0 0 0
Broadcast over the commune loudspeaker
Talks, village meetings
number of sessions
(coverage rate) number of sessions/person
144
(50%) 216/
>5,000
~300 (60%) 350/
>7,000
~300 (60%)
409/~
10,000
>200
(70%)
364/~
10,000
>200
(70%)
485/~
9,000
>100
(80%) 230/
>5,000
Mitting times/year 0 3 3 3 3 3
Number of times to hang banners/year 1 1 2 2 2 1
Cultural competition
times/year 0 0 1 1 1 1
arts
The results of the behavior change communication program are shown in Table 3.21. Indirect communication activities through newspapers, radio and television at the provincial and district levels were focused on in the first 3 years of the intervention program. Direct communication activities such as village meetings, thematic talks, meetings and cultural and artistic competitions were maintained throughout the 6 years of intervention.
Table 3.22. Results of voluntary testing and counseling activities
Result index
Unit of measure 2007 2008 2009 2010 2011 2012
Number of people consulted number of people | 665 | 425 | >800 | >900 | 842 | 558 |
Number of people consulted number of people | 554 | 309 | >700 | >800 | 740 | 540 |
Number of people receiving results Test and get advice on people | 554 | 309 | >700 | >800 | 740 | 540 |
work
and consent to testing
Post-test questions
The voluntary testing and consultation program attracts an average of over 500 clients per year, with the highest number of clients in 2010. The rate of clients who are counseled, agree to be tested and receive results is also very high.
Unit of measure | 2007 | 2008 | 2009 | 2010 | 2011 | 2012 |
Number of people number | 603 | 724 | 687 | 635 | 629 | 608 |
Number of people consulted number | 603 | 724 | 687 | 635 | 629 | 608 |
Number of people diagnosed number | 492 | 485 | 453 | 421 | 516 | 499 |
Number of people consulted number | 427 | 436 | 401 | 394 | 475 | 462 |
Table 3.23. Results of STI screening and management Outcome indicators
work
STI screening
STI prevention
diagnosed with STI
STI treatment
In the STI screening and management program, the number of clients coming for examination has been maintained stable over the years. In this program, 100% of clients coming for examination are counseled on STI prevention and about 90% of those diagnosed with STIs are referred to treatment facilities in the district and province.
Table 3.24. Results of condom distribution activities
Performance Index
Number of condoms used
Unit of measure
2007 2008 2009 2010 2011 2012
release
Number of people receiving condoms
Number of pieces >10,000 15,340 >40,000 >40,000 122,079 >10,000
Number of views >2000 >2000 >2000 >2000 >3,000 >2000
The condom distribution program has provided an average of nearly 40,000 condoms/year to more than 2,000 people, of which in 2011, more than
100,000 condoms.
Table 3.25. Received communication information on HIV/STI prevention in 12 months
Media information
TCT 2006 (n=632)
SCT 2012
n | % | n | % | |||
HIV/AIDS | 610 | 96.5 | 773 | 98.0 | p>0.05 | 2 |
Hepatitis | 200 | 31.7 | 369 | 46.8 | p<0.001 | 48 |
Safe injection | 305 | 48.3 | 537 | 68.1 | p<0.001 | 41 |
Safe sex | 308 | 48.7 | 550 | 69.7 | p<0.001 | 43 |
Drug addiction treatment | 269 | 42.6 | 488 | 61.9 | p<0.001 | 45 |
Sex education | 87 | 13.8 | 447 | 56.7 | p<0.001 | 311 |
Diseases transmitted through 346 | 54.8 | 671 | 85.0 | p<0.001 | 55 | |
Get less get one information 622 | 98.4 | 776 | 98.4 | p>0.05 | 0 | |
(n=789) p CSHQ (%)
sexual route
media
The results in Table 3.25 describe the change in access to information on HIV/STI prevention that the research group received in the 12 months prior to the survey. Among the HIV/STI prevention communication contents, except for general information on HIV/AIDS which remained at a very high rate (over 95%), other information increased significantly from 2006 to 2012 (p<0.001). The proportion of research participants who received at least one HIV/STI prevention communication content in the 12 months prior to the survey also remained high (over 98%).
Table 3.26. Received support in HIV/STI prevention in the past 12 months
n | % | n | % | |||
Condom | 38 | 6.0 | 355 | 45.0 | p<0.001 | 650 |
STI Diagnosis and Treatment | 249 | 39.4 | 246 | 31.2 | p<0.05 | (21) |
HIV testing | 0 | 0.0 | 145 | 18.4 | p<0.001 | |
HIV treatment drugs | 0 | 0.0 | 5 | 0.6 | p>0.05 | |
Inquiry from organizations | 0 | 0.0 | 2 | 0.3 | p>0.05 | |
Get at least one room 265 support | 41.9 | 484 | 61.3 | p<0.001 | 46 | |
Support
TCT 2006 (n=632)
SCT 2012
(n=789) p
CSHQ (%)
HIV/STI infection
*(): Negative value
Table 3.26 describes the change in HIV/STI prevention support for the Dao ethnic group in the surveyed communes in the 12 months prior to the survey. HIV/STI prevention support focused on condom support and sexually transmitted disease treatment. The proportion of condom support in the 12 months prior to the survey increased from 6% in 2006 to 45% in 2012 (p<0.001). The proportion of Dao people who had received at least one support in HIV/STI prevention increased from 57.8% in 2006 to 77.7% in 2012 (p<0.001). The proportion of Dao people receiving at least one support in HIV/STI prevention in the 12 months prior to the survey increased from 41.9% in 2006 to 61.3% in 2012 (p<0.001). The proportion of Dao people receiving STI treatment remained at 30%-40%.
Table 3.27. Access to services in HIV/AIDS prevention and control
Access to service
TCT 2006 (n=632)
SCT 2012
n | % | n | % | |||
Know where to get tested for HIV | 90 | 14.2 | 176 | 22.3 | p<0.001 | 57 |
Ever tested for HIV | 12 | 1.9 | 418 | 53.0 | p<0.001 | 2689 |
HIV test and get results fruit | 7 | 1.1 | 133 | 31.8 | p<0.001 | 2791 |
Know where to get condoms | 218 | 34.5 | 610 | 77.3 | p<0.001 | 124 |
(n=789) p CSHQ (%)
Among those who had heard of HIV/AIDS, only 14.2% of respondents knew where to get an HIV test and only a relatively low proportion of Dao people knew where to get condoms (34.5%). Awareness of HIV/STI prevention services among the study population changed significantly after 6 years of intervention. The proportion of respondents who knew where to get an HIV test increased by 57% from 14.2% in 2006 to 22.3% in 2012 (p<0.001). The proportion of respondents aged 15-49 who knew where to get condoms increased by 124% from 34.5% in 2006 to 77.3% in 2012 (p<0.001).
Regarding HIV/AIDS prevention testing and counseling activities in the locality, in 2006 only 1.9% of research participants responded that they had ever been tested.
tested for HIV and only 1.1% were tested for HIV and knew the results. These are very low rates and reflect shortcomings in HIV/AIDS prevention testing and counseling activities in the study communes. After 6 years of intervention, this activity has changed significantly. The rate of having been tested for HIV increased from 1.9% to 53.0% (p<0.001) and the rate of people who participated in HIV testing and received the results increased from 1.1% to 31.8% (p<0.001).
3.3.3. Effectiveness of changing knowledge and attitudes in HIV infection prevention
Table 3.28. Changes in knowledge of HIV infection prevention
n | % | n | % | |||
Ever heard of HIV/AIDS | 632 | 78.3 | 789 | 98.4 | p<0.001 | 26 |
Heard about STDs | 535 | 66.3 | 766 | 95.5 | p<0.001 | 44 |
Correct knowledge about infection prevention HIV/STI infection | 118 | 18.7 | 396 | 50.2 | p<0.001 | 168 |
Knowledge about HIV prevention from mother to the child | 274 | 43.4 | 382 | 48.4 | p>0.05 | 12 |
Know about HIV medications for HIV infected people | 235 | 37.2 | 350 | 44.4 | P<0.01 | 19 |
Correct knowledge about infection prevention | 51 | 21.0 | 136 | 52.9 | p<0.001 | 152 |
Feature
TCT 2006 (n=807)
SCT 2012
(n=802) p
CSHQ (%)
HIV/STI infection in the 15-24 group
The results from Table 3.28 show a clear change from 2006 to 2012 in most of the contents on HIV/STI prevention knowledge, in which correct knowledge on HIV prevention and knowledge on misconceptions are the two contents that changed the most with 168% and 185% respectively. Knowledge on misconceptions is an important factor affecting general knowledge on HIV/STI prevention among ethnic minorities. Regarding the content on ways to prevent HIV/STI infection, although there was no difference between 2006 and 2012, the rate of participants answering the three questions correctly was maintained at a fairly high level (61.0%). The results of the analysis of changes in HIV prevention knowledge by content showed that the contents on misconceptions in HIV prevention increased significantly.