Acacia auriculiformis ...
Environmental protection, infrastructure and agricultural production: coastal protection and development projects have made an important contribution to protecting and increasing forest cover through afforestation and scattered tree planting activities. Contributing to greening barren and fallow land; promoting the effectiveness of protection and ecological environment protection, especially coastal protected areas have effectively protected against storms and sand, protected rural infrastructure works, and limited desertification and desertification of coastal sand areas.
Forming a forest protection organization mechanism: the assignment of forest protection contracts to organizations and households helps to gradually implement the policy of socializing forestry. People gradually determine their ownership in the use of forests and forestry land; limit illegal deforestation, create jobs for people in rural and coastal areas; contribute to hunger eradication and poverty reduction, improve livelihoods; develop socio-economy; maintain national security and defense in coastal and island areas. Gradually create close coordination between forest management boards, forest rangers, local authorities, armed forces and contracted households in the search and prevention of deforestation. The policy of assigning land and contracting protective forests has brought benefits to local people - in the form of usage rights in wind- and sand-blocking protective forests.
Creating jobs and contributing to social security: the coastal protection system has significantly contributed to protecting and improving environmental conditions, serving the development of aquaculture and forestry in the development area; protecting against wind, sand, frost, and wind carrying salt vapor into the mainland; helping to maintain livelihoods for people in coastal areas. Protection and development activities have contributed to creating jobs for households in coastal areas, while also mobilizing many sources of investment capital in society, producing a large and diverse volume of agricultural and forestry products; contributing to solving the need for food for people, thereby increasing income for local people; eliminating hunger and reducing poverty, creating a premise to promote the development of rural economy in the region.
b) Some exist
Limitations of silvicultural techniques applied in afforestation in sandy areas in the past, such as:
- The crop structure has not been selected appropriately for the site types (sea sand, mobile sand dunes, semi-mobile sand dunes, semi-flooded sand in the rainy season...);
- Poor quality seedlings, lack of protection from physical impacts (sand blowing, exposing roots,...) during the important initial stages of development;
- Lack of diverse species selection and planting and care techniques that are not suitable for the characteristics and features of each site type group;
- Techniques for planting protective forests on coastal sandy soil such as planting grass to prevent sand blowing, replacing sandy soil in holes with hill soil, adding grass and litter in holes, planting around hills from the foot to the top, and planting on rainy days have been applied for a long time, but these techniques are difficult to apply because they are too costly in terms of effort and money;
There are no procedures or technical measures for afforestation for different site conditions, especially difficult sites (strongly mobile sand,...).
The basic characteristics and features of forest planting sites, especially difficult sites (semi-fixed sand dunes, strongly mobile sand,...) have not been clarified.
There has been no research to build a multi-purpose, effective and sustainable sand-based agricultural model that can respond to climate change and rising sea levels.
c) Lessons learned
It is necessary to soon complete institutions related to planning and monitoring mechanisms, sanctions related to sustainable management of RVB forest protection and development planning to ensure long-term forest protection, avoiding the conversion of forests and forest land to other uses.
Many programs and projects are interested in the stage of establishing coastal protection forests, but after the project ends, there is no longer-term mechanism such as assigning households and communities to manage and protect them long-term according to current regulations to maintain sustainability as well as promote the added value of the forest.
Most of the coastal areas are not concentrated, near residential areas and are under the management of the People's Committee of the commune, so right from the implementation of programs and projects, it is necessary to focus on the role of management, protection and development of coastal areas on two main areas: (i) Coastal communities; and (ii) The role of the commune level in planning and planning forest management.
All forest areas planned as “coastal forests” (Prime Minister, 2016) [90] need to be clearly identified as RPH. Calculating the cost of establishing
Forests and sustainable forest management need to calculate to ensure correct and sufficient funding for forest establishment.
3.3. Impact of technical measures on protective forest planting on some groups of coastal sandy sites
3.3.1. Effect of basal fertilizer combined with moisture-retaining agent on the growth of Casuarina trees on site type group II
a) In Le Thuy
At the age of 16 months, the growth indicators (D0, H VN , D T ) of Casuarina trees planted on site type group II (specifically CCcH2KT2 and CCcH3KT2) in Le Thuy had statistically significant differences between CT1 ~ CT3. Average D0 from 1.42 ± 0.36cm (CT3) to 1.76 ± 0.33cm (CT1), CV%: 18.8 - 25.4%. Average H VN in CT1
reached 0.95 ± 0.20m, 0.12m higher in significance than CT3 (0.82 ± 0.23m, 95% CI: 0.00064 to 0.25m, p = 0.048) , CV%: 21.1 - 28.0%. Similarly, the average D T in CT1 reached 0.78 ± 0.27m, 0.27m higher in significance (95% CI: 0.12 to 0.43m, p = 0.00061) than CT3 (0.50 ± 0.23m), CV%: 34.6 - 46.0%. The overall average growth in ∆D0 = 1.09 - 1.35cm/year; ∆H VN = 0.63 - 0.73m/year and ∆D T = 0.38 - 0.60m/year.
Month year old | CTTN | D0 (sd) (cm) | H VN (sd) ( m) | D T (sd) (m) | ∆D0 (cm/year) | ∆H VN (m/year) | ∆D T (m/year) |
16 | Address | NA | NA | NA | - | - | - |
CT1 | 1.76a (0.33 ) | 0.95a (0.20 ) | 0.78a (0.27 ) | 1.35 | 0.73 | 0.60 | |
CT2 | NA | NA | NA | - | - | - | |
CT3 | 1.42b (0.36 ) | 0.82b (0.23 ) | 0.50b (0.23 ) | 1.09 | 0.63 | 0.38 | |
24 | Address | 1.28c (0.54 ) | 0.63c (0.17 ) | 0.66c (0.25 ) | 0.64 | 0.32 | 0.33 |
CT1 | 1.50c (0.50) | 0.70 bc (0.25) | 0.70 c (0.27) | 0.75 | 0.35 | 0.35 | |
CT2 | 2.00b (0.57 ) | 0.79b (0.30 ) | 1.02b (0.35 ) | 1.00 | 0.40 | 0.51 | |
CT3 | 2.21a (0.62 ) | 0.90a (0.29 ) | 1.15a ( 0.44 ) | 1.10 | 0.45 | 0.58 |
Maybe you are interested!
-

 Identify Rating Levels and Rating Scales
zt2i3t4l5ee
zt2a3gstourism,quan lan,quang ninh,ecology,ecotourism,minh chau,van don,geography,geographical basis,tourism development,science
zt2a3ge
zc2o3n4t5e6n7ts
of the islanders. Therefore, this indicator will be divided into two sub-indicators:
a1. Natural tourism attractiveness a2. Cultural tourism attractiveness
b. Tourist capacity
The two island communes in Quan Lan have different capacities to receive tourists. Minh Chau Commune is home to many standard hotels and resorts, attracting high-income domestic and international tourists. Meanwhile, Quan Lan Commune has many motels mainly built and operated by local people, so the scale and quality are not high, and will be suitable for ordinary tourists such as students.
c. Time of exploitation of Quan Lan Island Commune:
Quan Lan tourism is seasonal due to weather and climate conditions and festivals only take place on certain days of the year, specifically in spring. In Quan Lan commune, the period from April to June and from September to November is considered the best time to visit Quan Lan because the cultural tourism activities are mainly associated with festivals taking place during this time.
Minh Chau island commune:
Tourism exploitation time is all year round, because this is a place with a number of tourist attractions with diverse ecosystems such as Bai Tu Long National Park Research Center, Tram forest, Turtle Laying Beach, so besides coming to the beach for tourism and vacation in the summer, Minh Chau will attract research groups to come for tourism combined with research at other times of the year.
d. Sustainability
The sustainability of ecotourism sites in Quan Lan and Minh Chau communes depends on the sensitivity of the ecosystems to climate changes.
landscape. In general, these tourist destinations have a fairly high level of sustainability, because they are natural ecosystems, planned and protected. However, if a large number of tourists gather at certain times, it can exceed the carrying capacity and affect the sustainability of the environment (polluted beaches, damaged trees, animals moving away from their habitats, etc.), then the sustainability of the above ecosystems (natural ecosystems, human ecosystems) will also be affected and become less sustainable.
e. Location and accessibility
Both island communes have ports to take tourists to visit from Van Don wharf:
- Quan Lan – Van Don traffic route:
Phuc Thinh – Viet Anh high-speed boat and Quang Minh high-speed boat, depart at 8am and 2pm from Van Don to Quan Lan, and at 7am and 1pm from Quan Lan to Van Don. There are also wooden boats departing at 7am and 1pm.
- Van Don - Minh Chau traffic route:
Chung Huong high-speed train, Minh Chau train, morning 7:30 and afternoon 13:30 from Van Don to Minh Chau, morning 6:30 and afternoon 13:00 from Minh Chau to Van Don.
f. Infrastructure
Despite receiving investment attention, the issue of infrastructure and technical facilities for tourism on Quan Lan Island is still an issue that needs to be resolved because it has a direct impact on the implementation of ecotourism activities. The minimum conditions for serving tourists such as accommodation, electricity, water, communication, especially medical services, and security work need to be given top priority. Ecotourism spots in Minh Chau commune are assessed to have better infrastructure and technical facilities for tourism because there are quite complete and synchronous conditions for serving tourists, meeting many needs of domestic and foreign tourists.
3.2.1.4. Determine assessment levels and assessment scales
Corresponding to the levels of each criterion, the index is the score of those levels in the order of 4, 3, 2, 1 decreasing according to the standard of each level: very attractive (4), attractive (3), average (2), less attractive (1).
3.2.1.5. Determining the coefficients of the criteria
For the assessment of DLST in the two communes of Quan Lan and Minh Chau islands, the students added evaluation coefficients to show the importance of the criteria and indicators as follows:
Coefficient 3 with criteria: Attractiveness, Exploitation time. These are the 2 most important criteria for attracting tourists to tourism in general and eco-tourism in particular, so they have the highest coefficient.
Coefficient 2 with criteria: Capacity, Infrastructure, Location and accessibility . Because the assessment area is an island commune of Van Don district, the above criteria are selected by the author with appropriate coefficients at the average level.
Coefficient 1 with criteria: Sustainability. Quan Lan has natural and human-made ecotourism sites, with high biodiversity and little impact from local human factors. Most of the ecotourism sites are still wild, so they are highly sustainable.
3.2.1.6. Results of DLST assessment on Quan Lan island
a. Assessment of the potential for natural tourism development
For Minh Chau commune:
+ Natural tourism attractiveness is determined to be very attractive (4 points) and the most important coefficient (coefficient 3), so the score of the Attractiveness criterion is 4 x 3 = 12.
+ Capacity is determined as average (2 points) and the coefficient is quite important (coefficient 2), then the score of Capacity criterion is 2 x 2 = 4.
+ Exploitation time is long (4 points), the most important coefficient (coefficient 3) so the score of the Exploitation time criterion is 4 x 3 = 12.
+ Sustainability is determined as sustainable (4 points), the important coefficient is the average coefficient (coefficient 1), so the score of the Sustainability criterion is 4 x 1 = 4 points
+ Location and accessibility are determined to be quite favorable (2 points), the coefficient is quite important (coefficient 2), the criterion score is 2 x 2 = 4 points.
+ Infrastructure is assessed as good (3 points), the coefficient is quite important (coefficient 2), then the score of the Infrastructure criterion is 3 x 2 = 6 points.
The total score for evaluating DLST in Minh Chau commune according to 6 evaluation criteria is determined as: 12 + 4 + 12 + 4 + 4 + 6 = 42 points
Similar assessment for Quan Lan commune, we have the following table:
Table 3.3: Assessment of the potential for natural ecotourism development in Quan Lan and Minh Chau communes
Attractiveness of self-tourismof course
Capacity
Mining time
Sustainability
Location and accessibility
Infrastructure
Result
Point
DarkMulti
Point
DarkMulti
Point
DarkMulti
Point
DarkMulti
Point
DarkMulti
Point
DarkMulti
CommuneMinh Chau
12
12
4
8
12
12
4
4
4
8
6
8
42/52
Quan CommuneLan
6
12
6
8
9
12
4
4
4
8
4
8
33/52
b. Assessment of the potential for humanistic tourism development
For Quan Lan commune:
+ The attractiveness of human tourism is determined to be very attractive (4 points) and the most important coefficient (coefficient 3), so the score of the Attractiveness criterion is 4 x 3 = 12.
+ Capacity is determined to be large (3 points) and the coefficient is quite important (coefficient 2), then the score of the Capacity criterion is 3 x 2 = 6.
+ Mining time is average (3 points), the most important coefficient (coefficient 3) so the score of the Mining time criterion is 3 x 3 = 9.
+ Sustainability is determined as sustainable (4 points), the important coefficient is the average coefficient (coefficient 1), so the score of the Sustainability criterion is 4 x 1 = 4 points.
+ Location and accessibility are determined to be quite favorable (2 points), the coefficient is quite important (coefficient 2), the criterion score is 2 x 2 = 4 points.
+ Infrastructure is rated as average (2 points), the coefficient is quite important (coefficient 2), then the score of the Infrastructure criterion is 2 x 2 = 4 points.
The total score for evaluating DLST in Quan Lan commune according to 6 evaluation criteria is determined as: 12 + 6 + 6 + 4 + 4 + 4 = 36 points.
Similar assessment with Minh Chau commune we have the following table:
Table 3.4: Assessment of the potential for developing humanistic eco-tourism in Quan Lan and Minh Chau communes
Attractiveness of human tourismliterature
Capacity
Mining time
Sustainability
Location and accessibility
Infrastructure
Result
Point
DarkMulti
Point
DarkMulti
Point
DarkMulti
Point
DarkMulti
Point
DarkMulti
Point
DarkMulti
Quan CommuneLan
12
12
6
8
9
12
4
4
4
8
4
8
39/52
Minh CommuneChau
6
12
4
8
12
12
4
4
4
8
6
8
36/52
Basically, both Minh Chau and Quan Lan localities have quite favorable conditions for developing ecotourism. However, Quan Lan commune has more advantages to develop ecotourism in a humanistic direction, because this is an area with many famous historical relics such as Quan Lan Communal House, Quan Lan Pagoda, Temple worshiping the hero Tran Khanh Du, ... along with local festivals held annually such as the wind praying ceremony (March 15), Quan Lan festival (June 10-19); due to its location near the port and long exploitation time, the beaches in Quan Lan commune (especially Quan Lan beach) are no longer hygienic and clean to ensure the needs of tourists coming to relax and swim; this is also an area with many beautiful landscapes such as Got Beo wind pass, Ong Phong head, Voi Voi cave, but the ability to access these places is still very limited (dirt hill road, lots of gravel and rocks), especially during rainy and windy times; In addition, other natural resources such as mangrove forests and sea worms have not been really exploited for tourism purposes and ecotourism development. On the contrary, Minh Chau commune has more advantages in developing ecotourism in the direction of natural tourism, this is an area with diverse ecosystems such as at Rua De Beach, Bai Tu Long National Park Conservation Center...; Minh Chau beach is highly appreciated for its natural beauty and cleanliness, ranked in the top ten most beautiful beaches in Vietnam; Minh Chau commune is also home to Tram forest with a large area and a purity of up to 90%, suitable for building bridges through the forest (a very effective type of natural ecotourism currently applied by many countries) for tourists to sightsee, as well as for the purpose of studying and researching.
Figure 3.1: Thenmala Forest Bridge (India) Source: https://www.thenmalaecotourism.com/(August 21, 2019)
3.2.2. Using SWOT matrix to evaluate Quan Lan island tourism
General assessment of current tourism activities of Quan Lan island is shown through the following SWOT matrix:
Table 3.5: SWOT matrix evaluating tourism activities on Quan Lan island
Internal agent
Strengths- There is a lot of potential for tourism development, especially natural ecotourism and humanistic ecotourism.- The unskilled labor force is relatively abundant.- resource environmentunpolluted, still
Weaknesses- Poorly developed infrastructure, especially traffic routes to tourist destinations on the island.- The team of professional staff is still weak.- Tourism products in general
quite wild, originalintact
general and DLST in particularalone is monotonous.
External agents
Opportunity- Tourism is a key industry in the socio-economic development strategy of the province and Van Don economic zone.- Quan Lan was selected as a pilot area for eco-tourism development within the framework of the green growth project between Quang Ninh province and the Japanese organization JICA.- The flow of tourists and especially ecotourism in the world tends toincreasing
Challenge- Weather and climate change abnormally.- Competition in tourism products is increasingly fierce, especially with other localities in the province such as Ha Long, Mong Cai...- Awareness of tourists, especially domestic tourists, about ecotourism and nature conservation is not high.
Through summary analysis using SWOT matrix we see that:
To exploit strengths and take advantage of opportunities, it is necessary to:
- Diversify products and service types (build more tourism routes aimed at specific needs of tourists: experiential tourism immersed in nature, spiritual cultural tourism...)
- Effective exploitation of resources and differentiated products (natural resources and human resources)
div.maincontent .p { color: black; font-family:"Times New Roman", serif; font-style: normal; font-weight: normal; text-decoration: none; font-size: 14pt; margin:0pt; } div.maincontent p { color: black; font-family:"Times New Roman", serif; font-style: normal; font-weight: normal; text-decoration: none; font-size: 14pt; margin:0pt; } div.maincontent .s1 { color: black; font-family:"Times New Roman", serif; font-style: normal; font-weight: normal; text-decoration: none; font-size: 13pt; } div.maincontent .s2 { color: black; font-family:"Times New Roman", serif; font-style: normal; font-weight: normal; text-decoration: none; font-size: 13pt; } div.maincontent .s3 { color: #0D0D0D; font-family:"Times New Roman", serif; font-style: normal; font-weight: bold; text-decoration: none; font-size: 14pt; } div.maincontent .s4 { color: black; font-family:"Times New Roman", serif; font-style: italic; font-weight: normal; text-decoration: none; font-size: 14pt; } div.maincontent .s5 { color: black; font-family:"Times New Roman", serif; font-style: italic; font-weight: bold; text-decoration: none; font-size: 14pt; } div.maincontent .s6 { color: black; font-family:"Times New Roman", serif; font-style: italic; font-weight: normal; text-decoration: none; font-size: 14pt; vertical-align: -3pt; } div.maincontent .s7 { color: black; font-family:"Times New Roman", serif; font-style: italic; font-weight: normal; text-decoration: none; font-size: 14pt; vertical-align: -2pt; } div.maincontent .s8 { color: black; font-family:"Times New Roman", serif; font-style: italic; font-weight: normal; text-decoration: none; font-size: 14pt; vertical-align: -1pt; } div.maincontent .s9 { color: black; font-family:"Times New Roman", serif; font-style: normal; font-weight: normal; text-decoration: none; font-size: 14pt; } div.maincontent .s10 { color: black; font-family:"Times New Roman", serif; font-style: normal; font-weight: bold; text-decoration: none; font-size: 14pt; } div.maincontent .s11 { color: black; font-family:"Times New Roman", serif; font-style: normal; font-weight: normal; text-decoration: none; font-size: 14pt; } div.maincontent .s12 { color: black; font-family:Symbol, serif; font-style: normal; font-weight: normal; text-decoration: none; font-size: 14pt; } div.maincontent .s13 { color: black; font-family:Wingdings; font-style: normal; font-weight: normal; text-decoration: none; font-size: 14pt; } div.maincontent .s14 { color: black; font-family:"Times New Roman", serif; font-style: normal; font-weight: normal; text-decoration: none; font-size: 9pt; vertical-align: 5pt; } div.maincontent .s15 { color: black; font-family:"Times New Roman", serif; font-style: normal; font-weight: normal; text-decoration: none; font-size: 9pt; vertical-align: 5pt; } div.maincontent .s16 { color: black; font-family:Cambria, serif; font-style: italic; font-weight: normal; text-decoration: none; font-size: 14pt; } div.maincontent .s17 { color: #080808; font-family:"Times New Roman", serif; font-style: normal; font-weight: bold; text-decoration: none; font-size: 14pt; } div.maincontent .s18 { color: #080808; font-family:"Times New Roman", serif; font-style: normal; font-weight: normal; text-decoration: none; font-size: 14pt; } div.maincontent .s19 { color: black; font-family:"Times New Roman", serif; font-style: normal; font-weight: normal; text-decoration: none; font-size: 11pt; } div.maincontent .s20 { color: black; font-family:"Times New Roman", serif; font-style: normal; font-weight: normal; text-decoration: none; font-size: 10pt; } div.maincontent .s21 { color: black; font-family:"Times New Roman", serif; font-style: normal; font-weight: bold; text-decoration: none; font-size: 11pt; } div.maincontent .s22 { color: black; font-family:"Times New Roman", serif; font-style: normal; font-weight: normal; text-decoration: none; font-size: 11pt; } div.maincontent .s23 { color: black; font-family:"Times New Roman", serif; font-style: italic; font-weight: normal; text-decoration: none; font-size: 14pt; } div.maincontent .s24 { color: #212121; font-family:"Times New Roman", serif; font-style: normal; font-weight: normal; tex
Identify Rating Levels and Rating Scales
zt2i3t4l5ee
zt2a3gstourism,quan lan,quang ninh,ecology,ecotourism,minh chau,van don,geography,geographical basis,tourism development,science
zt2a3ge
zc2o3n4t5e6n7ts
of the islanders. Therefore, this indicator will be divided into two sub-indicators:
a1. Natural tourism attractiveness a2. Cultural tourism attractiveness
b. Tourist capacity
The two island communes in Quan Lan have different capacities to receive tourists. Minh Chau Commune is home to many standard hotels and resorts, attracting high-income domestic and international tourists. Meanwhile, Quan Lan Commune has many motels mainly built and operated by local people, so the scale and quality are not high, and will be suitable for ordinary tourists such as students.
c. Time of exploitation of Quan Lan Island Commune:
Quan Lan tourism is seasonal due to weather and climate conditions and festivals only take place on certain days of the year, specifically in spring. In Quan Lan commune, the period from April to June and from September to November is considered the best time to visit Quan Lan because the cultural tourism activities are mainly associated with festivals taking place during this time.
Minh Chau island commune:
Tourism exploitation time is all year round, because this is a place with a number of tourist attractions with diverse ecosystems such as Bai Tu Long National Park Research Center, Tram forest, Turtle Laying Beach, so besides coming to the beach for tourism and vacation in the summer, Minh Chau will attract research groups to come for tourism combined with research at other times of the year.
d. Sustainability
The sustainability of ecotourism sites in Quan Lan and Minh Chau communes depends on the sensitivity of the ecosystems to climate changes.
landscape. In general, these tourist destinations have a fairly high level of sustainability, because they are natural ecosystems, planned and protected. However, if a large number of tourists gather at certain times, it can exceed the carrying capacity and affect the sustainability of the environment (polluted beaches, damaged trees, animals moving away from their habitats, etc.), then the sustainability of the above ecosystems (natural ecosystems, human ecosystems) will also be affected and become less sustainable.
e. Location and accessibility
Both island communes have ports to take tourists to visit from Van Don wharf:
- Quan Lan – Van Don traffic route:
Phuc Thinh – Viet Anh high-speed boat and Quang Minh high-speed boat, depart at 8am and 2pm from Van Don to Quan Lan, and at 7am and 1pm from Quan Lan to Van Don. There are also wooden boats departing at 7am and 1pm.
- Van Don - Minh Chau traffic route:
Chung Huong high-speed train, Minh Chau train, morning 7:30 and afternoon 13:30 from Van Don to Minh Chau, morning 6:30 and afternoon 13:00 from Minh Chau to Van Don.
f. Infrastructure
Despite receiving investment attention, the issue of infrastructure and technical facilities for tourism on Quan Lan Island is still an issue that needs to be resolved because it has a direct impact on the implementation of ecotourism activities. The minimum conditions for serving tourists such as accommodation, electricity, water, communication, especially medical services, and security work need to be given top priority. Ecotourism spots in Minh Chau commune are assessed to have better infrastructure and technical facilities for tourism because there are quite complete and synchronous conditions for serving tourists, meeting many needs of domestic and foreign tourists.
3.2.1.4. Determine assessment levels and assessment scales
Corresponding to the levels of each criterion, the index is the score of those levels in the order of 4, 3, 2, 1 decreasing according to the standard of each level: very attractive (4), attractive (3), average (2), less attractive (1).
3.2.1.5. Determining the coefficients of the criteria
For the assessment of DLST in the two communes of Quan Lan and Minh Chau islands, the students added evaluation coefficients to show the importance of the criteria and indicators as follows:
Coefficient 3 with criteria: Attractiveness, Exploitation time. These are the 2 most important criteria for attracting tourists to tourism in general and eco-tourism in particular, so they have the highest coefficient.
Coefficient 2 with criteria: Capacity, Infrastructure, Location and accessibility . Because the assessment area is an island commune of Van Don district, the above criteria are selected by the author with appropriate coefficients at the average level.
Coefficient 1 with criteria: Sustainability. Quan Lan has natural and human-made ecotourism sites, with high biodiversity and little impact from local human factors. Most of the ecotourism sites are still wild, so they are highly sustainable.
3.2.1.6. Results of DLST assessment on Quan Lan island
a. Assessment of the potential for natural tourism development
For Minh Chau commune:
+ Natural tourism attractiveness is determined to be very attractive (4 points) and the most important coefficient (coefficient 3), so the score of the Attractiveness criterion is 4 x 3 = 12.
+ Capacity is determined as average (2 points) and the coefficient is quite important (coefficient 2), then the score of Capacity criterion is 2 x 2 = 4.
+ Exploitation time is long (4 points), the most important coefficient (coefficient 3) so the score of the Exploitation time criterion is 4 x 3 = 12.
+ Sustainability is determined as sustainable (4 points), the important coefficient is the average coefficient (coefficient 1), so the score of the Sustainability criterion is 4 x 1 = 4 points
+ Location and accessibility are determined to be quite favorable (2 points), the coefficient is quite important (coefficient 2), the criterion score is 2 x 2 = 4 points.
+ Infrastructure is assessed as good (3 points), the coefficient is quite important (coefficient 2), then the score of the Infrastructure criterion is 3 x 2 = 6 points.
The total score for evaluating DLST in Minh Chau commune according to 6 evaluation criteria is determined as: 12 + 4 + 12 + 4 + 4 + 6 = 42 points
Similar assessment for Quan Lan commune, we have the following table:
Table 3.3: Assessment of the potential for natural ecotourism development in Quan Lan and Minh Chau communes
Attractiveness of self-tourismof course
Capacity
Mining time
Sustainability
Location and accessibility
Infrastructure
Result
Point
DarkMulti
Point
DarkMulti
Point
DarkMulti
Point
DarkMulti
Point
DarkMulti
Point
DarkMulti
CommuneMinh Chau
12
12
4
8
12
12
4
4
4
8
6
8
42/52
Quan CommuneLan
6
12
6
8
9
12
4
4
4
8
4
8
33/52
b. Assessment of the potential for humanistic tourism development
For Quan Lan commune:
+ The attractiveness of human tourism is determined to be very attractive (4 points) and the most important coefficient (coefficient 3), so the score of the Attractiveness criterion is 4 x 3 = 12.
+ Capacity is determined to be large (3 points) and the coefficient is quite important (coefficient 2), then the score of the Capacity criterion is 3 x 2 = 6.
+ Mining time is average (3 points), the most important coefficient (coefficient 3) so the score of the Mining time criterion is 3 x 3 = 9.
+ Sustainability is determined as sustainable (4 points), the important coefficient is the average coefficient (coefficient 1), so the score of the Sustainability criterion is 4 x 1 = 4 points.
+ Location and accessibility are determined to be quite favorable (2 points), the coefficient is quite important (coefficient 2), the criterion score is 2 x 2 = 4 points.
+ Infrastructure is rated as average (2 points), the coefficient is quite important (coefficient 2), then the score of the Infrastructure criterion is 2 x 2 = 4 points.
The total score for evaluating DLST in Quan Lan commune according to 6 evaluation criteria is determined as: 12 + 6 + 6 + 4 + 4 + 4 = 36 points.
Similar assessment with Minh Chau commune we have the following table:
Table 3.4: Assessment of the potential for developing humanistic eco-tourism in Quan Lan and Minh Chau communes
Attractiveness of human tourismliterature
Capacity
Mining time
Sustainability
Location and accessibility
Infrastructure
Result
Point
DarkMulti
Point
DarkMulti
Point
DarkMulti
Point
DarkMulti
Point
DarkMulti
Point
DarkMulti
Quan CommuneLan
12
12
6
8
9
12
4
4
4
8
4
8
39/52
Minh CommuneChau
6
12
4
8
12
12
4
4
4
8
6
8
36/52
Basically, both Minh Chau and Quan Lan localities have quite favorable conditions for developing ecotourism. However, Quan Lan commune has more advantages to develop ecotourism in a humanistic direction, because this is an area with many famous historical relics such as Quan Lan Communal House, Quan Lan Pagoda, Temple worshiping the hero Tran Khanh Du, ... along with local festivals held annually such as the wind praying ceremony (March 15), Quan Lan festival (June 10-19); due to its location near the port and long exploitation time, the beaches in Quan Lan commune (especially Quan Lan beach) are no longer hygienic and clean to ensure the needs of tourists coming to relax and swim; this is also an area with many beautiful landscapes such as Got Beo wind pass, Ong Phong head, Voi Voi cave, but the ability to access these places is still very limited (dirt hill road, lots of gravel and rocks), especially during rainy and windy times; In addition, other natural resources such as mangrove forests and sea worms have not been really exploited for tourism purposes and ecotourism development. On the contrary, Minh Chau commune has more advantages in developing ecotourism in the direction of natural tourism, this is an area with diverse ecosystems such as at Rua De Beach, Bai Tu Long National Park Conservation Center...; Minh Chau beach is highly appreciated for its natural beauty and cleanliness, ranked in the top ten most beautiful beaches in Vietnam; Minh Chau commune is also home to Tram forest with a large area and a purity of up to 90%, suitable for building bridges through the forest (a very effective type of natural ecotourism currently applied by many countries) for tourists to sightsee, as well as for the purpose of studying and researching.
Figure 3.1: Thenmala Forest Bridge (India) Source: https://www.thenmalaecotourism.com/(August 21, 2019)
3.2.2. Using SWOT matrix to evaluate Quan Lan island tourism
General assessment of current tourism activities of Quan Lan island is shown through the following SWOT matrix:
Table 3.5: SWOT matrix evaluating tourism activities on Quan Lan island
Internal agent
Strengths- There is a lot of potential for tourism development, especially natural ecotourism and humanistic ecotourism.- The unskilled labor force is relatively abundant.- resource environmentunpolluted, still
Weaknesses- Poorly developed infrastructure, especially traffic routes to tourist destinations on the island.- The team of professional staff is still weak.- Tourism products in general
quite wild, originalintact
general and DLST in particularalone is monotonous.
External agents
Opportunity- Tourism is a key industry in the socio-economic development strategy of the province and Van Don economic zone.- Quan Lan was selected as a pilot area for eco-tourism development within the framework of the green growth project between Quang Ninh province and the Japanese organization JICA.- The flow of tourists and especially ecotourism in the world tends toincreasing
Challenge- Weather and climate change abnormally.- Competition in tourism products is increasingly fierce, especially with other localities in the province such as Ha Long, Mong Cai...- Awareness of tourists, especially domestic tourists, about ecotourism and nature conservation is not high.
Through summary analysis using SWOT matrix we see that:
To exploit strengths and take advantage of opportunities, it is necessary to:
- Diversify products and service types (build more tourism routes aimed at specific needs of tourists: experiential tourism immersed in nature, spiritual cultural tourism...)
- Effective exploitation of resources and differentiated products (natural resources and human resources)
div.maincontent .p { color: black; font-family:"Times New Roman", serif; font-style: normal; font-weight: normal; text-decoration: none; font-size: 14pt; margin:0pt; } div.maincontent p { color: black; font-family:"Times New Roman", serif; font-style: normal; font-weight: normal; text-decoration: none; font-size: 14pt; margin:0pt; } div.maincontent .s1 { color: black; font-family:"Times New Roman", serif; font-style: normal; font-weight: normal; text-decoration: none; font-size: 13pt; } div.maincontent .s2 { color: black; font-family:"Times New Roman", serif; font-style: normal; font-weight: normal; text-decoration: none; font-size: 13pt; } div.maincontent .s3 { color: #0D0D0D; font-family:"Times New Roman", serif; font-style: normal; font-weight: bold; text-decoration: none; font-size: 14pt; } div.maincontent .s4 { color: black; font-family:"Times New Roman", serif; font-style: italic; font-weight: normal; text-decoration: none; font-size: 14pt; } div.maincontent .s5 { color: black; font-family:"Times New Roman", serif; font-style: italic; font-weight: bold; text-decoration: none; font-size: 14pt; } div.maincontent .s6 { color: black; font-family:"Times New Roman", serif; font-style: italic; font-weight: normal; text-decoration: none; font-size: 14pt; vertical-align: -3pt; } div.maincontent .s7 { color: black; font-family:"Times New Roman", serif; font-style: italic; font-weight: normal; text-decoration: none; font-size: 14pt; vertical-align: -2pt; } div.maincontent .s8 { color: black; font-family:"Times New Roman", serif; font-style: italic; font-weight: normal; text-decoration: none; font-size: 14pt; vertical-align: -1pt; } div.maincontent .s9 { color: black; font-family:"Times New Roman", serif; font-style: normal; font-weight: normal; text-decoration: none; font-size: 14pt; } div.maincontent .s10 { color: black; font-family:"Times New Roman", serif; font-style: normal; font-weight: bold; text-decoration: none; font-size: 14pt; } div.maincontent .s11 { color: black; font-family:"Times New Roman", serif; font-style: normal; font-weight: normal; text-decoration: none; font-size: 14pt; } div.maincontent .s12 { color: black; font-family:Symbol, serif; font-style: normal; font-weight: normal; text-decoration: none; font-size: 14pt; } div.maincontent .s13 { color: black; font-family:Wingdings; font-style: normal; font-weight: normal; text-decoration: none; font-size: 14pt; } div.maincontent .s14 { color: black; font-family:"Times New Roman", serif; font-style: normal; font-weight: normal; text-decoration: none; font-size: 9pt; vertical-align: 5pt; } div.maincontent .s15 { color: black; font-family:"Times New Roman", serif; font-style: normal; font-weight: normal; text-decoration: none; font-size: 9pt; vertical-align: 5pt; } div.maincontent .s16 { color: black; font-family:Cambria, serif; font-style: italic; font-weight: normal; text-decoration: none; font-size: 14pt; } div.maincontent .s17 { color: #080808; font-family:"Times New Roman", serif; font-style: normal; font-weight: bold; text-decoration: none; font-size: 14pt; } div.maincontent .s18 { color: #080808; font-family:"Times New Roman", serif; font-style: normal; font-weight: normal; text-decoration: none; font-size: 14pt; } div.maincontent .s19 { color: black; font-family:"Times New Roman", serif; font-style: normal; font-weight: normal; text-decoration: none; font-size: 11pt; } div.maincontent .s20 { color: black; font-family:"Times New Roman", serif; font-style: normal; font-weight: normal; text-decoration: none; font-size: 10pt; } div.maincontent .s21 { color: black; font-family:"Times New Roman", serif; font-style: normal; font-weight: bold; text-decoration: none; font-size: 11pt; } div.maincontent .s22 { color: black; font-family:"Times New Roman", serif; font-style: normal; font-weight: normal; text-decoration: none; font-size: 11pt; } div.maincontent .s23 { color: black; font-family:"Times New Roman", serif; font-style: italic; font-weight: normal; text-decoration: none; font-size: 14pt; } div.maincontent .s24 { color: #212121; font-family:"Times New Roman", serif; font-style: normal; font-weight: normal; tex -
 Research on some technical measures for fertilizing Coffea canephora Pierre coffee trees in the business stage on basalt soil in Dak Lak - 25
 -
 Research on determining varieties and some technical measures to increase productivity and economic efficiency in tomato production in the Red River Delta - 1
 -
 Testing the Necessity and Feasibility of Measures to Improve Teaching Capacity in the Field of Science and Technology for High School Teachers
 -
 Current Status of Soc Son Protective Forest Resources for Tourism Purposes
Table 3.15. Growth of root diameter, height and canopy diameter of Casuarina trees planted on site type group II in Le Thuy
Note: Results are presented with mean and standard deviation (in parentheses); NA: Empty data (no data). In the same column, values with the same letter pattern (a, b, c, ab,…) are not significantly different; conversely, values with different letter patterns are significantly different at the 95% confidence level.
At the age of 24 months, the growth indicators of Casuarina trees were clearly different between the CTTNs compared to the control. The average D0 ranged from 1.28 ± 0.54cm (DC) to 2.21
± 0.62cm (CT3), CV%: 28.1 - 42.2%. VN H from 0.63 ± 0.17m (DC) to 0.90 ± 0.29m
(CT3), CV%: 27.0 - 38.0%. The results of post hoc analysis showed that there was a clear difference between the formulas: CT3~DC, CT2~DC and CT3~CT1 with a confidence level of 95% ( p = 0.0000035).
- 0.0084 ), but between the formulas CT2~CT1, DC~CT1, there was no clear difference in plant height growth ( p = 0.35 - 0.686 ).
Figure 3.4. Anova analysis of growth parameters (left) and post hoc analysis of canopy diameter (right) of Casuarina trees at 24 months of age
on site type group II in Le Thuy
Canopy diameter from 0.66±0.25m (DC) to 1.15±0.44m (CT3), CV%: 34.3 - 38.6%; there is a clear difference between the formulas CT3~DC, CT2~DC, CT3~CT1 and CT2~CT1 ( p < 0.001 ), but there is no clear difference between CT1~DC and CT3~CT2 ( p
= 0.094-0.957 ). ∆D0 = 0.64 - 1.10cm/year, ∆H VN = 0.32 - 0.45m/year and ∆D T = 0.33
- 0.58m/year.
The number of branches longer than 50cm of Casuarina trees had a clear difference between the CTTNs with a confidence level of 95% ( p < 0.001 ), with an average of 0.97 ± 0.28 branches/tree (CT1) to 6.74 ± 0.85 branches/tree (CT3), CV%: 12.3 - 28.9%. The results of the post hoc analysis showed that there were clear differences between CT2~CT1, CT3~CT1, CT2~DC and CT3~DC ( p < 0.001 ), but there was no clear difference between CT3~CT2 and CT1~DC ( p = 0.094 - 0.96 ) in the number of branches longer than 50cm/tree. The survival rate of Casuarina trees at the age of 24 months ranged from 65.2% (DC) to 77.8% (CT3).
Months old | CTTN | Number of branches > 50cm (sd) | Survival rate | Top mortality rate | ||||
TB (branch/tree) | P-value | Average (%) | P-value | TB (%) | P-value | |||
16 | Address | - | - | NA | - | NA | 0.666 | |
CT1 | - | 54.5 | 93.8a | |||||
CT2 | - | NA | NA | |||||
CT3 | - | 67.4 | 90.5a | |||||
24 | Address | 1.09b (2.01 ) | < 0.001 | 70.5a | 0.601 | 85.4a | < 0.001 | |
CT1 | 0.97b (1.63 ) | 68.7a | 71.4b | |||||
CT2 | 5.37a (6.63 ) | 77.3a | 55.4 c | |||||
CT3 | 6.74a (7.07 ) | 71.4a | 39.4 c | |||||
Table 3.16. Number of branches longer than 50cm, rate of dead tops and survival rate of Casuarina trees planted on site type group II in Le Thuy
Note: Results are presented with mean and standard deviation (in parentheses); p < 0.05 is statistically significant and p > 0.05 is not statistically significant.
b) At Trieu Phong
In Trieu Phong, at 14 months of age, the indexes of D0, H VN , D T of Casuarina trees planted on site type II (site types CCcH2KT1 and CCcH3KT1) had clear differences between CTTNs compared to the control. The average D0 was from 1.17 ± 0.19cm (DC) to 1.92 ± 0.33cm (CT3), CV%: 15.4 - 21.3%. The average H VN was from 0.89 ± 0.20m (DC) to
1.40 ± 0.32m (CT3), CV%: 22.5 - 27.4%. However, between CT2~CT1, DC~CT1, and
There was no clear difference between CT3~CT2 ( p = 0.23 - 0.58 ), but there was a clear difference in tree height between CT3~DC, CT2~DC and CT3~CT1 ( p = 0.00011 - 0.02 ). Similarly, the average D T ranged from 0.39 ± 0.14m (DC) to 0.74 ± 0.18m (CT3), CV%: 17.6 - 39.7%; between
CT3~DC and CT2~DC are clearly different ( p <0.001 ), the rest are not clearly different with a significance level of 95% ( p = 0.053 - 0.491 ).
At 24 months of age, the indicators D0, H VN , D T had clear differences with 95% confidence between the CTTN and the control. D0 from 0.93 ± 0.12cm (CT1) to 2.03 ± 0.48cm (CT1), CV%: 12.9 - 23.6%. Average H VN from 0.71 ± 0.21m (CT1) to 1.36 ±
0.36m (CT3), CV%: 24.4 - 33.6%. Post hoc analysis results show that CT3~DC, CT2~DC and CT1~DC are clearly different ( p <0.0001 ), but between CT2~CT1, CT3~CT1 and CT3~CT2 there is no clear difference in tree height ( p = 0.96 - 0.99 ).
Month year old | CTTN | D0 (sd) (cm) | H VN (sd) (m) | D T (sd) (m) | ∆D0 (cm/year) | ∆H VN (m/year) | ∆D T (m/year) |
14 | Address | 1.17c (0.19 ) | 0.89c (0.20 ) | 0.39c (0.14 ) | 0.97 | 0.74 | 0.32 |
CT1 | 1.55b (0.33 ) | 1.06 bc (0.29) | 0.58b (0.23 ) | 1.29 | 0.89 | 0.48 | |
CT2 | 1.82a (0.28 ) | 1.28ab (0.29 ) | 0.68ab (0.12 ) | 1.52 | 1.07 | 0.57 | |
CT3 | 1.92a (0.33 ) | 1.40a ( 0.32 ) | 0.74a (0.18 ) | 1.60 | 1.17 | 0.62 | |
24 | Address | 0.93b (0.12 ) | 0.71b (0.21 ) | 0.48b (0.11 ) | 0.47 | 0.36 | 0.24 |
CT1 | 2.03a (0.48 ) | 1.40a ( 0.47 ) | 1.15a (0.32 ) | 1.02 | 0.70 | 0.58 | |
CT2 | 1.85a (0.43 ) | 1.35a (0.33 ) | 1.02a (0.22 ) | 0.92 | 0.67 | 0.51 | |
CT3 | 2.01a (0.43 ) | 1.36a (0.36 ) | 1.15a ( 0.27 ) | 1.01 | 0.68 | 0.58 |
Table 3.17. Growth of root diameter, height and canopy diameter of Casuarina trees planted on site type group II at Trieu Phong
Note: In the same column, values with the same character pattern (a, b, c, ab, bc, ...) have no difference; on the contrary, values with different character patterns have a statistically significant difference at the 95% confidence level.
Similarly, the average D T index ranges from 0.48 ± 0.11m (DC) to 1.15 ± 0.32m (CT3), CV%: 21.6 - 27.8%. The post hoc analysis results show that the formula pairs: CT3~DC, CT2~DC and CT1~DC are clearly different ( p <0.0001 ), but between CT2~CT1, CT3~CT1 and CT3~CT2 there is no clear difference ( p = 0.207 - 0.99 ) in canopy diameter. ∆D0 = 0.47 - 1.02cm/year; ∆H VN = 0.36 - 0.70m/year, and ∆D T = 0.24 - 0.58m/year.
Figure 3.5. Anova analysis of growth parameters (left) and post hoc analysis of tree height (right) of Casuarina trees at 24 months of age
on the II site group at Trieu Phong
In a previous study, it was shown that the growth of Casuarina on fixed sand (∆D = 1.08 cm/year, ∆H = 1.22 m/year) was higher than on semi-mobile sand and the lowest.
on strongly mobile sand dunes (∆D = 0.57 cm/year) (Nguyen Xuan Quat & Hoang Xuan Ty, 1996) [71]. The results in this study are relatively consistent with the above research results, but have a higher average growth rate, ranging from ∆D0 = 0.79 - 1.10 cm/year (Le Thuy) and from ∆D0 = 0.92 - 1.02 cm/year (Trieu Phong) when applying 100g of organic microbial fertilizer combined with 10g of moisture-retaining agent/hole when planting Casuarina forests on site type group II in the research area.
The average number of branches over 50cm of Casuarina trees ranges from 6.35 ± 0.54 branches/tree (Control) to 12.34 ± 0.52 branches/tree (CT3), CV%: 4.2 - 8.5%; there is a clear difference between CTTNs in the number of branches over 50cm/tree compared to the control ( p <0.001 ), but there is no clear difference between CT2~CT1, CT1~CT3 and CT3~CT2 ( p= 0.181 - 0.884 ). The survival rate of Casuarina trees at 24 months of age ranges from 60.6% (Control) to 75.8% (CT3). With the characteristics of natural conditions, the characteristics of the mobile and semi-mobile sand dunes of coastal sand areas, etc. have affected the growth and development of Casuarina trees in the form of growing upwards or horizontally, growing sloppily; this characteristic is mainly shown in the height of the tree and whether the growing tip of the tree is intact or not, in which, the growth characteristics of the height of the Casuarina tree directly determine the wind protection ability of the forest belt.
Months old | CTTN | Number of branches > 50cm (sd) | Survival rate | Top mortality rate | |||
TB (branch/tree) | P-value | TB (%) | P-value | Average (%) | P- value | ||
14 | Address | - | - | 61.0 ab | 0.000205 | 78.9a | 0.0857 |
CT1 | - | 100.0a | 79.4a | ||||
CT2 | - | 100.0a | 73.5b | ||||
CT3 | - | 81.8b | 72.1b | ||||
24 | Address | 6.35c (2.41 ) | < 0.001 | 76.3b | 0.00573 | 50.0 ab | 0.0764 |
CT1 | 11.21ab (4.35 ) | 70.4b | 82.8a | ||||
CT2 | 10.48b (2.79 ) | 96.0a | 76.2 ab | ||||
CT3 | 12.34a (3.56 ) | 72.9b | 74.5b | ||||
Table 3.18. Number of branches longer than 50cm, rate of dead tops and survival rate of Casuarina trees planted on site type group II at Trieu Phong
Note: Results are presented with mean and standard error (in parentheses); p < 0.05 is statistically significant and p > 0.05 is not statistically significant.
The rate of dead tops of Casuarina trees (the growing tip of the tree is stunted and dies) planted on site type group II in coastal sandy areas is an initial assessment indicator of the growth and development of individuals as well as Casuarina stands according to the status: (i) Casuarina
main trunk, (ii) vertical shoots of Casuarina and (iii) horizontal shoots of Casuarina. The research results show that, at the stage of 14 - 16 months old, the rate of dead tops of Casuarina trees in the forest stands is relatively large, ranging from 72.1 - 79.4% (Trieu Phong) to 80.0 - 90.2% (Le Thuy). At the stage of 24 months old, this rate ranges from 50.0 - 82.8% (Trieu Phong) to 39.4 - 85.4% (Le Thuy); there is a clear difference in the rate of dead tops among the CTTNs, some of the dead trees were replanted and some had their tops withered again. Casuarina trees with dead tops, partly due to people cutting them down for firewood many times or the tops of the trees dying, the trees regenerate shoots very well and gradually form the state of Casuarina horizontal shoots, that is, the tree does not have a clear main trunk, the growing tip is stunted, exists in the form of shoots but is not able to grow higher than 2m, the branches grow low, in the form of horizontal shoots, and grow haphazardly.
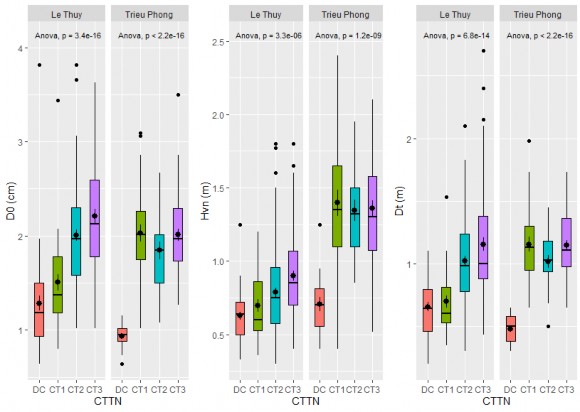
Figure 3.6. Anova analysis of growth indicators of Casuarina trees at 24 months of age on site type II group in Le Thuy and Trieu Phong |
For Casuarina forests after 24 months of age planted on site type II, the survival rate is high (after periodic replanting), ranging from 60.6 - 75.8% (Le Thuy) to 70.4 - 96.0% (Trieu Phong). Although the rate of dead top trees is relatively high, if well cared for, managed and protected, Casuarina trees have the ability to regenerate good shoots to develop upright shoots or main trunks and gradually form Casuarina forest stands.