Shrubs, ground cover vegetation survey according to the following criteria: main species name, average height, coverage, growth status. Survey results are recorded in the following form (Form 03).
+ Soil profile investigation: on each OTC, dig a soil profile in the middle of the OTC, the investigation results are recorded in the form (Form 04).
3.3.3. Data processing
- Processing tree layer data: Composition, Density, layer, canopy cover.
- Processing data of regeneration layer.
Data is processed on Excel software of electronic computer, applying biological statistical methods.
Identify the shoot based on the scar on the base of the tree.
The quality of regenerated trees is assessed based on their morphology and growth vitality and divided into 3 levels: good, average and bad. Good trees are trees with straight trunks, no truncated tops, good growth, development, and no pests or diseases. Average trees are trees that are not crooked, diseased, have no broken branches or truncated tops, but have poor growth ability and may still be being suppressed by the layer of shrubs and fresh carpet. Bad trees are trees that are crooked, truncated tops, have poor growth, development, pests and diseases, and are suppressed by shrubs and fresh carpet.
- Canopy cover: is the percentage of land area covered by vegetation. TC%= ∑score/100, In which: TC% is the canopy cover of ÔTC.
- Use the UNESCO classification framework (1973) to classify vegetation.
- The abundance (or denseness) of the fresh carpet is assessed according to Drude (see table 1) .
Table 3.1. Drude's symbols for vegetation density (thickness)
(According to Thai Van Trung, 1970)
Symbol
Epidermal characteristics | |
Soc | Vegetation grows widely covering 85 - 100% of the area |
Cop3 | Plants grow abundantly, covering 65 - 85% of the area. |
Cop2 | Plants grow abundantly, covering 45 - 65% of the area. |
Cop1 | Plants grow relatively abundantly, covering 25 - 45% of the area. |
Sp | Vegetation covers less than 25% of the area |
Sol | Scattered vegetation covers less than 5% |
Un | A few individual trees |
Gr | Plants are unevenly distributed and grow in clumps. |
Maybe you are interested!
-
 Symbol of To Huu's poetry in the period 1945-1975 - 10
 -
 Assessment of bone density and changes in bone metabolism markers osteocalcin, s-CTx in hyperthyroid patients - 1
 -
 Assessment of bone density and changes in bone metabolism markers osteocalcin, s-CTx in hyperthyroid patients - 2
 -
 Measure 4: Make Tools and Toys to Use in Children's Play Activities
 -
 Perspectives on Improving the Quality of Law Application in Resolving Land Use Rights Disputes at the People's Court
Description of forest vegetation distribution characteristics
From the results of forest tree measurements, the following indicators of forest tree growth are synthesized, processed and calculated: average diameter, average height, average forest density, average cross-sectional area, average forest population volume. Combining natural geographical conditions (climate, terrain, soil type, temperature regime, etc.) and descriptive data in the measurement plots to analyze, evaluate and describe the distribution characteristics of forest vegetation.
From the identified communities with relationships, calculate species composition from growth indicators.
Determine the structure of the tree layer
Determining the composition is one of the important IVI species structure indicators according to the formula:

IVI % =
In there:
IVI% is the species importance level
Who is the species richness?

Who(%) =
Ni is the number of individuals of the ith species; s is the number of species in the population.
Di(%) =
Di is the dominance of the species.
Gi is the cross-sectional area of the species
Gi (cm 2 ) = 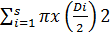 Di is the diameter 1.3 m (D1.3) of the i-th tree
RFi =
Fi  RFi is the relative frequency of occurrence of the species
Fi is the frequency of occurrence of the ith species
N(%) =
N(%) is the quality of regenerated trees
n is the total number of good, average, and bad trees. N is the total number of regenerated trees.
CTV (%) N ( h 1) x 100
CTV(%) is the percentage of promising plants
N (h≥1) trees with height ≥ 1m
: is the total number of re-inspected trees
n ni
i 1
nj %
n j % ≥ 5% then species j is included in the composition formula
n j % < 5% then species j is not included in the ancestral formula
Ki
Ki is the species composition coefficient and i is the number of individuals of species i.
N is the total number of individuals surveyed
Tree density (trees/ha) is calculated by the formula: N
Is the number of trees, S is the area of the survey plot.
Divide the height of regenerated trees into 5 levels as follows: Level I: height < 0.5 m
Level II: height from 0.5 - 1 m Level III: height from 1.0 - 1.5 m Level IV: height from 1.5 - 2.0 m Level V: height from 2.0 - 2.5 m Level VI: height from 2.5 - 3.0 m Level VII: height from 3.0 - 3.5 m Level VIII: height > 3.5 m
PART 4
RESULTS AND RESULTS ANALYSIS
4.1. Evaluate the density, composition, distribution rules, growth and development ability of regenerated trees in Liem Phu Commune, Van Ban District, Lao Cai Province.
4.1.1. Characteristics of tree layer structure
- Based on the results of research and analysis during the internship, the structural characteristics of natural forests are presented in Table 4.1.
Table 4.1. Some characteristic indicators of forest stands in the study area
STT
OTC | D1.3 (cm) | HVN (m) | N/O (number of trees) | N/ha (number) tree) | M/otc (m 3 ) | M/ha (m 3 ) | |
1 | OTC 1 | 25.3 | 14.9 | 63 | 315 | 27.66 | 138.32 |
2 | OTC 2 | 14.3 | 10.8 | 62 | 310 | 11.89 | 59.44 |
3 | OTC 3 | 16.1 | 10.7 | 68 | 340 | 4.01 | 20.05 |
4 | OTC 4 | 14.3 | 13.7 | 55 | 275 | 13.11 | 65.54 |
5 | OTC 5 | 13.4 | 10.3 | 59 | 295 | 9.09 | 45.47 |
6 | OTC 6 | 12.8 | 10.1 | 61 | 305 | 8.32 | 41.59 |
From Table 4.1, we see that the entire study area has OTC 1,2,3,4,5,6 belonging to poor forests according to (Article 8) stipulated in Circular 34/2009/TT-BNNPTNT Regulations on criteria and classification of forest types. We see that in each different OTC, there are different growth rates and densities. The morphological indicators such as D 1.3 and H vn do not fluctuate much. Specifically, the D 1.3 indicator fluctuates from 12.8 cm to 25.3 cm. The H vn indicator fluctuates from 10.1 m to 14.9 m. The tree density in the study area also has differences, ranging from 275 trees/ha to 340 trees/ha. The volume of the forest stands fluctuates from 20.05 m 3 /ha to 138.32 m 3 /ha .
|
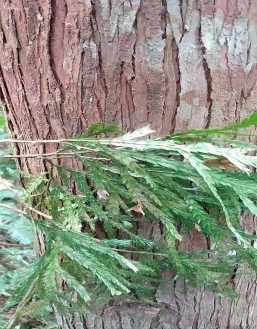
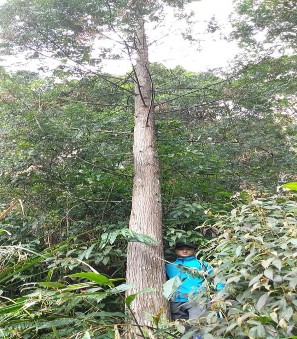
Figure 4.1. Image of po mu tree in the study area
Table 4.2. Structural characteristics of woody plants
OTC
TT | Tree name | number of trees | Unit | D1.3 | Dental | N(%) | F(%) | IVI (%) | |
1 | 1 | Po Mu | 25 | 4.74 | 18.96 | 125 | 39.68 | 38.10 | 38.89 |
2 | Oak | 6 | 1.02 | 17.03 | 30 | 9.52 | 11.65 | 10.58 | |
3 | SP1 | 4 | 1.05 | 26.27 | 20 | 6.35 | 9.92 | 8.14 | |
4 | Salted Apple | 2 | 0.60 | 29.95 | 10 | 3.17 | 6.90 | 5.04 | |
5 | Lk | 26 | 5.65 | 21.73 | 130 | 42.86 | 44,050 | 42.66 | |
2 | 1 | Po Mu | 15 | 1.91 | 12.76 | 75 | 24.19 | 19.07 | 21.63 |
2 | Salted Apple | 9 | 1.20 | 13.34 | 45 | 14.52 | 12.03 | 13.27 | |
4 | Decoding | 7 | 0.98 | 13.94 | 35 | 11.29 | 10.29 | 10.79 | |
5 | Lk | 69 | 4.76 | 6.90 | 345 | 50.00 | 58,610 | 54.31 | |
3 | 1 | Decoding | 4 | 0.74 | 18.57 | 20 | 5.88 | 8.04 | 6.96 |
2 | Ba la | 4 | 0.68 | 17.09 | 20 | 5.88 | 6.38 | 6.13 | |
3 | Oak | 3 | 0.57 | 19.03 | 15 | 4.41 | 6.41 | 5.41 | |
4 | Lk | 89 | 8.97 | 9.90 | 445 | 83.82 | 20,830 | 81.50 | |
4 | 1 | Wild rose | 4 | 0.77 | 19.17 | 20 | 7.27 | 12.24 | 9.76 |
2 | Ba la | 5 | 0.74 | 14.71 | 25 | 9.09 | 9.47 | 9.28 | |
3 | Gold and silver | 5 | 0.59 | 11.71 | 25 | 9.09 | 5.87 | 7.48 | |
4 | Bird's nest | 5 | 0.62 | 12.50 | 25 | 9.09 | 6.58 | 7.83 | |
5 | Forest Spoon | 4 | 0.56 | 13.92 | 20 | 7.27 | 7.09 | 7.18 | |
6 | Decoding | 3 | 0.52 | 17.26 | 15 | 5.45 | 8.16 | 6.81 | |
7 | Pơ mu | 3 | 0.48 | 16.14 | 15 | 5.45 | 6.54 | 6.00 | |
8 | Forest | 3 | 0.47 | 15.79 | 15 | 5.45 | 6.21 | 5.83 | |
9 | Frequency | 2 | 0.38 | 19.14 | 10 | 3.64 | 6.47 | 5.05 | |
10 | Lk | 66 | 2.76 | 4.18 | 330 | 38.18 | 68,620 | 34.78 | |
5 | 1 | Ba la | 5 | 0.72 | 2.01 | 25 | 8.47 | 9,642 | 9.06 |
2 | Wood | 5 | 0.65 | 12.94 | 25 | 8.47 | 8,156 | 8.32 | |
3 | Po Mu | 4 | 0.61 | 15.37 | 20 | 6.78 | 8,709 | 7.74 | |
4 | Xoan nhu | 4 | 0.48 | 12.12 | 20 | 6.78 | 5,148 | 6.1 | |
5 | Fragrant | 3 | 0.48 | 16.14 | 15 | 5.08 | 7.31 | 6.20 | |
6 | Ten Thousand Eggs | 3 | 0.47 | 15.61 | 15 | 5.08 | 6.74 | 5.91 | |
7 | Forest label | 3 | 0.47 | 15.57 | 15 | 5.08 | 6.70 | 5.89 | |
8 | Wild rose | 3 | 0.43 | 14:30 | 15 | 5.08 | 5.65 | 5.37 | |
9 | Lk | 70 | 3.57 | 5.10 | 350 | 49.15 | 41.68 | 45.41 | |
6 | 1 | Wood | 6 | 0.85 | 14.18 | 30 | 9.84 | 11.92 | 10.88 |
2 | Fig | 5 | 0.71 | 14.16 | 25 | 8.20 | 9.96 | 9.08 | |
3 | Fragrant | 4 | 0.61 | 15.13 | 20 | 6.56 | 9.10 | 7.83 | |
4 | Three mirrors | 4 | 0.47 | 11.85 | 20 | 6.56 | 5.59 | 6.07 | |
5 | Decoding | 3 | 0.41 | 13.58 | 15 | 4.92 | 5.53 | 5.22 | |
6 | Ba la | 3 | 0.40 | 13.27 | 15 | 5.42 | 5.42 | 5.17 | |
7 | Lk | 75 | 4.34 | 5.78 | 375 | 52.48 | 52,480 | 55.75 |
From table 4.2 we can establish the composition formula of the forest stand as shown in table
4.3 later.
From table 4.3, the synthesis of the tree layer composition formula according to (IVI%)
OTC
N/OTC | Composition formula | |
1 | 63 | 35.74Pm+8.43s+8.14sp+5.04Tm+42.66Lk |
2 | 62 | 21.63Pm+13.27Tm+10.79PM+54.31Lk |
3 | 68 | 6.96Ph.m+6.13Bl+5.41S+81.50Lk |
4 | 55 | 9.76Hr+9.28Bl+7.48Vk+7.83M+7.18M +6.81Ph.m+6.00Pm+5.83Nr+5.05Ct+34.78Lk |
5 | 59 | 9.06Bl+8.32T+7.74Pm+6.10Xn+6.20N +5.91Vt+5.89Nr+5.37Hr+45.41Lk |
6 | 61 | 10.88T+9.08S+7.83N+6.07Bs+5.22PM +5.17Bl+55.75Lk |
Note:
- PM: Pơ mu - SP: Tree name not yet determined
- N: Fragrant | - S: Oak | |
- PM: Decoding | - BL: Ba la | - S: Sung |
- HR: Wild rose | - NR: Forest | - Doctor: Doctor |
- TR: Forest spoon | - VK: Gold and steel | - CT: Frequency |
- XN: Tuna curly | - VT: Ten Thousand Eggs | - Lk: Other species |
- From the composition formula, we see species such as: Pơ mu, Sói, Táo Muối, Phân mã...etc... Are the dominant species in the forest with a relatively high ratio compared to the number of species in the forest. These are mainly large timber trees, although in terms of economic value they are not the best species, but in terms of ecology, these are species that play an important role in the ecosystem.