


LIABILITIES AND EQUITY | ||||
I | Government and State Bank Debts | 16 | 10,256,943 | - |
II | Deposits from other credit institutions | 17 | 10,449,828 | 9,901.89 |
III | Customer deposits | 18 | 86,919,196 | 64,216.94 |
IV | Derivatives and Financial Liabilities | 7 | 23,351 | - |
V | Funding, investment trust, credit institution loans bear risk | 19 | 270,304 | 298.86 |
VI | Bonds and certificates of deposit | 20 | 26,582,588 | 16,755.82 |
VII | Other debts | 21 | ||
1 | Interest and fees receivable | 1,114,642 | 1,072.40 | |
2 | Accounts payable and other liabilities | 22,157,908 | 5,293.72 | |
TOTAL LIABILITIES | 157,774,760 | 97,539.66 | ||
VIII | CAPITAL AND FUNDS | |||
Capital and funds of the parent bank's owners | ||||
1 | Charter capital | 23 | 7,814,138 | 6,355.81 |
2 | Reserve funds | 24 | 952,949 | 713.55 |
3 | Retained earnings | 24 | 1,339,200 | 697.10 |
IX | Minority shareholder interests | - | - | |
TOTAL LIABILITIES AND EQUITY | 167,881,047 | 105.306.1 | ||
COMMITMENTS AND CONTINGENT LIABILITIES | 42 | 3,010,531 | 1,726.88 |
Maybe you are interested!
-
 Dividend policy at Vietnamese joint stock commercial banks listed on the stock exchange - 14
 -
 Perfecting the Marketing mix policy for fiber optic Internet service at FPT Telecommunication Joint Stock Company Hue Branch - 2
 -
 Research on the relationship between dividend changes and profitability of listed companies on the Vietnamese stock market - 1
 -
 Solution to Improve Human Resource Policy of Cargo Service Joint Stock Company
 -
 Perfecting human resource treatment policy at Vietnam Air Cargo Services Joint Stock Company - 1
Interest and similar income | 26 | 9,613,889 | 10,497.84 | |
2 | Interest and similar expenses | 27 | (6,813,361) | (7,769.58 |
I | Net interest income | 2,800,528 | 2,728.25 | |
3 | Service income | 28 | 987,982 | 680.30 |
4 | Service operating costs | 29 | (118,346) | (73,793 |
II | Net profit from service activities | 869,636 | 606.50 | |
III | Net income from foreign exchange and gold trading | 30 | 422,336 | 678.85 |
IV | Net profit/(loss) from trading of trading securities | 33 | 20,637 | (30,067 |
V | Net profit from trading of investment securities | 34 | 551,718 | 46.29 |
5 | Income from other activities | 187,587 | 38.48 | |
6 | Other operating expenses | (32,398) | (1,130 | |
VI | Net income from other activities | 155,189 | 37.35 | |
VII | Dividend income from capital contribution, share purchase | 35 | 115,026 | 172.27 |
VIII | General management costs | 36 | (1,809,462) | (1,590,90 |
IX | Net operating profit before credit provision expenses | 3,125,608 | 2,648,57 | |
X | Credit risk provision cost | (287,444) | (87,993 | |
XI | Total profit before tax | 2,838,164 | 2,560.58 | |
7 | Current corporate income tax expense | 38 | (665,075) | (349.89 |
8 | Deferred corporate income tax expense | 22, 38 | 28,115 | - |
XII | Corporate income tax expense | (636,960) | (349.89 |
XIII
XIV
Profit after tax Minority shareholder interests | 2,201,204 2,210,68 - - | ||
PROFIT ATTRIBUTED TO SHAREHOLDERS OF PARENT BANK | 2,201,204 2,210,68 | ||
Explanation | VND/share VND/share | ||
XV | Earnings per share attributable to shareholders of the Bank Basic earnings per share | 25.1 | 3.042 3.56 |
Diluted earnings per share | 25.2 | 2.751 2.97 |


2008 2007
10,497,846 | ||||
2 | Interest and similar expenses | 26 | (7,769,589) | (3,227,028 |
I | Net interest income | 2,728,257 | 1.311.10 | |
3 | Service income | 27 | 680.301 | 342,592 |
4 | Service operating costs | 28 | (73,793) | (71,377) |
II | Net profit from service activities | 606,508 | 271,215 | |
III | Net income from foreign exchange and gold trading | 29 | 678,852 | 155,140 |
IV | Net (loss)/gain from trading of trading securities | 32 | (30,067) | 344,990 |
V | Net profit from trading of investment securities | 33 | 46,291 | 896,792 |
5 | Income from other activities | 38,486 | 90,817 | |
6 | Other operating expenses | (1,130) | (85,891) | |
VI | Net income from other activities | 37,356 | 4,926 | |
VII | Dividend income from capital contributions, share purchases and investments | 34 | 172,279 | 36,653 |
VIII IX | General management costs Net operating profit before projected expenses | 35 | (1,590,903) | (804,650 |
Note
Million Dong
(Representation)


credit risk room
2 648 573 2 216 17


X Credit risk provision expenses (87,993) (89,357)
XI Total profit before tax 2,560,580 2,126,81


37 (349,898) | (366,807 | |
XIII Profit after tax | 2,210,682 | 1,760.00 |
XIV Minority Shareholder Interests | - | (215) |
PROFIT ATTRIBUTED TO SHAREHOLDERS OF PARENT BANK | 2,210,682 | 1,759.79 |
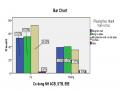
Appendix 4: Business performance of some other banks in 2011
Unit: Billion VND
Bank | Revenue | Gross profit | Profit active | Net profit |
dynamic | ||||
ACB | 25,453 | 7,661 | 4,514 | 3,219 |
CTG | 55,792 | 22,548 | 13,272 | 6,280 |
EIB | 17,641 | 6,237 | 4,327 | 3,038 |
HBB | 5,803 | 1,299 | 619 | 262 |
MBB | - | - | - | - |
NVB | 2,691 | 688 | 310 | 181 |
PVF | 5,506 | 1,954 | 651 | 368 |
SHB | 7,771 | 2,228 | 1,103 | 753 |
STB | 17,864 | 6,721 | 3,160 | 1,996 |
VCB | 34,003 | 14,873 | 9,144 | 4,241 |
Unit: Billion VND
ACB CTG EIB HBB MBB NVB PVF SHB
STB
VCB
CEO product | Short-term debt | Total bow | Equity retired |
281,033 | - | 267,188 | 13,845 |
460,838 | - | 432,120 | 28,509 |
183,585 | - | 167,281 | 16,303 |
41,868 | - | 37,191 | 4,677 |
138,482 | 500 | 0 | 10,826 |
22,573 | - | 19,343 | 3,230 |
89,421 | - | 82,132 | 6,841 |
70,993 | - | 65,158 | 5,834 |
141,532 | - | 126,987 | 14,545 |
366,750 | - | 337,272 | 29,335 |
Financial indicators of banks
P/E | P/B | ROA | ROE | Debt/Equity | |
ACB CTG EIB HBB MBB NVB PVF SHB STB VCB | 7.5 | 1.73 | 1.2% | 24.4% | 19:30 |
7.1 | 1.57 | 1.4% | 23.7% | 15.16 | |
7.4 | 1.37 | 1.8% | 19.2% | 10.26 | |
11.0 | 0.61 | 0.6% | 5.6% | 7.95 | |
4.1 | 1.26 | 1.6% | 21.7% | 10.21 | |
13.2 | 0.74 | 0.8% | 5.6% | 5.99 | |
23.3 | 1.25 | 0.4% | 6.9% | 12.01 | |
6.9 | 0.89 | 1.1% | 13.1% | 11.17 | |
12.3 | 1.69 | 1.4% | 17.3% | 8.73 | |
13.7 | 1.99 | 1.2% | 14.6% | 11.50 |
Appendix 5: Analysis of survey indicators
FREQUENCIES VARIABLES=Hinhthuccotuc Phuongthuccotuc
/PIECHART FREQ
/ORDER=ANALYSIS.
Frequencies
[DataSet1] F:Chau SonThesis DefenseNH shareholder survey data.sav
Statistics
Payment method have | Payment method have | |
N Valid Missing | 300 0 | 300 0 |
Frequency Table
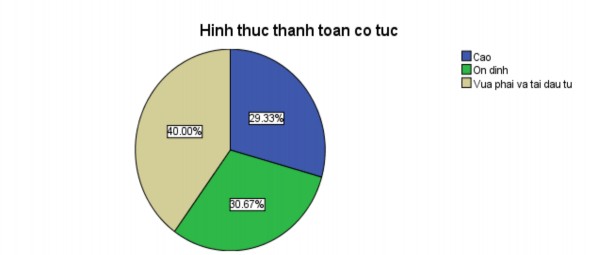
Form of payment available
Frequency | Percent | Valid Percent | Cumulative Percent | |
High Validity | 88 | 29.3 | 29.3 | 29.3 |
On dinh | 92 | 30.7 | 30.7 | 60.0 |
Right and wrong investment | 120 | 40.0 | 40.0 | 100.0 |
Total | 300 | 100.0 | 100.0 |
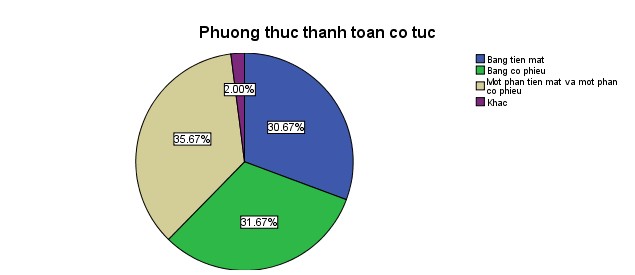
Payment method available
Frequency | Percent | Valid Percent | Cumulative Percent | ||
Valid | Cash | 92 | 30.7 | 30.7 | 30.7 |
Stock exchange | 95 | 31.7 | 31.7 | 62.3 | |
Part cash and part stock | 107 | 35.7 | 35.7 | 98.0 |
Other Total | 6 300 | 2.0 100.0 | 2.0 100.0 | 100.0 |
Pie Chart
T-TEST GROUPS=DtuNH(1 2)
/MISSING=ANALYSIS
/VARIABLES=Method
/CRITERIA=CI(.9500).
[DataSet1] F:Chau SonThesis DefenseNH shareholder survey data.sav
Group Statistics
Investment
to bank
N | Mean | Std. Deviation | Std. Error Mean | |
Short-term payment method with long-term interest | 124 176 | 2.1855 2.0227 | .86829 .84822 | .07798 .06394 |
Independent Samples Test
Levene's Test for Equality of Variances | t-test for Equality of Means | ||||||||
F | Sig. | t | df | Sig. (2- tailed) | Mean Difference nce | Std. Error Different e | 95% Confidence Interval of the Difference | ||
Lower | Upper | ||||||||
Equal method is assumed to have variances equal variances not assumed | .77 6 | .379 | 1,621 1,614 | 298 261.0 56 | .106 .108 | .16276 .16276 | .10043 .10084 | -.03488 -.03580 | .3603 9 .3613 1 |
T-TEST GROUPS=DtuNH(1 2)
/MISSING=ANALYSIS
/VARIABLES=Picture
/CRITERIA=CI(.9500).
[DataSet1] F:Chau SonThesis DefenseNH shareholder survey data.sav
Group Statistics
Investment
to bank
N | Mean | Std. Deviation | Std. Error Mean | |
Short-term payment method Dai Han | 124 176 | 2.1613 2.0682 | .80028 .84577 | .07187 .06375 |
Independent Samples Test
Levene's Test for Equality of Variances | t-test for Equality of Means | ||||||||
F | Sig. | t | df | Sig. (2- tailed) | Mean Difference | Std. Error Different e | 95% Confidence Interval of the Difference | ||
Lower | Upper | ||||||||
Image Equal True variances assume equal accounting no variances assumed | .705 | .402 | .96 0 .96 9 | 298 273.6 48 | .338 .333 | .09311 .09311 | .09700 .09607 | -.09778 -.09602 | .28399 .28224 |
CROSSSTABS
/TABLES=CodongNH BY Phuongthuccotuc
/FORMAT=AVALUE TABLES
/STATISTICS=CHISQ PHI
/CELLS=COUNT
/COUNT ROUND CELL
/BARCHART.