ANI International Training Academy ANI City City
BDHTKH Customer Journey Map
CSI Service Satisfaction Index
NPS An index that measures the level of information responsiveness and the level of customer willingness to continue using products, services and recommending
Average Value
Maybe you are interested!
IELTS International English Language Testing System TOEIC Test of English for International Communication
Image Catalog
![Customer journey research at ANI International Training Academy - 2]()
Figure 1. Company logo 34
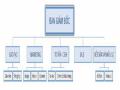
Figure 2. Organizational structure 35
Diagram list
Figure 1: AIDA journey model diagram by E. St. Elmo Lewis, 1898 19
Diagram 2. 5A journey model: Customer journey in the 2020 connected age
Diagram 3: Customer journey diagram via 5A model 33
List of chartsList of tablesPART I: INTRODUCTION1.2 Research objectives1.2.2 Specific research objectives1.3 Research subjects and scopeScope of research:1.4 Research methodsInformation collected:1.4.1.2 Primary data collection:*Determining sample size and selecting samples:1.4.2 Synthesis and analysis methodsCHAPTER 1: SCIENTIFIC BASIS OF CUSTOMER JOURNEY1.1.1 Concept of customer journey1.1.2 Elements of customer journey1.1.3 Model of Customer journey mapDiagram 1: AIDA journey model diagram by E. St. Elmo Lewis, 1898Diagram 2. The 5A Journey Model: The Customer Journey in the Digital Age1.1.4 Benefits of Building a Customer Journey Map Businesses can refocus their company with an “inbound” perspective. Businesses can create a new target customer base. Businesses can proactively perform customer service. Businesses can improve their customer retention rates.1.1.5 Customer Journey Building ProcessStep 1: Make a list of habitsStep 2: Identify goals and choose the main goalStep 3: Divide the stagesStep 4: Identify goals (Task Set)Step 5: Identify tasks (Set of habits)Step 6: Create habits through BrainstormingStep 7: Identify the relationship between goals / tasksStep 8: Mark the starting and ending points of each goal targetStep 9: Draw dividing lines between stagesStep 10: Specify pain points for each goal1.2 Related research1.2.2 Domestic research1.3 Propose a theoretical research framework.Diagram 3: Customer journey diagram through the 5A modelCHAPTER 2: CUSTOMER JOURNEY ANALYSIS AT THE ACADEMYFigure 1. Company logo2.1.2 Formation and development process2.1.3 Organizational structureFigure 2. Organizational structure2.2. Business performance of ANI International Training Academy in the period of 2019 - 2020.Table 2.1. Business performanceTable 2.2. Number of students2.3 Results of customer journey research at ANI International Training AcademyChart 1. Sample structure chart by genderChart 2. Sample structure chart by incomeChart 3. Sample structure chart by schoolChart 4. Sample structure chart by school yearChart 5. Sample structure chart by reason for choosing to study B1Chart 6. Sample structure chart by criteria for choosing to study B1 at ANIChart 7. Information search source chart2.3.2 Awareness stageChart 8. Chart of the percentage of students spending time searching for informationChart 9. Chart of the purpose of finding B1 coursesChart 10. Chart of difficulties and obstacles when registering for coursesTable 2.3. Student Satisfaction Assessment Table at Touchpoints2.3.3 Attraction PhaseChart 11. Chart of the rate of being attracted to ANI's activitiesChart 12. Chart of the effects of being attractedChart 13. Chart of obstacles to making an impressionTable 2.4. Student Satisfaction Assessment Table at Touchpoints in Phase2.3.4 Inquiry PhaseChart 14. Chart of the rate of learning more about ANI's B1 courseChart 15. Chart of the purpose of learning more about the courseTable 2.5.Student satisfaction assessment table at touch pointsChart 16. Obstacle chart when learning in depth2.3.5 Action phaseChart 17. Chart of B1 course selection rate at ANIChart 18. Chart of purpose of choosing B1 course at ANIChart 19. Chart of difficulty when choosing B1 course at ANITable 2.6. Student satisfaction assessment table in action phase2.3.6 Support phaseChart 20. Chart of continuing to choose ANIChart 21. Chart of ANI referral rateChart 22. Chart of purpose when introducing and supportingChart 23. Chart of difficulty when introducing and supportingTable 2.7. Student satisfaction assessment table at touch points in phase2.4 Testing the difference between men and women in the experience on ANI channelsTable 2.8. Testing the difference between men and women in the experience on ANI channelsCHAPTER 3: ORIENTATION AND SOLUTIONS TO OPTIMIZE CUSTOMER EXPERIENCE AT ANI INTERNATIONAL TRAINING ACADEMY3.1.2 Analysis of the strengths and weaknesses of ANI International Training Academy in the process of building current customer experience3.3. Solutions to optimize customer experience at ANI International Training Academy3.3.1 Awareness stage3.3.2 Attraction stage3.3.3 Learning stage3.3.4 Action stage3.3.6 Support stagePART III: CONCLUSION AND RECOMMENDATIONS2. Recommendations for the state and local authorities3. Limitations of the topicAPPENDIXAPPENDIX 2: STUDENT SURVEY QUESTIONNAIREPART I: SCREENING QUESTIONSPART II: MAIN CONTENTSTAGE 1: Recognizing the necessity of learning a foreign languageSTAGE 2: Paying attention to information and activities of the International Training AcademySTAGE 3: Learning more about the B1 course at ANISTAGE 4: Choosing to buy and experience the courseSTAGE 5: Introducing and supporting ANI International Training AcademyPART III: RESPONDENT INFORMATIONThank you very much for participating in the survey.1. Introduction (5 minutes)2. Learning about the students (5 minutes)3. Learn about the students' experiences throughout the experience journey (40 minutes)3.2 Learn about the students' "attraction" phase3.3 Learn about the students' "learning" phase3.4 Learn about the "Action" phase3.5 Learn about the "Support" phase4. Propose changes (5 minutes)APPENDIX 4: SPSS ANALYSIS RESULTS5.1345679101113141517181921222324812162025Testing the difference between 2 populations8121620254 Testing the difference between men and women in the experience on ANI channelsTable 2.8. Testing the difference between men and women in the experience on ANI channelsCHAPTER 3: ORIENTATION AND SOLUTIONS TO OPTIMIZE CUSTOMER EXPERIENCE AT ANI INTERNATIONAL TRAINING ACADEMY3.1.2 Analysis of the strengths and weaknesses of ANI International Training Academy in the process of building current customer experience3.3. Solutions to optimize customer experience at ANI International Training Academy3.3.1 Awareness stage3.3.2 Attraction stage3.3.3 Learning stage3.3.4 Action stage3.3.6 Support stagePART III: CONCLUSION AND RECOMMENDATIONS2. Recommendations for the state and local authorities3. Limitations of the topicAPPENDIXAPPENDIX 2: STUDENT SURVEY QUESTIONNAIREPART I: SCREENING QUESTIONSPART II: MAIN CONTENTSTAGE 1: Recognizing the necessity of learning a foreign languageSTAGE 2: Paying attention to information and activities of the International Training AcademySTAGE 3: Learning more about the B1 course at ANISTAGE 4: Choosing to buy and experience the courseSTAGE 5: Introducing and supporting ANI International Training AcademyPART III: RESPONDENT INFORMATIONThank you very much for participating in the survey.1. Introduction (5 minutes)2. Learn about the students (5 minutes)3. Learn about the students' experiences throughout the experience journey (40 minutes)3.2 Learn about the students' "attraction" phase3.3 Learn about the students' "learning" phase3.4 Learn about the "Action" phase3.5 Learn about the "Support" phase4. Suggest changes (5 minutes)APPENDIX 4: SPSS ANALYSIS RESULTS5.1345679101113141517181921222324812162025Testing the difference between 2 populations8121620254 Testing the difference between men and women in the experience on ANI channelsTable 2.8. Testing the difference between men and women in the experience on ANI channelsCHAPTER 3: ORIENTATION AND SOLUTIONS TO OPTIMIZE CUSTOMER EXPERIENCE AT ANI INTERNATIONAL TRAINING ACADEMY3.1.2 Analysis of the strengths and weaknesses of ANI International Training Academy in the process of building current customer experience3.3. Solutions to optimize customer experience at ANI International Training Academy3.3.1 Awareness stage3.3.2 Attraction stage3.3.3 Learning stage3.3.4 Action stage3.3.6 Support stagePART III: CONCLUSION AND RECOMMENDATIONS2. Recommendations for the state and local authorities3. Limitations of the topicAPPENDIXAPPENDIX 2: STUDENT SURVEY QUESTIONNAIREPART I: SCREENING QUESTIONSPART II: MAIN CONTENTSTAGE 1: Recognizing the need to learn a foreign languageSTAGE 2: Paying attention to information and activities of the International Training AcademySTAGE 3: Learning more about the B1 course at ANISTAGE 4: Choosing to buy and experience the courseSTAGE 5: Introducing and supporting ANI International Training AcademyPART III: RESPONDENT INFORMATIONThank you very much for participating in the survey.1. Introduction (5 minutes)2. Learn about the students (5 minutes)3. Learn about the students' experiences throughout the experience journey (40 minutes)3.2 Learn about the students' "attraction" phase3.3 Learn about the students' "learning" phase3.4 Learn about the "Action" phase3.5 Learn about the "Support" phase4. Suggest changes (5 minutes)APPENDIX 4: SPSS ANALYSIS RESULTS5.1345679101113141517181921222324812162025Testing the difference between 2 populations8121620254 Learn about the “Action” stage3.5 Learn about the “Support” stage4. Propose changes (5 Minutes)APPENDIX 4: SPSS ANALYSIS RESULTS5.1345679101113141517181921222324812162025Testing the difference between 2 populations8121620254 Learn about the “Action” stage3.5 Learn about the “Support” stage4. Propose changes (5 Minutes)APPENDIX 4: SPSS ANALYSIS RESULTS5.1345679101113141517181921222324812162025Testing the difference between 2 populations812162025
Chart categories
Figure 1. Sample structure chart by gender 40
Chart 2. Sample structure chart by income 40
Figure 3. Sample structure chart by school 41
Chart 4. Sample structure chart by school year 41
Chart 5. Sample structure chart by reason for choosing to study B1 42
Chart 6. Sample structure chart according to selection criteria for B1 study at ANI 42
Figure 7. Information search source chart 43
Chart 8. Chart of the percentage of students spending time searching for information 44
Figure 9. B1 Course Search Purpose Chart 44
Chart 10. Chart of difficulties and obstacles when registering for course 45
Figure 11. Graph of the proportion attracted to ANI activities 47
Figure 12. Graph of the effect of being attracted 48
Figure 13. The chart of things that hinder making an impression 48
Figure 14. ANI 51's deeper learning rate chart for B1 course
Figure 15. Goal chart of further study of the course 51
Figure 16. Obstacles to Deep Learning Chart 53
Figure 17. Chart of B1 course selection rate at ANI 54
Chart 18. Chart of purpose of choosing B1 course at ANI 54
Chart 19. ANI referral rate chart.................................Chart 20. Chart of difficulties in choosing B1 course at ANI.....
Chart 21. ANI continued selection ratio chart .................
Figure 22. Purpose chart when introducing and supporting 59
Figure 23. Difficulty chart in introducing and supporting 60
Table of Contents
Table 2.1. Business performance 36
Table 2.2. Number of students 39
Table 2.3. Table of assessment of students' satisfaction level at touch points in the phase
recognition paragraph 46
Table 2.4. Table of assessment of students' satisfaction level at touch points in the phase
attractive paragraph 49
Table 2.5. Table of assessment of students' satisfaction level at touch points in the phase
research section 52
Table 2.6. Table of assessment of students' satisfaction level in the action phase 56
Table 2.7. Table of assessment of students' satisfaction level at touch points in the phase
support section 61
Table 2.8. Testing the difference between men and women in the experience on ANI channels 62
PART I: INTRODUCTION
1.1 Reasons for choosing the topic
With the development of social networks and integration trends, customer relationships are increasingly expanding, so instead of paying attention and caring about branded content, customers tend to proactively seek information that they like and want to access authentic and reliable sources of information - especially from friends, relatives and private networks on social networks. At this time, to reach customers, businesses need to understand the customer journey to create appropriate content at each customer contact point.
The customer journey is the entire experience stages that customers go through when they interact with a business. With the customer journey, businesses understand the touchpoints and intervene in the touchpoints to create an optimal and consistent experience throughout the customer journey.
The same is true for the education service industry, in the integration trend, the need to learn foreign languages is increasingly concerned, especially English, to serve the purpose of studying, working and living. Along with that, more and more English centers are opening. In Thua Thien Hue province in particular, there are more than 10 English centers for students from 4 to 22 years old. There are too many choices, making it difficult for customers to make decisions. To create a distinct advantage compared to other centers, ANI needs to draw a customer journey, create optimal experiences and meaningful connections for customers.
For ANI Hue, the total number of students registered for the course is 461 students. Of which, the number of students registered for B1 is 165 students, equivalent to 35.8% of the total number of students.
With that necessity, the author decided to choose the topic "Research on customer journey at ANI" as his graduation thesis.
1.2 Research objectives
1.2.1 General research objectives
The aim of the topic is to study and research the stages of the experiential journey.
of B1 learners with ANI, goals, barriers and touch points of each stage. From
that creates marketing solutions for the ANI brand to create experiences
different and meaningful experiences for students that are more suited to their needs.
1.2.2 Specific research objectives
(1) Systematize theoretical issues related to the customer journey of the student.
member at ANI.
(2) Survey, identify the purpose, barriers, and contact points in each stage to build the customer journey of ANI students.
(3) Propose some solutions and strategies to help ANI understand customers better, thereby improving
High marketing efficiency helps ANI recruit more students.
1.3 Research object and scope
Research object: The research object is the customer experience journey of B1 students at ANI.
Survey subjects: Students who are studying B1 at ANI.
 Research on customer journey at ILEAD AMA Hue International English Center System - 21