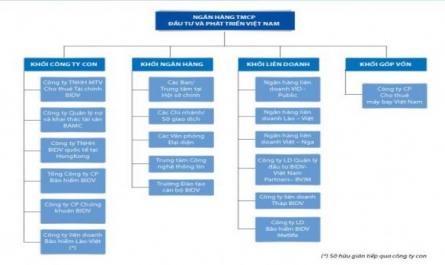
Frequency Distribution of Test Results No. 2
* Average score: TN group: n n i X i n X i 1 n i i 1 = 6.01 Control group: n n i Y i n Y i 1 n i i 1 = 5.33 Table 3.8: Grading of test number 2 Group T.number HS (n) Classification Least Weak Average Rather Good Point 1 - 2 3 - 4 5 - 6 7 - 8 9 - 10 TN 128 HS ...