2.1.5.2. Business performance of Nhi Na Company Limited in the period of 2018-2019
Table 2.4. Fluctuations in the Company's business performance
Nhi Na LLC 2018-2019
(Unit: VND)
INDICATORS
2018 (million dong) | 2019 (million dong) | +/- (million dong) | Proportion (%) | |
Revenue from sales and service provision | 1,807 | 2,604 | 797 | 44.1 |
Net revenue from sales and services | 1,807 | 2,604 | 797 | 44.1 |
Cost of goods sold | 1,584 | 2,213 | 629 | 39.7 |
Gross profit from sales and service provision | 222 | 390 | 168 | 75.7 |
Business management costs | 152 | 168 | 16 | 10.5 |
Net profit from operations business | 70 | 221 | 151 | 215.7 |
Total accounting profit before tax | 72 | 221 | 149 | 206.9 |
Corporate income tax expense | 14 | 44 | 30 | 214.3 |
Profit after corporate income tax | 57 | 177 | 120 | 210.5 |
Maybe you are interested!
-

 Factors Affecting Business Performance of Meiko Trading and Construction Company Limited
 -
 Production and Business Performance Results of La Nga Forestry Company Limited
 -
 Accounting determines business performance at Thanh Son Company Limited and factors affecting the effectiveness of this accounting work - 21
 -
 Business Performance of the Company in the Period 2009–2011 Table 2.1. Business Results of Viet Holiday Travel Company
 -
 Company's Business Performance Results for 3 Years (2018-2020)

Hue University of Economics
(Source: Author processed from data of Accounting-Finance Department of Nhi Na Company Limited)
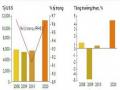
Through the above data table, the business performance of Nhi Na Company Limited in the period of 2018-2019 is shown as follows:
+ The company's net revenue from sales and service provision in 2018 was 1,807 million VND, in 2019 the revenue was 2,604 million VND, an increase of 797 million VND compared to 2018 (equivalent to an increase of 44.1%). Nhi Na Company Limited does not have any revenue deductions, so the revenue from sales and service provision is also the net revenue from sales and service provision.
+ The company's cost of goods sold in 2018 was 1,584 million VND. In 2019, the company's cost of goods sold was 2,213 million VND, an increase of 629 million VND compared to 2018 (equivalent to an increase of 39.7%).
+ The company's gross profit from sales and service provision in 2018 was 222 million VND, in 2019 the profit was 390 million VND, an increase of 168 million VND compared to 2018 (equivalent to an increase of 75.7%).
+ The company's business management cost in 2018 was 152 million VND, in 2019 the company's business management cost was 168 million VND, an increase of 16 million VND compared to 2018 (equivalent to an increase of 10.5%).
Hue University of Economics
+ The company's net profit from business operations in 2018 was 70 million VND, in 2019 the profit was 221 million VND, an increase of 151 million VND compared to 2018 (equivalent to an increase of 215.7%). The company's total pre-tax accounting profit in 2018 was 72 million VND, in 2019 it was 221 million VND, an increase of 149 million VND (equivalent to an increase of 206.9%).
+ The company's corporate income tax expense in 2018 was 14 million VND, in 2019 the corporate income tax expense was 44 million VND, an increase of 30 million VND compared to 2018 (equivalent to an increase of 214.3%). Accordingly, the company's profit after corporate income tax in 2018 was 57 million VND, in 2019 the company's profit after corporate income tax was 177 million VND, an increase of 120 million VND (equivalent to an increase of 210.5%).
In general, the business performance of Nhi Na Company Limited in the period of 2018-2019 fluctuated in a positive direction: the company's revenue and profit indicators increased rapidly. Therefore, this is a good sign for the company's service provision activities. However, the company also needs to focus on saving costs, company budget, strengthening service quality, staff quality and facilities to increase revenue and enhance competitive advantage compared to competitors in the industry.
2.2. Research results
2.2.1. Characteristics of the survey sample
2.2.1.1. Sample structure by gender
Table 2.5. Sample structure by gender
Target
Number of replies | Rate (%) | |
Male | 55 | 45.8 |
Female | 65 | 54.2 |
(Source: Author processed from survey data)
45.8
54.2
Male Female
Hue University of Economics
Figure 2.1. Chart of gender ratio of surveyed customers
(Source: Author processed from survey data)
Based on the chart above, the proportion of men and women is quite different. The number of female respondents is 54.2% while the number of male respondents is only 45.8%. This may be because during the interview process, women tend to cooperate more than men.
2.2.1.2. Sample structure by age
Table 2.6. Sample structure by age
Target
Number of replies | Rate (%) | |
Under 18 years old | 6 | 5 |
18 - 40 years old | 51 | 42.5 |
40 - 60 years old | 36 | 30 |
Over 60 years old | 27 | 22.5 |
(Source: Author processed from survey data)
5
22.5
42.5
30
Under 18 years old From 18 - 40 years old From 40 - 60 years old Over 60 years old
Hue University of Economics
Chart 2.2. Chart of the proportion of each age group of surveyed customers
(Source: Author processed from survey data)
Based on the chart above, the company's main customer group is from 18 to 40 years old because they account for nearly half of the customers (42.5%). The second group is the customer group from 40 to 60 years old (30% of the total). Meanwhile, the group of customers over 60 years old accounts for 22.5% and the group of customers under 18 years old accounts for 5% of the total. This is because the group of customers from 18 to 40 years old are mainly young, dynamic, have a fairly stable income and are in the best health of the remaining customer groups, so they have more conditions to participate in long trips or business trips. The group of customers from 40 to 60 years old are middle-aged people, with high incomes.
The group of customers over 60 years old and under 18 years old are those with unstable income, it is difficult for them to make their own decisions in participating in a long trip, so the number is quite modest.
2.2.1.3. Sample structure by occupation
Table 2.7. Sample structure by occupation
Target
Number of replies | Rate (%) | |
Student | 26 | 21.7 |
Business | 29 | 24.2 |
Officer | 31 | 25.8 |
Retirement | 27 | 22.5 |
Housewife | 3 | 2.5 |
General labor | 4 | 3.3 |
Hue University of Economics
(Source: Author processed from survey data)
2.5
3.3
21.7
22.5
24.2
25.8
Student / Pupil Business Civil servant Retired Housewife General worker
Chart 2.3. Chart of the proportion of each industry group of surveyed customers
(Source: Author processed from survey data) Based on the chart above, the group of customers working as civil servants accounts for the largest number (accounting for 25.8%). Next is the group of customers working in business sectors, which also accounts for a fairly high proportion of the total number of customers surveyed (accounting for 24.2%). That can be
This is because the group of customers who are civil servants and business people have a fairly high and stable financial source, so they have many conditions to join the tour with their family and colleagues. Meanwhile, the group of retired customers accounts for 22.5% and the group of students accounts for 21.7%. The group of retired customers and students often have a lot of time to travel and picnic with their friends, although their financial conditions are not too abundant. The group of customers who are housewives and manual workers accounts for a rather modest proportion, 2.5% and 3.3% respectively.