Data related to the research objectives include secondary and primary data collected from the following sources:
(i) Secondary data: from summary reports, journals, theses, and published scientific research works.
(ii) Primary data: from analysis, synthesis, results collected through interviews, discussions with experts experienced in the fields of accounting, auditing, banking based on the outline and discussion questions with experts on factors affecting the effectiveness of the internal control system in Vietnamese commercial banks. (see Appendix 2: Discussion content with experts). Data collection time was conducted until December 2015.
- For data sources from documents:
Data from document sources accessed by the author are in the form of annual banking activity summary reports and 10-year and 20-year summary reports of the State Bank and commercial banks, term reports of the Vietnam Banking Association and documents at domestic and international conferences on internal control systems of commercial banks. Documents from domestic and foreign studies on internal control systems in commercial banks in the form of articles, reviews, theses, research works at universities, collected by the author during the teaching and research process are compiled according to each topic and research period. Thereby, helping the author to summarize theoretical issues on internal control systems and the effectiveness of internal control systems, combined with experience gained from teaching and working in related fields to help the author understand and solve research-related tasks conveniently.
- For data collected from discussion and interview results: data received during discussion and interview by taking notes or recording will be systematized according to criteria and content suitable for the purpose of the research to be sent to experts for confirmation. These data will be saved in files and opinions will be compiled by each group of experts to extract content suitable for the research objectives.
3.2.2. Survey subjects in qualitative research
To collect information for the research purpose and conduct in-depth expert interviews. First, through research, contact and assessment of the level of expertise of experts in the fields of accounting, auditing, and banking, a list of experts expected to be selected to participate in the interview was established (expected list of 40 experts). After contacting and discussing with experts about the research purpose and interview plan, a list of experts who agree to participate in the interview will be made and the interview step will be carried out according to plan.
In order to increase the objectivity and scientific nature of the research results, the survey subjects were established to ensure the implementation of the identified research framework, including subjects specializing in research and activities in the banking sector with a lot of experience, a lot of research and deep understanding of the internal control system in banks.
-Regarding the structure of experts selected for interviews:
(1) Board of Directors, Executive Board, heads of functional departments at banks and branches of Vietnamese commercial banks
(2) State management units on banking: Leaders of the Ministry of Finance, State Bank of Vietnam.
(3) Professional Association
(4) Researchers and lecturers in auditing and banking: Board members, deans and vice deans, experienced lecturers
(5) Leaders of banking magazines
- Experience standards : the interviewed experts are those who have actually worked in auditing, banking or participated in leadership and research in the field of auditing, banking for 10 years or more and have published many studies on banking activities.
-Qualification standards : Master's degree or higher, focusing on highly qualified experts such as: PhD, associate professor, professor.
3.2.3. Process and method of qualitative data analysis
The methods and procedures in qualitative data analysis of the thesis are carried out as follows:
3.2.3.1. Implementation process
Step 1:
Organize and prepare data
Step 2
Read all data again
Step 3
Data encryption
Step 4
Factor synthesis
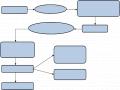
In this thesis, the author applies the analysis process of Cresswell (2003) and the data analysis method of Miles & Huberman (1994) to data collected through in-depth expert interviews. The method and implementation steps are shown in Figure 3.4:
Record and analyze data collected from interviews.
Record ideas generated from the interview content.
Forming factors in the applied research model. These factors will be coded and arranged into columns corresponding to the level of generalization: factors explaining factors, groups of factors.
Synthesize the encrypted data.
Connect the discovered factors to establish the model.
Check the accuracy of qualitative research results using a survey questionnaire on consensus on the factors discovered and evaluated using statistical methods with a large sample size of many subjects in the banking sector.
Step 5
Connecting factors
Step 6
Analyze and explain the meaning of factors in the model
Compare the findings with information from data obtained from the summary results of previous studies and results obtained from the actual research process.
Step 7
Check the reliability of research results
Figure 3.4: Qualitative data analysis process
Source: Author's Development
3.2.3.2. Qualitative data analysis method
In this step, the author uses the Formal Analysis Method to determine the level of factors affecting the effectiveness of the internal control system. According to this method, depending on the information of the data provided and the nature of the factors, the data will be arranged to extract, classify and encode according to each level: Factors (level 1), Factors constituting factors (level 2). In which, each coded level will be detailed according to each lower level.
“In addition to systematically identifying factors, the results of the modal analysis method also help to evaluate the role and relationship of the factors” (King, 2004). The results of the qualitative research will be compared with the results of studies on factors affecting the effectiveness of the internal control system in commercial banks that have been implemented, typically the research results of Angella Amudo and Eno L. Inanga, (2009), Sultana and Haque, (2011) have been selected as the research model used in the thesis presented in chapter 2.
3.3. Data sources and data collection methods in quantitative research
3.3.1. Data sources of quantitative research
The data used in the quantitative research of the thesis are data collected directly, via mail or email from the survey forms that have been cleaned to eliminate incomplete survey responses or those that do not meet the requirements of the study (see Appendix 5: Quantitative research survey form).
3.3.2. Survey subjects and survey samples in quantitative research
3.3.2.1. Survey subjects
Based on the influencing factors discovered in the qualitative research phase, the quantitative survey questionnaire was deployed to the identified survey subjects in 3 forms: (1) Directly, (2) Mail,
(3) Send by email. Focus on 3 areas with many banks operating: Hanoi capital, Da Nang city, Ho Chi Minh city.
- Survey subjects:
(1) Head of and deputy head of professional department, staff performing professional tasks at banks and commercial bank branches
(2) State management agencies on banking: leaders of the Ministry of Finance and the State Bank.
(3) Professional Association (Association leaders, association executive board members)
(4) Banking researchers and lecturers: Board of Directors members, Head and Deputy Head of the Department of Auditing and Banking, lecturers of auditing and banking
- Experience standard: worked in banking or auditing industry for at least 3 years
- Qualification criteria: Survey subjects must have graduated from university or higher in banking or auditing fields in many localities and regions across the country.
3.3.2.2. Survey sample size
Based on the nature of the identified survey subjects, in this study, the determination of the number of survey samples is applied by stratification method, in order to select elements belonging to groups with high homogeneity according to the survey subjects mentioned above. According to experience from observing other studies in banking activities, the expected survey questionnaires will reach 60%, the rate of unqualified survey questionnaires is 10%. Therefore, the number of samples collected from the study will reach about 500 samples. The structure of the survey subjects is shown in Table 3.1: Number of samples and structure of survey subjects:
Table 3.1: Number of samples and structure of survey subjects
STT
Job position | Number of survey votes | ||
Quantity | Rate (%) | ||
1 | State management of banking | 23 | 3.8 |
2 | Professional Association | 3 | 0.5 |
3 | Bank Manager | 100 | 16.6 |
4 | Lecturers, scientists in the field banking, auditing | 24 | 4.0 |
5 | Bank Specialist | 451 | 75 |
Total | 601 | 100 | |
Maybe you are interested!
-
 Foreign Research on Factors Affecting Commercial Bank Business Performance
 -
 Measuring Individual Customer Satisfaction on Service Quality of Joint Stock Commercial Bank for Foreign Trade of Vietnam - Ho Chi Minh Branch Through Survey
 -
 Research Results on Factors Affecting Bank Credit Expansion for Sustainable Development of Long-Term Industrial Crops of Commercial Banks
 -
 Subjects and Methods of Qualitative Research
 -
 Research on factors affecting the decision to choose savings deposit service of individual customers at Vietnam Joint Stock Commercial Bank for Investment and Development - Thua Thien Hue branch - 17

(Source: Author's Development)
3.3.3. Process and method of quantitative data analysis
To measure the impact level of each factor on the effectiveness of internal control systems in Vietnamese commercial banks, the following quantitative data analysis process and methods are used:
Step 1:Design survey questionnaire
Based on the results of the factors identified in the qualitative research step, the survey questionnaire applied in the quantitative research was designed to include the following parts:
- Part 1: Information for statistics and classification of interviewees;
- Part 2: Measuring the impact of factors affecting the effectiveness of internal control systems in Vietnamese commercial banks;
- Part 3: General assessment of the effectiveness of internal control systems in Vietnamese commercial banks. In which, the level of impact is assessed through 5 levels on the Likert scale.
A draft survey questionnaire after design will be tested on 3 to 5 subjects to see if it is suitable for the research objectives and convenient for the research subjects to understand and answer. The official survey will be released after completion.
Step 2:Select a survey sample and determine how the survey will be conducted
There are many different sampling methods, but they can be divided into two main groups: (1) probability sampling or random sampling and (2) non-probability sampling or non-random sampling. In this study, to estimate the regression model, the author used the probability sampling method. On the other hand, because the total number of survey subjects can be estimated, the stratified sampling method is also used in the thesis.
Survey subjects, sampling method and sample size are as presented in section 3.3.2: “Survey subjects in quantitative research”.
Step 3:Submit survey and receive response
Survey forms will be sent and collected in the following ways: (i) In person, (ii) By mail and (iii) by email.
Step 4:Raw data processing
The author collected data and initially processed it using Microsoft Excel software, then processed the raw data such as checking the reasonableness of the data and checking for empty data. The clean data was then analyzed using IBM SPSS Statistics 20 software.
Step 5:Scale quality control
To test the quality of the scale, the author uses the Cronbach's coefficient. The scale is considered to be of good quality when: (1) The overall Cronbach's Alpha coefficient is greater than 0.6; and (2) The item-total correlation coefficient of the observed variables (Corrected Item – Total Correlations) is greater than 0.3 (Nunnally & Bernstein, 1994).
Step 6 : Conduct exploratory factor analysis EFA
EFA analysis will help extract factors for further analysis. The "factor loading coefficient" indicator is used to measure the significance level of the EFA coefficient. According to the study of Hair et al. (1998), "This coefficient is greater than 0.3 is considered the minimum level, greater than 0.4 is considered an important level, greater than 0.5 is considered to have practical significance". In this study,
In order to improve the practicality and reliability of the research results, the thesis only selected factors with loading coefficients greater than 0.5. The Kaiser-Mayer-Olkin (KMO) coefficient ensures a value of 0.5<= KMO<=1 and the total variance extracted is greater than 0.5 when performing EFA analysis. The thesis also uses the Principal Component Analysis method and Varimax rotation to extract the main factors.
Step 7:Based on the results of EFA analysis, the proposed research model, the factors are extracted into main factor groups and coded according to independent or dependent variables. To estimate the correlation level of the factors to the effectiveness of the internal control system, the author uses the multiple regression analysis model to calculate the parameters of the factors used in the model.
Step 8:Regression model testing
To ensure the reliability and efficiency of the model, the following five main tests are performed:
(1) Partial correlation test of regression coefficients
The purpose of this test is to examine whether the independent variable is significantly correlated with the dependent variable (considering each independent variable separately). The authors Nguyen Dinh Tho, (2013) and Dinh Phi Ho, (2014) stated: "When the significance level (Significance, Sig.) of the partial regression coefficient has a confidence level of 95% or higher (Sig. ≤0.05), it can be concluded that the correlation between the independent variable and the dependent variable is statistically significant".
(2) Model fit testing
The purpose of this test is to examine whether the independent variable and the dependent variable still have a linear relationship with each other. The authors Nguyen Dinh Tho, (2013) and Dinh Phi Ho, (2014) stated: “The model is considered inappropriate when all regression coefficients are zero, and the model is considered appropriate when there is at least one regression coefficient other than zero. Analysis of Variance (ANOVA) is used to test the suitability of the model. If the significance level ensures at least 95% confidence (Sig. < 0.05), the model is considered appropriate”.
(3) Testing for multicollinearity
Multicollinearity is a phenomenon in which independent variables have an almost linear relationship. Ignoring multicollinearity makes standard errors often higher, statistical values lower and may not be meaningful. To check this phenomenon, we use the Variance Inflation Factor (VIF) measure to test the correlation between independent variables. The condition is that VIF < 10 to avoid multicollinearity. Nguyen Dinh Tho (2013), (Dinh Phi Ho, 2014)
(4) Testing for autocorrelation phenomenon
In this study, the Durbin-Watson statistic is used to check whether there is autocorrelation in the residuals of the proposed regression model. The model is concluded to have no autocorrelation when the condition dU < d < 4 – dL is satisfied. In which, dU is the upper statistic and dL is the lower statistic. Nguyen Dinh Tho (2013), (Dinh Phi Ho, 2014)
(5) Check the phenomenon of variance of residuals changing
Heteroskedasticity is the phenomenon in which the residual values have different distributions and the variance values are not the same. This phenomenon does not occur when the condition is satisfied: nR2 < Chi square value. When nR2 < Chi square value, the conclusion is: The variance of the residuals is constant. Nguyen Dinh Tho (2013), (Dinh Phi Ho, 2014)
The process and method of quantitative data analysis are shown in Figure 3.5:
Design survey questionnaire
Determine survey subjects, sampling method, sample size

Submit survey and receive response
Raw data processing
Scale quality control
Exploratory Factor Analysis (EFA)

Proposed research model and regression analysis method
Regression model testing


Step 1
Step 2
Step 3
Step 4
Step 5
Step 6
Step 7
Step 8
Figure 3.5: Process and method of quantitative data analysis
(Source: Author's Development)
3.4. General regression equation
In science, analysis can be divided into 3 groups: (i) Analysis of difference; (ii) Association analysis; (iii) Correlation analysis and Prediction. In which, correlation analysis is used to assess the correlation between two continuous variables. The tool used to measure the correlation between variables is the Correlation Coefficient. In addition, to determine the level of influence of predictor variables (X) on the dependent variable
(Y) needs a model to predict. This model is called a Linear Regression Model. Determining the linear regression model
This calculation aims at 3 goals: (i) Finding a model (equation) to describe the correlation between the predictor variable (X) and the dependent variable (Y); (ii) Adjusting for confounding factors; (iii) Predicting the value of the dependent variable (Y) based on the predictor variable (X).
As the research objectives were identified in the introduction, in addition to identifying factors affecting the effectiveness of internal control systems, the purpose of this study is also to measure the level of influence of factors on the effectiveness of internal control systems in Vietnamese commercial banks. To meet this objective, in the study, the author uses correlation analysis and linear regression models to describe and measure the level of influence of factors on the effectiveness of internal control systems.
The general correlation analysis model used in the thesis has the form:
Y = f (X 1 , X 2 , X 3 , …, X i )
The linear regression equation showing the impact of factors on the dependent variable has the form: Y = β 0 + β 1 X 1 + β 2 X 2 + β 3 X 3 + … + β i X i
In which: Y is the dependent variable,
β 1 , β 2 , β 3 , …, β i are the regression coefficients X 1 , X 2 , X 3 , …, X i are the independent variables
CONCLUSION OF CHAPTER 3
The author used both qualitative and quantitative research methods to identify and test factors affecting the effectiveness of internal control systems in Vietnamese commercial banks. To conduct qualitative research, the author used methods of analysis, synthesis, comparison, thinking, system approach, descriptive statistics to describe, generalize theories related to the content of the thesis and analyze, comment to decide on the selection of factors affecting the effectiveness of internal control systems in Vietnamese commercial banks. Quantitative research methods were used to test factors affecting the effectiveness of internal control systems in Vietnamese commercial banks. To process data and analyze, the author used SPSS software and EFA, MRA analysis tools to test the influencing factors and results of the model.