- When asked by friends or acquaintances, you may agree to open a company in their name but do not actually contribute capital or operate the company. - Investors trade securities according to insiders - Investors trade according to the crowd and market trends. | |
- "Credit" services exceeding the regulations of the companies | |
Securities company. | |
- The agency's fraud detection monitoring system | |
Opportunity factors due to market management | function is not timely, usually after the behavior |
stock market yet | The fraud was completed over several months to several years. |
effective | - The penalties are too light and ineffective. |
deterrent | |
- The legal system still has many shortcomings and many opponents. | |
The subject has not been properly treated for the type of fraudulent behavior. |
Maybe you are interested!
-

 Provisions of the 2004 Vietnam Civil Procedure Code on civil case mediation and implementation practices at the People's Court of Hoai Duc district, Hanoi city - 2
 -
 Summary Table of Characteristics of Similar Studies Around the World
 -
 Studies on Leakage Water Treatment by Ozone in Vietnam
 -
 Corporate culture of Vietnam Industrial and Commercial Bank, case study of Hai Ba Trung Industrial and Commercial Bank branch - 11
 -
 Increasing capital mobilization from individual customers of commercial banks - Case study of Vietnam Joint Stock Commercial Bank for Investment and Development, Phu Tho Branch - 1
Source: Author's synthesis
Table 3.2: Summary of fraud methods from case studies
TT
How to commit fraud | |
1 | Using one or more accounts to continuously buy and sell, creating artificial supply and demand for securities. |
2 | Continuously trade with dominant volume at the time of price determination closing or new opening price of that security. |
3 | Expressing an opinion through the media about a security with the aim of influencing the price of the security |
4 | Creating or publishing false or misleading information that significantly affects the price of securities on the market |
5 | Using unpublished inside information to trade securities |
Source: Author's synthesis
3.2.2 Factor analysis to explore opportunity factors affecting fraudulent behavior in the Vietnamese stock market
3.2.2.1 Survey sample description
The general information section of the survey shows information about gender, education level and interviewees.
Of the 568 survey samples, 332 were male (58.45%), and 41.55% were female, meaning the male proportion was higher (Figure 3.5).
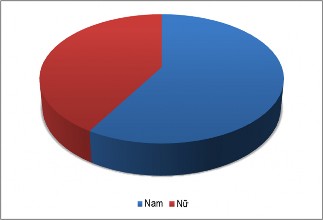
Figure 3.5: Gender chart of survey subjects
Source: Author's synthesis
The respondents had a high level of education, with 93.48% of respondents having a university or postgraduate degree. Only 6.5% of respondents had a college or high school degree (Figure 3.6).
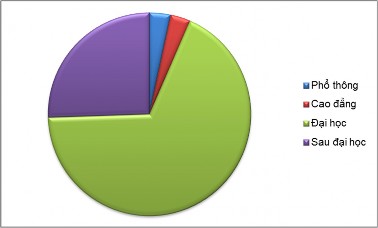
Figure 3.6: Chart of educational level of surveyed subjects
Source: Author's synthesis
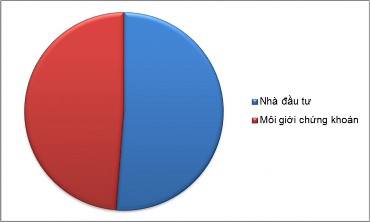
Figure 3.7: Group chart of surveyed subjects
Source: Author's synthesis
Of the 568 analyzed questionnaires, 291 were from investors with over 5 years of experience in securities investment (accounting for 51.23%), while the number of questionnaires from people working in the securities sector (securities companies, State Securities Commission, Stock Exchange...) accounted for 48.77% (Figure 3.7). This shows that the research sample is relatively uniform among the surveyed subjects.
3.2.2.2 Assessing the reliability of the scale
The results of Cronbach's Alpha test analysis show that the reliability of the scale used in the analysis is when the Cronbach's Alpha coefficient of all variables is > 0.7. However, the ISD4 indicator has a Cronbach's Alpha coefficient if item delete of 0.809, which is larger than the Cronbach's Alpha coefficient of the ISD variable of 0.802. The MNG1 indicator has a Cronbach's Alpha coefficient if item delete of 0.858, which is larger than the Cronbach's Alpha coefficient of the MNG variable of 0.832, so to increase the suitability of the scale, the two indicators ISD4 and MNG1 are removed (Appendix 11, 12).
Table 3.3: Assessment of scale reliability through Cronbach's Alpha coefficient
STT
Variable | Symbol | Cronbach's Alpha coefficient | |
1 | Ways to commit fraud | FRD | 0.754 |
2 | Opportunity variables due to insiders and TCPH | ISD | 0.809 |
3 | Turn opportunities by investors | IVT | 0.758 |
4 | Turn opportunities into market management and supervision | MNG | 0.858 |
Source: Synthesized from analysis results
3.2.2.3 EFA analysis for independent variables
After testing the appropriateness of the scale, exploratory factor analysis (EFA) will be performed. The analysis process is performed twice. In the first analysis, the indicators IVT1, IVT2 have factor loading coefficients < 0.5, and at the same time, the indicators ISD5, MNG2, MNG3 do not ensure convergence value to the same factor, so the above 5 indicators are eliminated. The results of the second analysis show that the remaining data are eligible for analysis because they have factor loading coefficients > 0.5 and satisfy two conditions: "Convergent value" (observed variables converge to the same factor) and "Discriminant value" (observed variables belonging to this factor are distinct from other factors). (Appendix 13, 14).
Table 3.4: EFA factor analysis results
EFA Analysis
KMO coefficient | P-value | Extracted variance | Factor loading | Conclude | |
First time | 0.877 | 0.000 | 61,116 | All >0.5 | Remove 5 indicators |
2nd time | 0.817 | 0.000 | 60,595 | All >0.5 | Qualified for analysis |
Source: Synthesized from analysis results
3.2.2.4 EFA analysis for dependent variables
The exploratory factor analysis (EFA) of the dependent variable showed that the KMO coefficient was 0.756 (> 0.5). The Sig. value was 0.000 (<0.05), the variance extracted was 50.503 (>50%), and the indicators were combined into a single variable, ensuring the requirement of “convergent validity”.
Table 3.5: KMO test and Bartlett test of dependent variable
KMO coefficient
0.756 | ||
Bartlett's Test of Sphericity | Chi squared | 616,244 |
df | 10 | |
Sig. | 0.000 |
Source: Synthesized from analysis results
Table 3.6: Extracted variance values of dependent variable
Factor
Initial Eigenvalues | The sum of squares of the extracted factor loadings | |||||
Total | % of variance | Cumulative Percentage (%) | Total | % of variance | Accumulated Percentage(%) | |
1 | 2,525 | 50,503 | 50,503 | 2,525 | 50,503 | 50,503 |
2 | 0.844 | 16,883 | 67,386 | |||
3 | 0.671 | 13,413 | 80,799 | |||
4 | 0.514 | 10,273 | 91,072 | |||
5 | 0.446 | 8,928 | 100,000 | |||
Extraction method: Principal factor analysis PCA
Source: Synthesized from analysis results
Table 3.7: Rotation matrix in EFA analysis for dependent variable
Factor matrix
Factor | |
1 | |
FRD3 | 0.759 |
FRD5 | 0.713 |
FRD1 | 0.709 |
FRD4 | 0.693 |
FRD2 | 0.676 |
Extraction method: Principal factor analysis PCA
Source: Synthesized from analysis results
3.2.2.5 Assessment of the reliability of the new scale
After analyzing the EFA factor, removing inappropriate indicators and grouping them into new variables, the author re-evaluated the reliability of the scale. The results of the Cronbach's Alpha test analysis of the new variables showed that the reliability of the scale used in the analysis was when the Cronbach's Alpha coefficient of all variables was > 0.7. In which, the MNG6 indicator (The authority of the State Securities Commission in inspection, examination, and sanctioning still has many limitations) had a Cronbach's Alpha coefficient if Item Deleted of 0.858> the Cronbach's Alpha coefficient of the MNG variable (0.806) (Appendix 15). However,
However, the results of in-depth interviews and analysis of typical situations show that this is an important indicator in the opportunity transformation from market management and supervision leading to fraudulent behavior. In fact, the authority of the Securities Commission in inspection, examination and sanctioning is adjusted and supplemented in the new Securities Law No. 54/2019/QH14 issued by the National Assembly on November 26, 2019. Therefore, the MNG6 indicator is retained in the research model.
Table 3.8: Reliability assessment of the new scale
STT
Variable | Symbol | Cronbach's Alpha coefficient | |
1 | Turn opportunities into insider and the issuing organization | ISD | 0.781 |
2 | Turn opportunities by investors | IVT | 0.756 |
3 | Turn opportunities into management, market surveillance | MNG | 0.806 |
Source: Synthesized from analysis results
3.2.2.6 PEARSON correlation analysis between variables
Table 3.9: Correlation coefficients between variables in the model
List of variables
FRD | ISD | IVT | MNG | ||
FRD | Pearson correlation coefficient | 1 | 0.543 ** | 0.289 ** | 0.443 ** |
Significance level Sig. (2-tailed test) | 0.000 | 0.000 | 0.000 | ||
Sample size N | 568 | 568 | 568 | 568 | |
ISD | Pearson correlation coefficient | 0.543 ** | 1 | 0.324 ** | 0.493 ** |
Significance level Sig. (2-tailed test) | 0.000 | 0.000 | 0.000 | ||
Sample size N | 568 | 568 | 568 | 568 | |
IVT | Pearson correlation coefficient | 0.289 ** | 0.324 ** | 1 | 0.361 ** |
Significance level Sig. (2-tailed test) | 0.000 | 0.000 | 0.000 | ||
Sample size N | 568 | 568 | 568 | 568 | |
MNG | Pearson correlation coefficient | 0.443 ** | 0.493 ** | 0.361 ** | 1 |
Significance level Sig. (2-tailed test) | 0.000 | 0.000 | 0.000 | ||
Sample size N | 568 | 568 | 568 | 568 |
**. Correlation coefficient is statistically significant at 1% significance level (2-tailed test)
Source: Synthesized from analysis results
The results of the correlation analysis show that because all variables have Sig. (2-tailed) coefficients < 0.05, all variables have independent impacts on fraudulent behavior in the stock market, and there is a fairly close correlation between the variables. Therefore, to ensure accuracy, it is necessary to carefully review the role of independent variables in the multivariate regression model by examining the impact of each independent variable on the dependent variable and checking the multicollinearity of the model.
3.2.2.7 Regression model analysis
Table 3.10: Results of regression analysis of independent variables
STT
Independent variable | B | Regression coefficient Beta normalization | Sig. | Magnification factor VIF King | |
(Constant) | 1,470 | 0.000 | |||
1 | ISD | 0.377 | 0.413 | 0.000 | 1,366 |
2 | IVT | 0.072 | 0.079 | 0.035 | 1,188 |
3 | MNG | 0.164 | 0.211 | 0.000 | 1,406 |
Source: Synthesized from analysis results
The results of regression analysis show that the Sig. values are all < 0.05 and the standardized regression coefficient Beta is positive, indicating that all independent variables included in the model have a positive impact on the dependent variable (Appendix 16).
The order of impact is ISD with standardized regression coefficient Beta is 0.413, MNG is 0.211, IVT is 0.079. The resulting regression equation:
FRD = 1.470 + 0.377*ISD + 0.072*IVT + 0.164*MNG
Thus, opportunity factors from insiders and issuers, opportunity factors from investors, and opportunity factors from supervisory management agencies all have an impact on fraudulent behavior. Hypotheses H1, H2, and H3 are accepted.
The results of regression analysis show that there is no multicollinearity phenomenon because the VIF error inflation factor is less than 2. This proves the accuracy of the model testing results and collected data.
Table 3.11: Autocorrelation test
Model
R | R 2 | R2 corrected | Standard error SE of the estimate | Durbin – Watson test | |
1 | 0.584a | 0.341 | 0.337 | 0.57762 | 2,124 |
a. Explanatory variables: (Intercept coefficient), MNG, IVT, ISD
b. Dependent variable: FRD
The adjusted R2 value is 0.337 (Table 3.11), which means that the independent variables included in the model explain 33.7% of the change in the dependent variable (FRD). This value is a bit low because the model only includes 1 dependent variable and 3 independent variables. In addition, the dependent variable is also affected by other variables that have not been included in the model. As presented in chapter 2, the fraud triangle theory indicates that there are 3 factors leading to fraudulent behavior including pressure, opportunity and justification. However, due to research limitations, pressure and justification factors are difficult to measure clearly, so the author did not include them in the research model in this thesis.
At the same time, the Durbin - Watson coefficient is 2.124 (Table 3.11) for the regression model of factors affecting fraudulent behavior in the stock market (in the range from 1 to 3), proving that the model has no autocorrelation. In addition, the sig. value of the rank correlation between the standardized residuals (ABSRES) and the independent variables are all > 0.05, so the residual variance is homogeneous, there is no phenomenon of error variance change. These results demonstrate the suitability of the model and the research data.
Model | Sum of squares | Degrees of freedom | Mean square | F-statistics | Sig. test significance level | |
1 | Regression | 97,260 | 3 | 32,420 | 97,170 | 0.000 b |
Remainder | 188,173 | 564 | 0.334 | |||
Total | 285,433 | 567 | ||||
Table 3.12: Results of F ANOVA test a
a. Dependent variable: FRD
b. Explanatory variables: (Intercept coefficient), MNG, IVT, ISD
Other tests show that the regression hypothesis is not violated. The Sig. value of the F test in ANOVA is 0.000 < 0.05, so it can be concluded that the built regression model is suitable for the population, proving that the regression model can be generalized and applied to the population.
3.2.2.8 Analysis of research results
The above research results show that the opportunity factors affecting fraudulent behavior in the Vietnamese stock market include: opportunity factors caused by insiders and issuing organizations; opportunity factors caused by investors; factors caused by market management and supervision.