The combined route has helped students have conditions to reflect and prepare better for choosing and implementing project topics, and interact more. Teachers have provided timely and effective assistance to each group, and better monitored and evaluated the students' project implementation process.
Opinion of teacher Nguyen Thi Thuy Lan (Go Cong High School, Tien Giang): “ DHDA has enhanced students’ self-study activities, promoting their independence and creativity. Students were very excited to create project products and discuss their products. The online environment has helped students interact, promptly and quickly resolve problems and difficulties encountered. Students have also made better use of information technology tools to access the internet to look up, collect information and present project products”.
Thus, most teachers have positive feedback on the effectiveness of the two measures of applying the BL model to the development of students' self-learning ability. Through their opinions, it can be seen that in the control classes, teachers do not apply teaching according to the BL model, students' self-learning ability is still limited, many students learn passively, do not know how to learn, do not care about goals, planning and self-assessment, and draw experience after each learning stage. In the experimental class, each teaching process requires students to learn, to determine goals, plan and implement the learning plan, evaluate and adjust after the learning process. Therefore, after a period of application, students have gradually become familiar with the new way of learning, effectively develop their self-learning ability and have certain IT skills. The online environment has helped teaching activities to be carried out more easily and flexibly. Teachers have provided timely and effective support, better supervision and evaluation of students' activities during the project implementation process, and the interaction between students in groups/classes has also been significantly enhanced.
In addition, through observing the attitudes, learning interests,... of students in the experimental and control classes during some teaching hours, we also noticed that in the experimental classes, students were very enthusiastic, enthusiastic, actively participating in learning activities and working in groups very effectively. Through interviews with some students, they all said that they were more proactive in learning, knew how to learn, knew how to use tools to access and search for information on the internet, solved problems in learning and practice, most of them supported and wanted teachers to regularly organize online combined teaching activities like that. This proves that organizing teaching according to the BL model has had positive impacts on students' attitudes and interests in learning.
Here are some pictures during the TNSP process at high school:


test
Figure 3.1. Students of Vo Van Kiet High School, Ho Chi Minh City, conduct the experiment.Figure 3.2. Students of Van Coc High School, Hanoi participate in a learning game. |
Maybe you are interested!
-
![Mobile Phone Usage in Hanoi Inner City Area
zt2i3t4l5ee
zt2a3gsconsumer,consumption,consumer behavior,marketing,mobile marketing
zt2a3ge
zc2o3n4t5e6n7ts
- Test the relationship between demographic variables and consumer behavior for Mobile Marketing activities
The analysis method used is the Chi-square test (χ2), with statistical hypotheses H0 and H1 and significance level α = 0.05. In case the P index (p-value) or Sig. index in SPSS has a value less than or equal to the significance level α, the hypothesis H0 is rejected and vice versa. With this testing procedure, the study can evaluate the difference in behavioral trends between demographic groups.
CHAPTER 4
RESEARCH RESULTS
During two months, 1,100 survey questionnaires were distributed to mobile phone users in the inner city of Hanoi using various methods such as direct interviews, sending via email or using questionnaires designed on the Internet. At the end of the survey, after checking and eliminating erroneous questionnaires, the study collected 858 complete questionnaires, equivalent to a rate of about 78%. In addition, the research subjects of the thesis are only people who are using mobile phones, so people who do not use mobile phones are not within the scope of the thesis, therefore, the questionnaires with the option of not using mobile phones were excluded from the scope of analysis. The number of suitable survey questionnaires included in the statistical analysis was 835.
4.1 Demographic characteristics of the sample
The structure of the survey sample is divided and statistically analyzed according to criteria such as gender, age, occupation, education level and personal income. (Detailed statistical table in Appendix 6)
- Gender structure: Of the 835 completed questionnaires, 49.8% of respondents were male, equivalent to 416 people, and 50.2% were female, equivalent to 419 people. The survey results of the study are completely consistent with the gender ratio in the population structure of Vietnam in general and Hanoi in particular (Male/Female: 49/51).
- Age structure: 36.6% of respondents are <23 years old, equivalent to 306 people. People from 23-34 years old
accounting for the highest proportion: 44.8% equivalent to 374 people, people aged 35-45 and >45 are 70 and 85 people equivalent to 8.4% and 10.2% respectively. Looking at the results of this survey, we can see that the young people - youth account for a large proportion of the total number of people participating in the survey. Meanwhile, the middle-aged people including two age groups of 35 - 45 and >45 have a low rate of participation in the survey. This is completely consistent with the reality when Mobile Marketing is identified as a Marketing service aimed at young people (people under 35 years old).
- Structure by educational level: among 835 valid responses, 541 respondents had university degrees, accounting for the highest proportion of ~ 75%, 102 had secondary school degrees, ~ 13.1%, and 93 had post-graduate degrees, ~ 11.9%.
- Occupational structure: office workers and civil servants are the group with the highest rate of participation with 39.4%, followed by students with 36.6%. Self-employed people account for 12%, retired housewives are 7.8% and other occupational groups account for 4.2%. The survey results show that the student group has the same rate as the group aged <23 at 36.6%. This shows the accuracy of the survey data. In addition, the survey results distributed by occupational criteria have a rate almost similar to the sample division rate in chapter 3. Therefore, it can be concluded that the survey data is suitable for use in analysis activities.
- Income structure: the group with income from 3 to 5 million has the highest rate with 39% of the total number of respondents. This is consistent with the income structure of Hanoi people and corresponds to the average income of the group of civil servants and office workers. Those
People with no income account for 23%, income under 3 million VND accounts for 13% and income over 5 million VND accounts for 25%.
4.2 Mobile phone usage in Hanoi inner city area
According to the survey results, most respondents said they had used the phone for more than 1 year, specifically: 68.4% used mobile phones from 4 to 10 years, 23.2% used from 1 to 3 years, 7.8% used for more than 10 years. Those who used mobile phones for less than 1 year accounted for only a very small proportion of ~ 0.6%. (Table 4.1)
Table 4.1: Time spent using mobile phones
Frequency
Ratio (%)
Valid Percentage
Cumulative Percentage
Alid
<1 year
5
.6
.6
.6
1-3 years
194
23.2
23.2
23.8
4-10 years
571
68.4
68.4
92.2
>10 years
65
7.8
7.8
100.0
Total
835
100.0
100.0
The survey indexes on the time of using mobile phones of consumers in the inner city of Hanoi are very impressive for a developing country like Vietnam and also prove that Vietnamese consumers have a lot of experience using this high-tech device. Moreover, with the majority of consumers surveyed having a relatively long time of use (4-10 years), it partly proves that mobile phones have become an important and essential item in peoples daily lives.
When asked about the mobile phone network they are using, 31% of respondents said they are using the network of Vietel company, 29% use the network of
of Mobifone company, 27% use Vinaphone companys network and 13% use networks of other providers such as E-VN telecom, S-fone, Beeline, Vietnammobile. (Figure 4.1).
Figure 4.1: Mobile phone network in use
Compared with the announced market share of mobile telecommunications service providers in Vietnam (Vietel: 36%, Mobifone: 29%, Vinaphone: 28%, the remaining networks: 7%), we see that the survey results do not have many differences. However, the statistics show that there is a difference in the market share of other networks because the Hanoi market is one of the two main markets of small networks, so their market share in this area will certainly be higher than that of the whole country.
According to a report by NielsenMobile (2009) [8], the number of prepaid mobile phone subscribers in Hanoi accounts for 95% of the total number of subscribers, however, the results of this survey show that the percentage of prepaid subscribers has decreased by more than 20%, only at 70.8%. On the contrary, the number of postpaid subscribers tends to increase from 5% in 2009 to 19.2%. Those who are simultaneously using both types of subscriptions account for 10%. (Table 4.2).
Table 4.2: Types of mobile phone subscribers
Frequency
Ratio (%)
Valid Percentage
Cumulative Percentage
Valid
Prepay
591
70.8
70.8
70.8
Pay later
160
19.2
19.2
89.9
Both of the above
84
10.1
10.1
100.0
Total
835
100.0
100.0
The above figures show the change in the psychology and consumption habits of Vietnamese consumers towards mobile telecommunications services, when the use of prepaid subscriptions and junk SIMs is replaced by the use of two types of subscriptions for different purposes and needs or switching to postpaid subscriptions to enjoy better customer care services.
In addition, the majority of respondents have an average spending level for mobile phone services from 100 to 300 thousand VND (406 ~ 48.6% of total respondents). The high spending level (> 500 thousand VND) is the spending level with the lowest number of people with only 8.4%, on the contrary, the low spending level (under 100 thousand VND) accounts for the second highest proportion among the groups of respondents with 25.4%. People with low spending levels mainly fall into the group of students and retirees/housewives - those who have little need to use or mainly use promotional SIM cards. (Table 4.3).
Table 4.3: Spending on mobile phone charges
Frequency
Ratio (%)
Valid Percentage
Cumulative Percentage
Valid
<100,000
212
25.4
25.4
25.4
100-300,000
406
48.6
48.6
74.0
300,000-500,000
147
17.6
17.6
91.6
>500,000
70
8.4
8.4
100.0
Total
835
100.0
100.0
The statistics in Table 4.3 are similar to the percentages in the NielsenMobile survey results (2009) with 73% of mobile phone users having medium spending levels and only 13% having high spending levels.
The survey results also showed that up to 31% ~ nearly one-third of respondents said they sent more than 10 SMS messages/day, meaning that on average they sent 1 SMS message for every working hour. Those with an average SMS message volume (from 3 to 10 messages/day) accounted for 51.1% and those with a low SMS message volume (less than 3 messages/day) accounted for 17%. (Table 4.4)
Table 4.4: Number of SMS messages sent per day
Frequency
Ratio (%)
Valid Percentage
Cumulative Percentage
Valid
<3 news
142
17.0
17.0
17.0
3-10 news
427
51.1
51.1
68.1
>10 news
266
31.9
31.9
100.0
Total
835
100.0
100.0
Similar to sending messages, those with an average message receiving rate (from 3-10 messages/day) accounted for the highest percentage of ~ 55%, followed by those with a high number of messages (over 10 messages/day) ~ 24% and those with a low number of messages received daily (under 3 messages/day) remained at the bottom with 21%. (Table 4.5)
Table 4.5: Number of SMS messages received per day
Frequency
Ratio (%)
Valid Percentage
Cumulative Percentage
Valid
<3 news
175
21.0
21.0
21.0
3-10 news
436
55.0
55.0
76.0
>10 news
197
24.0
24.0
100.0
Total
835
100.0
100.0
When comparing the data of the two result tables 4.4 and 4.5, we can see the reasonableness between the ratio of the number of messages sent and the number of messages received daily by the interview participants.
4.3 Current status of SMS advertising and Mobile Marketing
According to the interview results, in the 3 months from the time of the survey and before, 94% of respondents, equivalent to 785 people, said they received advertising messages, while only a very small percentage of 6% (only 50 people) did not receive advertising messages (Table 4.6).
Table 4.6: Percentage of people receiving advertising messages in the last 3 months
Frequency
Ratio (%)
Valid Percentage
Cumulative Percentage
Valid
Have
785
94.0
94.0
94.0
Are not
50
6.0
6.0
100.0
Total
835
100.0
100.0
The results of Table 4.6 show that consumers in the inner city of Hanoi are very familiar with advertising messages. This result is also the basis for assessing the knowledge, experience and understanding of the respondents in the interview. This is also one of the important factors determining the accuracy of the survey results.
In addition, most respondents said they had received promotional messages, but only 24% of them had ever taken the action of registering to receive promotional messages, while 76% of the remaining respondents did not register to receive promotional messages but still received promotional messages every day. This is the first sign indicating the weaknesses and shortcomings of lax management of this activity in Vietnam. (Table 4.7)
div.maincontent .s1 { color: black; font-family:Times New Roman, serif; font-style: italic; font-weight: normal; text-decoration: none; font-size: 14pt; } div.maincontent .s2 { color: black; font-family:Times New Roman, serif; font-style: normal; font-weight: bold; text-decoration: none; font-size: 14pt; } div.maincontent .s3 { color: black; font-family:Times New Roman, serif; font-style: normal; font-weight: bold; text-decoration: none; font-size: 14pt; } div.maincontent .p { color: black; font-family:Times New Roman, serif; font-style: normal; font-weight: normal; text-decoration: none; font-size: 14pt; margin:0pt; } div.maincontent p { color: black; font-family:Times New Roman, serif; font-style: normal; font-weight: normal; text-decoration: none; font-size: 14pt; margin:0pt; } div.maincontent .s4 { color: black; font-family:Times New Roman, serif; font-style: normal; font-weight: normal; text-decoration: none; font-size: 9.5pt; vertical-align: 6pt; } div.maincontent .s5 { color: black; font-family:Times New Roman, serif; font-style: normal; font-weight: bold; text-decoration: none; font-size: 14pt; } div.maincontent .s6 { color: black; font-family:Times New Roman, serif; font-style: normal; font-weight: bold; text-decoration: none; font-size: 14pt; } div.maincontent .s7 { color: black; font-family:Times New Roman, serif; font-style: italic; font-weight: normal; text-decoration: none; font-size: 14pt; } div.maincontent .s8 { color: black; font-family:Times New Roman, serif; font-style: italic; font-weight: bold; text-decoration: none; font-size: 14pt; } div.maincontent .s9 { color: black; font-family:Arial, sans-serif; font-style: normal; font-weight: normal; text-decoration: none; font-size: 14pt; } div.maincontent .s10 { color: black; font-family:Arial, sans-serif; font-style: normal; font-weight: normal; text-decoration: none; font-size: 12pt; } div.maincontent .s11 { color: black; font-family:Times New Roman, serif; font-style: normal; font-weight: normal; font-size: 14pt; } div.maincontent .s12 { color: black; font-family:Arial, sans-serif; font-style: normal; font-weight: normal; text-decoration: none; font-size: 14pt; } div.maincontent .s13 { color: black; font-family:Times New Roman, serif; font-style: normal; font-weight: normal; text-decoration: none; font-size: 14pt; } div.maincontent .s14 { color: black; font-family:Times New Roman, serif; font-style: normal; font-weight: bold; text-decoration: none; font-size: 13pt; } div.maincontent .s15 { color: black; font-family:Times New Roman, serif; font-style: italic; font-weight: normal; text-decoration: none; font-size: 9.5pt; vertical-align: 6pt; } div.maincontent .s16 { color: black; font-family:Times New Roman, serif; font-style: normal; font-weight: normal; text-decoration: none; font-size: 5.5pt; vertical-align: 3pt; } div.maincontent .s17 { color: black; font-family:Times New Roman, serif; font-style: normal; font-weight: normal; text-decoration: none; font-size: 8.5pt; } div.maincontent .s18 { color: black; font-family:Times New Roman, serif; font-style: italic; font-weight: bold; font-size: 14pt; } div.maincontent .s19 { color: black; font-family:Times New Roman, serif; font-style: normal; font-weight: bold; font-size: 14pt; } div.maincontent .s20 { color: black; font-family:Times New Roman, serif; font-style: italic; font-weight: normal; text-decoration: none; font-size: 13pt; } div.maincontent .s21 { color: black; font-family:Times New Roman, serif; font-style: normal; font-weight: normal; text-decoration: none; font-size: 14pt; } div.maincontent .s22 { color: black; font-family:Courier New, monospace; font-style: normal; font-weight: normal; text-decoration: none; font-size: 14pt; } div.maincontent .s23 { color: black; font-family:Times New Roman, serif; font-style: normal; font-weight: normal; text-decoration: none; font-size: 13pt; } div.maincontent .s24 { color: black; font-family:Times New Roman, serif; font-style: italic; font-weight: normal; text-decoration: none; font-size: 13pt; } div.maincontent .s25 { color: black; font-family:Times New Roman, serif; font-style: normal; font-weight: bold; text-decoration: none; font-size: 14pt; } div.maincontent .s26 { color: black; font-family:Times New Roman, serif; font-style: normal; font-weight: normal; text-decoration: none; font-size: 14pt; } div.maincontent .s27 { color: black; font-family:Times New Roman, serif; font-style: normal; font-weight: normal; text-decoration: none; font-size: 1.5pt; } div.maincontent .s28 { color: black; font-family:Times New Roman, serif; font-style: normal; font-weight: normal; text-decoration: none; font-size: 11pt; } div.maincontent .s29 { color: black; font-family:Times New Roman, serif; font-style: normal; font-weight: bold; text-decoration: none; font-size: 13pt; } div.maincontent .s30 { color: black; font-family:Times New Roman, serif; font-style: italic; font-weight: bold; text-decoration: none; font-size: 13pt; } div.maincontent .s31 { color: black; font-family:Times New Roman, serif; font-style: normal; font-weight: normal; text-decoration: none; font-size: 13pt; } div.maincontent .s32 { color: black; font-family:Arial, sans-serif; font-style: normal; font-weight: normal; text-decoration: none; font-size: 10.5pt; } div.maincontent .s33 { color: black; font-family:Arial, sans-serif; font-style: normal; font-weight: normal; text-decoration: none; font-size: 11pt; } div.maincontent .s35 { color: black; font-family:Arial, sans-serif; font-style: normal; font-weight: bold; text-decoration: none; font-size: 10.5pt; } div.maincontent .s36 { color: #F00; font-family:Arial, sans-serif; font-style: italic; font-weight: bold; text-decoration: none; font-size: 10.5pt; } div.maincontent .s37 { color: black; font-family:Arial, sans-serif; font-style: normal; font-weight: bold; text-decoration: none; font-size: 10.5pt; } div.maincontent .s38 { color: black; font-family:Times New Roman, serif; font-style: normal; font-weight: bold; text-decoration: none; font-size: 8.5pt; vertical-align: 5pt; } div.maincontent .s39 { color: black; font-family:Arial, sans-serif; font-style: normal; font-weight: normal; text-decoration: none; font-size: 10.5pt; } div.maincontent .s40 { color: black; font-family:Arial, sans-serif; font-style: normal; font-weight: normal; text-decoration: none; font-size: 7pt; vertical-align: 4pt; } div.maincontent .s41 { color: black; font-family:Arial, sans-serif; font-style: normal; font-weight: bold; text-decoration: none; font-size: 10.5pt; } div.maincontent .s42 { color: black; font-family:Arial, sans-serif; font-style: normal; font-weight: bold; text-decoration: none; font-size: 11pt; } div.maincontent .s43 { color: black; font-family:Arial, sans-serif; font-style: normal; font-weight: bold; text-decoration: none; font-size: 7.5pt; vertical-align: 5pt; } div.maincontent .s44 { color: black; font-family:Arial, sans-serif; font-style: normal; font-weight: normal; text-decoration: none; font-size: 7pt; vertical-align: 5pt; } div.maincontent .s45 { color: #F00; font-family:Arial, sans-serif; font-style: normal; font-weight: bold; text-decoration: none; font-size: 10.5pt; } div.maincontent .s46 { color: black; font-family:Arial, sans-serif; font-style: normal; font-weight: bold; text-decoration: none; font-size: 7pt; vertical-align: 5pt; } div.maincontent .s47 { color: black; font-family:Arial, sans-serif; font-style: normal; font-weight: bold; text-decoration: none; font-size: 11pt; } div.maincontent .s48 { color: black; font-family:Times New Roman, serif; font-style: normal; font-weight: normal; text-decoration: none; font-size: 14pt; } div.maincontent .s49 { color: black; font-family:Times New Roman, serif; font-style: italic; font-weight: normal; text-decoration: none; font-size: 9.5pt; vertical-align: -2pt; } div.maincontent .s50 { color: black; font-family:Times New Roman, serif; font-style: normal; font-weight: normal; text-decoration: none; font-size: 9.5pt; } div.maincontent .s51 { color: black; font-family:Times New Roman, serif; font-style: italic; font-weight: normal; text-decoration: none; font-size: 9.5pt; vertical-align: -1pt; } div.maincontent .s52 { color: black; font-family:Times New Roman, serif; font-style: normal; font-weight: normal; text-decoration: none; font-size: 9.5pt; vertical-align: -2pt; } div.maincontent .s53 { color: black; font-family:Times New Roman, serif; font-style: normal; font-weight: normal; text-decoration: none; font-size: 13pt; } div.maincontent .s54 { color: black; font-family:Times New Roman, serif; font-style: normal; font-weight: normal; text-decoration: none; font-size: 9.5pt; vertical-align: -1pt; } div.maincontent .s55 { color: black; font-family:Arial, sans-serif; font-style: normal; font-weight: normal; text-decoration: none; font-size: 10.5pt; } div.maincontent .s56 { color: #00F; font-family:Times New Roman, serif; font-style: normal; font-weight: normal; font-size: 14pt; } div.maincontent .s57 { color: #00F; font-family:Times New Roman, serif; font-style: normal; font-weight: normal; text-decoration: none; font-size: 14pt; } div.maincontent .s58 { color: #00F; font-family:Times New Roman, serif; font-style: normal; font-weight: normal; font-size: 14pt; } div.maincontent .s59 { color: #00F; font-family:Times New Roman, serif; font-style: normal; font-weight: normal; text-decoration: none; font-size: 13pt; } div.maincontent .s60 { color: #00F; font-family:Times New Roman, serif; font-style: normal; font-weight: normal; font-size: 13pt; } div.maincontent .s61 { color: black; font-family:Times New Roman, serif; font-style: normal; font-weight: bold; text-decoration: none; font-size: 14pt; } div.maincontent .s62 { color: black; font-family:Times New Roman, serif; font-style: italic; font-weight: bold; text-decoration: none; font-size: 14pt; } div.maincontent .s63 { color: black; font-family:Times New Roman, serif; font-style: italic; font-weight: bold; text-decoration: none; font-size: 14pt; } div.maincontent .content_head2 { color: #F00; font-family:Times New Roman, serif; font-style: normal; font-weight: bold; text-decoration: none; font-size: 14pt; } div.maincontent .s64 { color: black; font-family:Times New Roman, serif; font-style: italic; font-weight: bold; text-decoration: none; font-size: 13pt; } div.maincontent .s67 { color: black; font-family:Arial, sans-serif; font-style: normal; font-weight: normal; text-decoration: none; font-size: 9.5pt; } div.maincontent .s68 { color: black; font-family:Times New Roman, serif; font-style: normal; font-weight: bold; text-decoration: none; font-size: 12pt; } div.maincontent .s69 { color: black; font-family:Times New Roman, serif; font-style: italic; font-weight: normal; text-decoration: none; font-size: 12pt; } div.maincontent .s70 { color: black; font-family:Times New Roman, serif; font-style: normal; font-weight: normal; tex](https://tailieuthamkhao.com/uploads/2022/12/03/cac-nhan-to-anh-huong-den-hanh-vi-nguoi-tieu-dung-doi-voi-hoat-dong-13-1-120x90.jpg)
![Mobile Phone Usage in Hanoi Inner City Area
zt2i3t4l5ee
zt2a3gsconsumer,consumption,consumer behavior,marketing,mobile marketing
zt2a3ge
zc2o3n4t5e6n7ts
- Test the relationship between demographic variables and consumer behavior for Mobile Marketing activities
The analysis method used is the Chi-square test (χ2), with statistical hypotheses H0 and H1 and significance level α = 0.05. In case the P index (p-value) or Sig. index in SPSS has a value less than or equal to the significance level α, the hypothesis H0 is rejected and vice versa. With this testing procedure, the study can evaluate the difference in behavioral trends between demographic groups.
CHAPTER 4
RESEARCH RESULTS
During two months, 1,100 survey questionnaires were distributed to mobile phone users in the inner city of Hanoi using various methods such as direct interviews, sending via email or using questionnaires designed on the Internet. At the end of the survey, after checking and eliminating erroneous questionnaires, the study collected 858 complete questionnaires, equivalent to a rate of about 78%. In addition, the research subjects of the thesis are only people who are using mobile phones, so people who do not use mobile phones are not within the scope of the thesis, therefore, the questionnaires with the option of not using mobile phones were excluded from the scope of analysis. The number of suitable survey questionnaires included in the statistical analysis was 835.
4.1 Demographic characteristics of the sample
The structure of the survey sample is divided and statistically analyzed according to criteria such as gender, age, occupation, education level and personal income. (Detailed statistical table in Appendix 6)
- Gender structure: Of the 835 completed questionnaires, 49.8% of respondents were male, equivalent to 416 people, and 50.2% were female, equivalent to 419 people. The survey results of the study are completely consistent with the gender ratio in the population structure of Vietnam in general and Hanoi in particular (Male/Female: 49/51).
- Age structure: 36.6% of respondents are <23 years old, equivalent to 306 people. People from 23-34 years old
accounting for the highest proportion: 44.8% equivalent to 374 people, people aged 35-45 and >45 are 70 and 85 people equivalent to 8.4% and 10.2% respectively. Looking at the results of this survey, we can see that the young people - youth account for a large proportion of the total number of people participating in the survey. Meanwhile, the middle-aged people including two age groups of 35 - 45 and >45 have a low rate of participation in the survey. This is completely consistent with the reality when Mobile Marketing is identified as a Marketing service aimed at young people (people under 35 years old).
- Structure by educational level: among 835 valid responses, 541 respondents had university degrees, accounting for the highest proportion of ~ 75%, 102 had secondary school degrees, ~ 13.1%, and 93 had post-graduate degrees, ~ 11.9%.
- Occupational structure: office workers and civil servants are the group with the highest rate of participation with 39.4%, followed by students with 36.6%. Self-employed people account for 12%, retired housewives are 7.8% and other occupational groups account for 4.2%. The survey results show that the student group has the same rate as the group aged <23 at 36.6%. This shows the accuracy of the survey data. In addition, the survey results distributed by occupational criteria have a rate almost similar to the sample division rate in chapter 3. Therefore, it can be concluded that the survey data is suitable for use in analysis activities.
- Income structure: the group with income from 3 to 5 million has the highest rate with 39% of the total number of respondents. This is consistent with the income structure of Hanoi people and corresponds to the average income of the group of civil servants and office workers. Those
People with no income account for 23%, income under 3 million VND accounts for 13% and income over 5 million VND accounts for 25%.
4.2 Mobile phone usage in Hanoi inner city area
According to the survey results, most respondents said they had used the phone for more than 1 year, specifically: 68.4% used mobile phones from 4 to 10 years, 23.2% used from 1 to 3 years, 7.8% used for more than 10 years. Those who used mobile phones for less than 1 year accounted for only a very small proportion of ~ 0.6%. (Table 4.1)
Table 4.1: Time spent using mobile phones
Frequency
Ratio (%)
Valid Percentage
Cumulative Percentage
Alid
<1 year
5
.6
.6
.6
1-3 years
194
23.2
23.2
23.8
4-10 years
571
68.4
68.4
92.2
>10 years
65
7.8
7.8
100.0
Total
835
100.0
100.0
The survey indexes on the time of using mobile phones of consumers in the inner city of Hanoi are very impressive for a developing country like Vietnam and also prove that Vietnamese consumers have a lot of experience using this high-tech device. Moreover, with the majority of consumers surveyed having a relatively long time of use (4-10 years), it partly proves that mobile phones have become an important and essential item in peoples daily lives.
When asked about the mobile phone network they are using, 31% of respondents said they are using the network of Vietel company, 29% use the network of
of Mobifone company, 27% use Vinaphone companys network and 13% use networks of other providers such as E-VN telecom, S-fone, Beeline, Vietnammobile. (Figure 4.1).
Figure 4.1: Mobile phone network in use
Compared with the announced market share of mobile telecommunications service providers in Vietnam (Vietel: 36%, Mobifone: 29%, Vinaphone: 28%, the remaining networks: 7%), we see that the survey results do not have many differences. However, the statistics show that there is a difference in the market share of other networks because the Hanoi market is one of the two main markets of small networks, so their market share in this area will certainly be higher than that of the whole country.
According to a report by NielsenMobile (2009) [8], the number of prepaid mobile phone subscribers in Hanoi accounts for 95% of the total number of subscribers, however, the results of this survey show that the percentage of prepaid subscribers has decreased by more than 20%, only at 70.8%. On the contrary, the number of postpaid subscribers tends to increase from 5% in 2009 to 19.2%. Those who are simultaneously using both types of subscriptions account for 10%. (Table 4.2).
Table 4.2: Types of mobile phone subscribers
Frequency
Ratio (%)
Valid Percentage
Cumulative Percentage
Valid
Prepay
591
70.8
70.8
70.8
Pay later
160
19.2
19.2
89.9
Both of the above
84
10.1
10.1
100.0
Total
835
100.0
100.0
The above figures show the change in the psychology and consumption habits of Vietnamese consumers towards mobile telecommunications services, when the use of prepaid subscriptions and junk SIMs is replaced by the use of two types of subscriptions for different purposes and needs or switching to postpaid subscriptions to enjoy better customer care services.
In addition, the majority of respondents have an average spending level for mobile phone services from 100 to 300 thousand VND (406 ~ 48.6% of total respondents). The high spending level (> 500 thousand VND) is the spending level with the lowest number of people with only 8.4%, on the contrary, the low spending level (under 100 thousand VND) accounts for the second highest proportion among the groups of respondents with 25.4%. People with low spending levels mainly fall into the group of students and retirees/housewives - those who have little need to use or mainly use promotional SIM cards. (Table 4.3).
Table 4.3: Spending on mobile phone charges
Frequency
Ratio (%)
Valid Percentage
Cumulative Percentage
Valid
<100,000
212
25.4
25.4
25.4
100-300,000
406
48.6
48.6
74.0
300,000-500,000
147
17.6
17.6
91.6
>500,000
70
8.4
8.4
100.0
Total
835
100.0
100.0
The statistics in Table 4.3 are similar to the percentages in the NielsenMobile survey results (2009) with 73% of mobile phone users having medium spending levels and only 13% having high spending levels.
The survey results also showed that up to 31% ~ nearly one-third of respondents said they sent more than 10 SMS messages/day, meaning that on average they sent 1 SMS message for every working hour. Those with an average SMS message volume (from 3 to 10 messages/day) accounted for 51.1% and those with a low SMS message volume (less than 3 messages/day) accounted for 17%. (Table 4.4)
Table 4.4: Number of SMS messages sent per day
Frequency
Ratio (%)
Valid Percentage
Cumulative Percentage
Valid
<3 news
142
17.0
17.0
17.0
3-10 news
427
51.1
51.1
68.1
>10 news
266
31.9
31.9
100.0
Total
835
100.0
100.0
Similar to sending messages, those with an average message receiving rate (from 3-10 messages/day) accounted for the highest percentage of ~ 55%, followed by those with a high number of messages (over 10 messages/day) ~ 24% and those with a low number of messages received daily (under 3 messages/day) remained at the bottom with 21%. (Table 4.5)
Table 4.5: Number of SMS messages received per day
Frequency
Ratio (%)
Valid Percentage
Cumulative Percentage
Valid
<3 news
175
21.0
21.0
21.0
3-10 news
436
55.0
55.0
76.0
>10 news
197
24.0
24.0
100.0
Total
835
100.0
100.0
When comparing the data of the two result tables 4.4 and 4.5, we can see the reasonableness between the ratio of the number of messages sent and the number of messages received daily by the interview participants.
4.3 Current status of SMS advertising and Mobile Marketing
According to the interview results, in the 3 months from the time of the survey and before, 94% of respondents, equivalent to 785 people, said they received advertising messages, while only a very small percentage of 6% (only 50 people) did not receive advertising messages (Table 4.6).
Table 4.6: Percentage of people receiving advertising messages in the last 3 months
Frequency
Ratio (%)
Valid Percentage
Cumulative Percentage
Valid
Have
785
94.0
94.0
94.0
Are not
50
6.0
6.0
100.0
Total
835
100.0
100.0
The results of Table 4.6 show that consumers in the inner city of Hanoi are very familiar with advertising messages. This result is also the basis for assessing the knowledge, experience and understanding of the respondents in the interview. This is also one of the important factors determining the accuracy of the survey results.
In addition, most respondents said they had received promotional messages, but only 24% of them had ever taken the action of registering to receive promotional messages, while 76% of the remaining respondents did not register to receive promotional messages but still received promotional messages every day. This is the first sign indicating the weaknesses and shortcomings of lax management of this activity in Vietnam. (Table 4.7)
div.maincontent .s1 { color: black; font-family:Times New Roman, serif; font-style: italic; font-weight: normal; text-decoration: none; font-size: 14pt; } div.maincontent .s2 { color: black; font-family:Times New Roman, serif; font-style: normal; font-weight: bold; text-decoration: none; font-size: 14pt; } div.maincontent .s3 { color: black; font-family:Times New Roman, serif; font-style: normal; font-weight: bold; text-decoration: none; font-size: 14pt; } div.maincontent .p { color: black; font-family:Times New Roman, serif; font-style: normal; font-weight: normal; text-decoration: none; font-size: 14pt; margin:0pt; } div.maincontent p { color: black; font-family:Times New Roman, serif; font-style: normal; font-weight: normal; text-decoration: none; font-size: 14pt; margin:0pt; } div.maincontent .s4 { color: black; font-family:Times New Roman, serif; font-style: normal; font-weight: normal; text-decoration: none; font-size: 9.5pt; vertical-align: 6pt; } div.maincontent .s5 { color: black; font-family:Times New Roman, serif; font-style: normal; font-weight: bold; text-decoration: none; font-size: 14pt; } div.maincontent .s6 { color: black; font-family:Times New Roman, serif; font-style: normal; font-weight: bold; text-decoration: none; font-size: 14pt; } div.maincontent .s7 { color: black; font-family:Times New Roman, serif; font-style: italic; font-weight: normal; text-decoration: none; font-size: 14pt; } div.maincontent .s8 { color: black; font-family:Times New Roman, serif; font-style: italic; font-weight: bold; text-decoration: none; font-size: 14pt; } div.maincontent .s9 { color: black; font-family:Arial, sans-serif; font-style: normal; font-weight: normal; text-decoration: none; font-size: 14pt; } div.maincontent .s10 { color: black; font-family:Arial, sans-serif; font-style: normal; font-weight: normal; text-decoration: none; font-size: 12pt; } div.maincontent .s11 { color: black; font-family:Times New Roman, serif; font-style: normal; font-weight: normal; font-size: 14pt; } div.maincontent .s12 { color: black; font-family:Arial, sans-serif; font-style: normal; font-weight: normal; text-decoration: none; font-size: 14pt; } div.maincontent .s13 { color: black; font-family:Times New Roman, serif; font-style: normal; font-weight: normal; text-decoration: none; font-size: 14pt; } div.maincontent .s14 { color: black; font-family:Times New Roman, serif; font-style: normal; font-weight: bold; text-decoration: none; font-size: 13pt; } div.maincontent .s15 { color: black; font-family:Times New Roman, serif; font-style: italic; font-weight: normal; text-decoration: none; font-size: 9.5pt; vertical-align: 6pt; } div.maincontent .s16 { color: black; font-family:Times New Roman, serif; font-style: normal; font-weight: normal; text-decoration: none; font-size: 5.5pt; vertical-align: 3pt; } div.maincontent .s17 { color: black; font-family:Times New Roman, serif; font-style: normal; font-weight: normal; text-decoration: none; font-size: 8.5pt; } div.maincontent .s18 { color: black; font-family:Times New Roman, serif; font-style: italic; font-weight: bold; font-size: 14pt; } div.maincontent .s19 { color: black; font-family:Times New Roman, serif; font-style: normal; font-weight: bold; font-size: 14pt; } div.maincontent .s20 { color: black; font-family:Times New Roman, serif; font-style: italic; font-weight: normal; text-decoration: none; font-size: 13pt; } div.maincontent .s21 { color: black; font-family:Times New Roman, serif; font-style: normal; font-weight: normal; text-decoration: none; font-size: 14pt; } div.maincontent .s22 { color: black; font-family:Courier New, monospace; font-style: normal; font-weight: normal; text-decoration: none; font-size: 14pt; } div.maincontent .s23 { color: black; font-family:Times New Roman, serif; font-style: normal; font-weight: normal; text-decoration: none; font-size: 13pt; } div.maincontent .s24 { color: black; font-family:Times New Roman, serif; font-style: italic; font-weight: normal; text-decoration: none; font-size: 13pt; } div.maincontent .s25 { color: black; font-family:Times New Roman, serif; font-style: normal; font-weight: bold; text-decoration: none; font-size: 14pt; } div.maincontent .s26 { color: black; font-family:Times New Roman, serif; font-style: normal; font-weight: normal; text-decoration: none; font-size: 14pt; } div.maincontent .s27 { color: black; font-family:Times New Roman, serif; font-style: normal; font-weight: normal; text-decoration: none; font-size: 1.5pt; } div.maincontent .s28 { color: black; font-family:Times New Roman, serif; font-style: normal; font-weight: normal; text-decoration: none; font-size: 11pt; } div.maincontent .s29 { color: black; font-family:Times New Roman, serif; font-style: normal; font-weight: bold; text-decoration: none; font-size: 13pt; } div.maincontent .s30 { color: black; font-family:Times New Roman, serif; font-style: italic; font-weight: bold; text-decoration: none; font-size: 13pt; } div.maincontent .s31 { color: black; font-family:Times New Roman, serif; font-style: normal; font-weight: normal; text-decoration: none; font-size: 13pt; } div.maincontent .s32 { color: black; font-family:Arial, sans-serif; font-style: normal; font-weight: normal; text-decoration: none; font-size: 10.5pt; } div.maincontent .s33 { color: black; font-family:Arial, sans-serif; font-style: normal; font-weight: normal; text-decoration: none; font-size: 11pt; } div.maincontent .s35 { color: black; font-family:Arial, sans-serif; font-style: normal; font-weight: bold; text-decoration: none; font-size: 10.5pt; } div.maincontent .s36 { color: #F00; font-family:Arial, sans-serif; font-style: italic; font-weight: bold; text-decoration: none; font-size: 10.5pt; } div.maincontent .s37 { color: black; font-family:Arial, sans-serif; font-style: normal; font-weight: bold; text-decoration: none; font-size: 10.5pt; } div.maincontent .s38 { color: black; font-family:Times New Roman, serif; font-style: normal; font-weight: bold; text-decoration: none; font-size: 8.5pt; vertical-align: 5pt; } div.maincontent .s39 { color: black; font-family:Arial, sans-serif; font-style: normal; font-weight: normal; text-decoration: none; font-size: 10.5pt; } div.maincontent .s40 { color: black; font-family:Arial, sans-serif; font-style: normal; font-weight: normal; text-decoration: none; font-size: 7pt; vertical-align: 4pt; } div.maincontent .s41 { color: black; font-family:Arial, sans-serif; font-style: normal; font-weight: bold; text-decoration: none; font-size: 10.5pt; } div.maincontent .s42 { color: black; font-family:Arial, sans-serif; font-style: normal; font-weight: bold; text-decoration: none; font-size: 11pt; } div.maincontent .s43 { color: black; font-family:Arial, sans-serif; font-style: normal; font-weight: bold; text-decoration: none; font-size: 7.5pt; vertical-align: 5pt; } div.maincontent .s44 { color: black; font-family:Arial, sans-serif; font-style: normal; font-weight: normal; text-decoration: none; font-size: 7pt; vertical-align: 5pt; } div.maincontent .s45 { color: #F00; font-family:Arial, sans-serif; font-style: normal; font-weight: bold; text-decoration: none; font-size: 10.5pt; } div.maincontent .s46 { color: black; font-family:Arial, sans-serif; font-style: normal; font-weight: bold; text-decoration: none; font-size: 7pt; vertical-align: 5pt; } div.maincontent .s47 { color: black; font-family:Arial, sans-serif; font-style: normal; font-weight: bold; text-decoration: none; font-size: 11pt; } div.maincontent .s48 { color: black; font-family:Times New Roman, serif; font-style: normal; font-weight: normal; text-decoration: none; font-size: 14pt; } div.maincontent .s49 { color: black; font-family:Times New Roman, serif; font-style: italic; font-weight: normal; text-decoration: none; font-size: 9.5pt; vertical-align: -2pt; } div.maincontent .s50 { color: black; font-family:Times New Roman, serif; font-style: normal; font-weight: normal; text-decoration: none; font-size: 9.5pt; } div.maincontent .s51 { color: black; font-family:Times New Roman, serif; font-style: italic; font-weight: normal; text-decoration: none; font-size: 9.5pt; vertical-align: -1pt; } div.maincontent .s52 { color: black; font-family:Times New Roman, serif; font-style: normal; font-weight: normal; text-decoration: none; font-size: 9.5pt; vertical-align: -2pt; } div.maincontent .s53 { color: black; font-family:Times New Roman, serif; font-style: normal; font-weight: normal; text-decoration: none; font-size: 13pt; } div.maincontent .s54 { color: black; font-family:Times New Roman, serif; font-style: normal; font-weight: normal; text-decoration: none; font-size: 9.5pt; vertical-align: -1pt; } div.maincontent .s55 { color: black; font-family:Arial, sans-serif; font-style: normal; font-weight: normal; text-decoration: none; font-size: 10.5pt; } div.maincontent .s56 { color: #00F; font-family:Times New Roman, serif; font-style: normal; font-weight: normal; font-size: 14pt; } div.maincontent .s57 { color: #00F; font-family:Times New Roman, serif; font-style: normal; font-weight: normal; text-decoration: none; font-size: 14pt; } div.maincontent .s58 { color: #00F; font-family:Times New Roman, serif; font-style: normal; font-weight: normal; font-size: 14pt; } div.maincontent .s59 { color: #00F; font-family:Times New Roman, serif; font-style: normal; font-weight: normal; text-decoration: none; font-size: 13pt; } div.maincontent .s60 { color: #00F; font-family:Times New Roman, serif; font-style: normal; font-weight: normal; font-size: 13pt; } div.maincontent .s61 { color: black; font-family:Times New Roman, serif; font-style: normal; font-weight: bold; text-decoration: none; font-size: 14pt; } div.maincontent .s62 { color: black; font-family:Times New Roman, serif; font-style: italic; font-weight: bold; text-decoration: none; font-size: 14pt; } div.maincontent .s63 { color: black; font-family:Times New Roman, serif; font-style: italic; font-weight: bold; text-decoration: none; font-size: 14pt; } div.maincontent .content_head2 { color: #F00; font-family:Times New Roman, serif; font-style: normal; font-weight: bold; text-decoration: none; font-size: 14pt; } div.maincontent .s64 { color: black; font-family:Times New Roman, serif; font-style: italic; font-weight: bold; text-decoration: none; font-size: 13pt; } div.maincontent .s67 { color: black; font-family:Arial, sans-serif; font-style: normal; font-weight: normal; text-decoration: none; font-size: 9.5pt; } div.maincontent .s68 { color: black; font-family:Times New Roman, serif; font-style: normal; font-weight: bold; text-decoration: none; font-size: 12pt; } div.maincontent .s69 { color: black; font-family:Times New Roman, serif; font-style: italic; font-weight: normal; text-decoration: none; font-size: 12pt; } div.maincontent .s70 { color: black; font-family:Times New Roman, serif; font-style: normal; font-weight: normal; tex](data:image/svg+xml,%3Csvg%20xmlns=%22http://www.w3.org/2000/svg%22%20viewBox=%220%200%2075%2075%22%3E%3C/svg%3E) Mobile Phone Usage in Hanoi Inner City Area
zt2i3t4l5ee
zt2a3gsconsumer,consumption,consumer behavior,marketing,mobile marketing
zt2a3ge
zc2o3n4t5e6n7ts
- Test the relationship between demographic variables and consumer behavior for Mobile Marketing activities
The analysis method used is the Chi-square test (χ2), with statistical hypotheses H0 and H1 and significance level α = 0.05. In case the P index (p-value) or Sig. index in SPSS has a value less than or equal to the significance level α, the hypothesis H0 is rejected and vice versa. With this testing procedure, the study can evaluate the difference in behavioral trends between demographic groups.
CHAPTER 4
RESEARCH RESULTS
During two months, 1,100 survey questionnaires were distributed to mobile phone users in the inner city of Hanoi using various methods such as direct interviews, sending via email or using questionnaires designed on the Internet. At the end of the survey, after checking and eliminating erroneous questionnaires, the study collected 858 complete questionnaires, equivalent to a rate of about 78%. In addition, the research subjects of the thesis are only people who are using mobile phones, so people who do not use mobile phones are not within the scope of the thesis, therefore, the questionnaires with the option of not using mobile phones were excluded from the scope of analysis. The number of suitable survey questionnaires included in the statistical analysis was 835.
4.1 Demographic characteristics of the sample
The structure of the survey sample is divided and statistically analyzed according to criteria such as gender, age, occupation, education level and personal income. (Detailed statistical table in Appendix 6)
- Gender structure: Of the 835 completed questionnaires, 49.8% of respondents were male, equivalent to 416 people, and 50.2% were female, equivalent to 419 people. The survey results of the study are completely consistent with the gender ratio in the population structure of Vietnam in general and Hanoi in particular (Male/Female: 49/51).
- Age structure: 36.6% of respondents are <23 years old, equivalent to 306 people. People from 23-34 years old
accounting for the highest proportion: 44.8% equivalent to 374 people, people aged 35-45 and >45 are 70 and 85 people equivalent to 8.4% and 10.2% respectively. Looking at the results of this survey, we can see that the young people - youth account for a large proportion of the total number of people participating in the survey. Meanwhile, the middle-aged people including two age groups of 35 - 45 and >45 have a low rate of participation in the survey. This is completely consistent with the reality when Mobile Marketing is identified as a Marketing service aimed at young people (people under 35 years old).
- Structure by educational level: among 835 valid responses, 541 respondents had university degrees, accounting for the highest proportion of ~ 75%, 102 had secondary school degrees, ~ 13.1%, and 93 had post-graduate degrees, ~ 11.9%.
- Occupational structure: office workers and civil servants are the group with the highest rate of participation with 39.4%, followed by students with 36.6%. Self-employed people account for 12%, retired housewives are 7.8% and other occupational groups account for 4.2%. The survey results show that the student group has the same rate as the group aged <23 at 36.6%. This shows the accuracy of the survey data. In addition, the survey results distributed by occupational criteria have a rate almost similar to the sample division rate in chapter 3. Therefore, it can be concluded that the survey data is suitable for use in analysis activities.
- Income structure: the group with income from 3 to 5 million has the highest rate with 39% of the total number of respondents. This is consistent with the income structure of Hanoi people and corresponds to the average income of the group of civil servants and office workers. Those
People with no income account for 23%, income under 3 million VND accounts for 13% and income over 5 million VND accounts for 25%.
4.2 Mobile phone usage in Hanoi inner city area
According to the survey results, most respondents said they had used the phone for more than 1 year, specifically: 68.4% used mobile phones from 4 to 10 years, 23.2% used from 1 to 3 years, 7.8% used for more than 10 years. Those who used mobile phones for less than 1 year accounted for only a very small proportion of ~ 0.6%. (Table 4.1)
Table 4.1: Time spent using mobile phones
Frequency
Ratio (%)
Valid Percentage
Cumulative Percentage
Alid
<1 year
5
.6
.6
.6
1-3 years
194
23.2
23.2
23.8
4-10 years
571
68.4
68.4
92.2
>10 years
65
7.8
7.8
100.0
Total
835
100.0
100.0
The survey indexes on the time of using mobile phones of consumers in the inner city of Hanoi are very impressive for a developing country like Vietnam and also prove that Vietnamese consumers have a lot of experience using this high-tech device. Moreover, with the majority of consumers surveyed having a relatively long time of use (4-10 years), it partly proves that mobile phones have become an important and essential item in people's daily lives.
When asked about the mobile phone network they are using, 31% of respondents said they are using the network of Vietel company, 29% use the network of
of Mobifone company, 27% use Vinaphone company's network and 13% use networks of other providers such as E-VN telecom, S-fone, Beeline, Vietnammobile. (Figure 4.1).
Figure 4.1: Mobile phone network in use
Compared with the announced market share of mobile telecommunications service providers in Vietnam (Vietel: 36%, Mobifone: 29%, Vinaphone: 28%, the remaining networks: 7%), we see that the survey results do not have many differences. However, the statistics show that there is a difference in the market share of other networks because the Hanoi market is one of the two main markets of small networks, so their market share in this area will certainly be higher than that of the whole country.
According to a report by NielsenMobile (2009) [8], the number of prepaid mobile phone subscribers in Hanoi accounts for 95% of the total number of subscribers, however, the results of this survey show that the percentage of prepaid subscribers has decreased by more than 20%, only at 70.8%. On the contrary, the number of postpaid subscribers tends to increase from 5% in 2009 to 19.2%. Those who are simultaneously using both types of subscriptions account for 10%. (Table 4.2).
Table 4.2: Types of mobile phone subscribers
Frequency
Ratio (%)
Valid Percentage
Cumulative Percentage
Valid
Prepay
591
70.8
70.8
70.8
Pay later
160
19.2
19.2
89.9
Both of the above
84
10.1
10.1
100.0
Total
835
100.0
100.0
The above figures show the change in the psychology and consumption habits of Vietnamese consumers towards mobile telecommunications services, when the use of prepaid subscriptions and junk SIMs is replaced by the use of two types of subscriptions for different purposes and needs or switching to postpaid subscriptions to enjoy better customer care services.
In addition, the majority of respondents have an average spending level for mobile phone services from 100 to 300 thousand VND (406 ~ 48.6% of total respondents). The high spending level (> 500 thousand VND) is the spending level with the lowest number of people with only 8.4%, on the contrary, the low spending level (under 100 thousand VND) accounts for the second highest proportion among the groups of respondents with 25.4%. People with low spending levels mainly fall into the group of students and retirees/housewives - those who have little need to use or mainly use promotional SIM cards. (Table 4.3).
Table 4.3: Spending on mobile phone charges
Frequency
Ratio (%)
Valid Percentage
Cumulative Percentage
Valid
<100,000
212
25.4
25.4
25.4
100-300,000
406
48.6
48.6
74.0
300,000-500,000
147
17.6
17.6
91.6
>500,000
70
8.4
8.4
100.0
Total
835
100.0
100.0
The statistics in Table 4.3 are similar to the percentages in the NielsenMobile survey results (2009) with 73% of mobile phone users having medium spending levels and only 13% having high spending levels.
The survey results also showed that up to 31% ~ nearly one-third of respondents said they sent more than 10 SMS messages/day, meaning that on average they sent 1 SMS message for every working hour. Those with an average SMS message volume (from 3 to 10 messages/day) accounted for 51.1% and those with a low SMS message volume (less than 3 messages/day) accounted for 17%. (Table 4.4)
Table 4.4: Number of SMS messages sent per day
Frequency
Ratio (%)
Valid Percentage
Cumulative Percentage
Valid
<3 news
142
17.0
17.0
17.0
3-10 news
427
51.1
51.1
68.1
>10 news
266
31.9
31.9
100.0
Total
835
100.0
100.0
Similar to sending messages, those with an average message receiving rate (from 3-10 messages/day) accounted for the highest percentage of ~ 55%, followed by those with a high number of messages (over 10 messages/day) ~ 24% and those with a low number of messages received daily (under 3 messages/day) remained at the bottom with 21%. (Table 4.5)
Table 4.5: Number of SMS messages received per day
Frequency
Ratio (%)
Valid Percentage
Cumulative Percentage
Valid
<3 news
175
21.0
21.0
21.0
3-10 news
436
55.0
55.0
76.0
>10 news
197
24.0
24.0
100.0
Total
835
100.0
100.0
When comparing the data of the two result tables 4.4 and 4.5, we can see the reasonableness between the ratio of the number of messages sent and the number of messages received daily by the interview participants.
4.3 Current status of SMS advertising and Mobile Marketing
According to the interview results, in the 3 months from the time of the survey and before, 94% of respondents, equivalent to 785 people, said they received advertising messages, while only a very small percentage of 6% (only 50 people) did not receive advertising messages (Table 4.6).
Table 4.6: Percentage of people receiving advertising messages in the last 3 months
Frequency
Ratio (%)
Valid Percentage
Cumulative Percentage
Valid
Have
785
94.0
94.0
94.0
Are not
50
6.0
6.0
100.0
Total
835
100.0
100.0
The results of Table 4.6 show that consumers in the inner city of Hanoi are very familiar with advertising messages. This result is also the basis for assessing the knowledge, experience and understanding of the respondents in the interview. This is also one of the important factors determining the accuracy of the survey results.
In addition, most respondents said they had received promotional messages, but only 24% of them had ever taken the action of registering to receive promotional messages, while 76% of the remaining respondents did not register to receive promotional messages but still received promotional messages every day. This is the first sign indicating the weaknesses and shortcomings of lax management of this activity in Vietnam. (Table 4.7)
div.maincontent .s1 { color: black; font-family:"Times New Roman", serif; font-style: italic; font-weight: normal; text-decoration: none; font-size: 14pt; } div.maincontent .s2 { color: black; font-family:"Times New Roman", serif; font-style: normal; font-weight: bold; text-decoration: none; font-size: 14pt; } div.maincontent .s3 { color: black; font-family:"Times New Roman", serif; font-style: normal; font-weight: bold; text-decoration: none; font-size: 14pt; } div.maincontent .p { color: black; font-family:"Times New Roman", serif; font-style: normal; font-weight: normal; text-decoration: none; font-size: 14pt; margin:0pt; } div.maincontent p { color: black; font-family:"Times New Roman", serif; font-style: normal; font-weight: normal; text-decoration: none; font-size: 14pt; margin:0pt; } div.maincontent .s4 { color: black; font-family:"Times New Roman", serif; font-style: normal; font-weight: normal; text-decoration: none; font-size: 9.5pt; vertical-align: 6pt; } div.maincontent .s5 { color: black; font-family:"Times New Roman", serif; font-style: normal; font-weight: bold; text-decoration: none; font-size: 14pt; } div.maincontent .s6 { color: black; font-family:"Times New Roman", serif; font-style: normal; font-weight: bold; text-decoration: none; font-size: 14pt; } div.maincontent .s7 { color: black; font-family:"Times New Roman", serif; font-style: italic; font-weight: normal; text-decoration: none; font-size: 14pt; } div.maincontent .s8 { color: black; font-family:"Times New Roman", serif; font-style: italic; font-weight: bold; text-decoration: none; font-size: 14pt; } div.maincontent .s9 { color: black; font-family:Arial, sans-serif; font-style: normal; font-weight: normal; text-decoration: none; font-size: 14pt; } div.maincontent .s10 { color: black; font-family:Arial, sans-serif; font-style: normal; font-weight: normal; text-decoration: none; font-size: 12pt; } div.maincontent .s11 { color: black; font-family:"Times New Roman", serif; font-style: normal; font-weight: normal; font-size: 14pt; } div.maincontent .s12 { color: black; font-family:Arial, sans-serif; font-style: normal; font-weight: normal; text-decoration: none; font-size: 14pt; } div.maincontent .s13 { color: black; font-family:"Times New Roman", serif; font-style: normal; font-weight: normal; text-decoration: none; font-size: 14pt; } div.maincontent .s14 { color: black; font-family:"Times New Roman", serif; font-style: normal; font-weight: bold; text-decoration: none; font-size: 13pt; } div.maincontent .s15 { color: black; font-family:"Times New Roman", serif; font-style: italic; font-weight: normal; text-decoration: none; font-size: 9.5pt; vertical-align: 6pt; } div.maincontent .s16 { color: black; font-family:"Times New Roman", serif; font-style: normal; font-weight: normal; text-decoration: none; font-size: 5.5pt; vertical-align: 3pt; } div.maincontent .s17 { color: black; font-family:"Times New Roman", serif; font-style: normal; font-weight: normal; text-decoration: none; font-size: 8.5pt; } div.maincontent .s18 { color: black; font-family:"Times New Roman", serif; font-style: italic; font-weight: bold; font-size: 14pt; } div.maincontent .s19 { color: black; font-family:"Times New Roman", serif; font-style: normal; font-weight: bold; font-size: 14pt; } div.maincontent .s20 { color: black; font-family:"Times New Roman", serif; font-style: italic; font-weight: normal; text-decoration: none; font-size: 13pt; } div.maincontent .s21 { color: black; font-family:"Times New Roman", serif; font-style: normal; font-weight: normal; text-decoration: none; font-size: 14pt; } div.maincontent .s22 { color: black; font-family:"Courier New", monospace; font-style: normal; font-weight: normal; text-decoration: none; font-size: 14pt; } div.maincontent .s23 { color: black; font-family:"Times New Roman", serif; font-style: normal; font-weight: normal; text-decoration: none; font-size: 13pt; } div.maincontent .s24 { color: black; font-family:"Times New Roman", serif; font-style: italic; font-weight: normal; text-decoration: none; font-size: 13pt; } div.maincontent .s25 { color: black; font-family:"Times New Roman", serif; font-style: normal; font-weight: bold; text-decoration: none; font-size: 14pt; } div.maincontent .s26 { color: black; font-family:"Times New Roman", serif; font-style: normal; font-weight: normal; text-decoration: none; font-size: 14pt; } div.maincontent .s27 { color: black; font-family:"Times New Roman", serif; font-style: normal; font-weight: normal; text-decoration: none; font-size: 1.5pt; } div.maincontent .s28 { color: black; font-family:"Times New Roman", serif; font-style: normal; font-weight: normal; text-decoration: none; font-size: 11pt; } div.maincontent .s29 { color: black; font-family:"Times New Roman", serif; font-style: normal; font-weight: bold; text-decoration: none; font-size: 13pt; } div.maincontent .s30 { color: black; font-family:"Times New Roman", serif; font-style: italic; font-weight: bold; text-decoration: none; font-size: 13pt; } div.maincontent .s31 { color: black; font-family:"Times New Roman", serif; font-style: normal; font-weight: normal; text-decoration: none; font-size: 13pt; } div.maincontent .s32 { color: black; font-family:Arial, sans-serif; font-style: normal; font-weight: normal; text-decoration: none; font-size: 10.5pt; } div.maincontent .s33 { color: black; font-family:Arial, sans-serif; font-style: normal; font-weight: normal; text-decoration: none; font-size: 11pt; } div.maincontent .s35 { color: black; font-family:Arial, sans-serif; font-style: normal; font-weight: bold; text-decoration: none; font-size: 10.5pt; } div.maincontent .s36 { color: #F00; font-family:Arial, sans-serif; font-style: italic; font-weight: bold; text-decoration: none; font-size: 10.5pt; } div.maincontent .s37 { color: black; font-family:Arial, sans-serif; font-style: normal; font-weight: bold; text-decoration: none; font-size: 10.5pt; } div.maincontent .s38 { color: black; font-family:"Times New Roman", serif; font-style: normal; font-weight: bold; text-decoration: none; font-size: 8.5pt; vertical-align: 5pt; } div.maincontent .s39 { color: black; font-family:Arial, sans-serif; font-style: normal; font-weight: normal; text-decoration: none; font-size: 10.5pt; } div.maincontent .s40 { color: black; font-family:Arial, sans-serif; font-style: normal; font-weight: normal; text-decoration: none; font-size: 7pt; vertical-align: 4pt; } div.maincontent .s41 { color: black; font-family:Arial, sans-serif; font-style: normal; font-weight: bold; text-decoration: none; font-size: 10.5pt; } div.maincontent .s42 { color: black; font-family:Arial, sans-serif; font-style: normal; font-weight: bold; text-decoration: none; font-size: 11pt; } div.maincontent .s43 { color: black; font-family:Arial, sans-serif; font-style: normal; font-weight: bold; text-decoration: none; font-size: 7.5pt; vertical-align: 5pt; } div.maincontent .s44 { color: black; font-family:Arial, sans-serif; font-style: normal; font-weight: normal; text-decoration: none; font-size: 7pt; vertical-align: 5pt; } div.maincontent .s45 { color: #F00; font-family:Arial, sans-serif; font-style: normal; font-weight: bold; text-decoration: none; font-size: 10.5pt; } div.maincontent .s46 { color: black; font-family:Arial, sans-serif; font-style: normal; font-weight: bold; text-decoration: none; font-size: 7pt; vertical-align: 5pt; } div.maincontent .s47 { color: black; font-family:Arial, sans-serif; font-style: normal; font-weight: bold; text-decoration: none; font-size: 11pt; } div.maincontent .s48 { color: black; font-family:"Times New Roman", serif; font-style: normal; font-weight: normal; text-decoration: none; font-size: 14pt; } div.maincontent .s49 { color: black; font-family:"Times New Roman", serif; font-style: italic; font-weight: normal; text-decoration: none; font-size: 9.5pt; vertical-align: -2pt; } div.maincontent .s50 { color: black; font-family:"Times New Roman", serif; font-style: normal; font-weight: normal; text-decoration: none; font-size: 9.5pt; } div.maincontent .s51 { color: black; font-family:"Times New Roman", serif; font-style: italic; font-weight: normal; text-decoration: none; font-size: 9.5pt; vertical-align: -1pt; } div.maincontent .s52 { color: black; font-family:"Times New Roman", serif; font-style: normal; font-weight: normal; text-decoration: none; font-size: 9.5pt; vertical-align: -2pt; } div.maincontent .s53 { color: black; font-family:"Times New Roman", serif; font-style: normal; font-weight: normal; text-decoration: none; font-size: 13pt; } div.maincontent .s54 { color: black; font-family:"Times New Roman", serif; font-style: normal; font-weight: normal; text-decoration: none; font-size: 9.5pt; vertical-align: -1pt; } div.maincontent .s55 { color: black; font-family:Arial, sans-serif; font-style: normal; font-weight: normal; text-decoration: none; font-size: 10.5pt; } div.maincontent .s56 { color: #00F; font-family:"Times New Roman", serif; font-style: normal; font-weight: normal; font-size: 14pt; } div.maincontent .s57 { color: #00F; font-family:"Times New Roman", serif; font-style: normal; font-weight: normal; text-decoration: none; font-size: 14pt; } div.maincontent .s58 { color: #00F; font-family:"Times New Roman", serif; font-style: normal; font-weight: normal; font-size: 14pt; } div.maincontent .s59 { color: #00F; font-family:"Times New Roman", serif; font-style: normal; font-weight: normal; text-decoration: none; font-size: 13pt; } div.maincontent .s60 { color: #00F; font-family:"Times New Roman", serif; font-style: normal; font-weight: normal; font-size: 13pt; } div.maincontent .s61 { color: black; font-family:"Times New Roman", serif; font-style: normal; font-weight: bold; text-decoration: none; font-size: 14pt; } div.maincontent .s62 { color: black; font-family:"Times New Roman", serif; font-style: italic; font-weight: bold; text-decoration: none; font-size: 14pt; } div.maincontent .s63 { color: black; font-family:"Times New Roman", serif; font-style: italic; font-weight: bold; text-decoration: none; font-size: 14pt; } div.maincontent .content_head2 { color: #F00; font-family:"Times New Roman", serif; font-style: normal; font-weight: bold; text-decoration: none; font-size: 14pt; } div.maincontent .s64 { color: black; font-family:"Times New Roman", serif; font-style: italic; font-weight: bold; text-decoration: none; font-size: 13pt; } div.maincontent .s67 { color: black; font-family:Arial, sans-serif; font-style: normal; font-weight: normal; text-decoration: none; font-size: 9.5pt; } div.maincontent .s68 { color: black; font-family:"Times New Roman", serif; font-style: normal; font-weight: bold; text-decoration: none; font-size: 12pt; } div.maincontent .s69 { color: black; font-family:"Times New Roman", serif; font-style: italic; font-weight: normal; text-decoration: none; font-size: 12pt; } div.maincontent .s70 { color: black; font-family:"Times New Roman", serif; font-style: normal; font-weight: normal; tex
Mobile Phone Usage in Hanoi Inner City Area
zt2i3t4l5ee
zt2a3gsconsumer,consumption,consumer behavior,marketing,mobile marketing
zt2a3ge
zc2o3n4t5e6n7ts
- Test the relationship between demographic variables and consumer behavior for Mobile Marketing activities
The analysis method used is the Chi-square test (χ2), with statistical hypotheses H0 and H1 and significance level α = 0.05. In case the P index (p-value) or Sig. index in SPSS has a value less than or equal to the significance level α, the hypothesis H0 is rejected and vice versa. With this testing procedure, the study can evaluate the difference in behavioral trends between demographic groups.
CHAPTER 4
RESEARCH RESULTS
During two months, 1,100 survey questionnaires were distributed to mobile phone users in the inner city of Hanoi using various methods such as direct interviews, sending via email or using questionnaires designed on the Internet. At the end of the survey, after checking and eliminating erroneous questionnaires, the study collected 858 complete questionnaires, equivalent to a rate of about 78%. In addition, the research subjects of the thesis are only people who are using mobile phones, so people who do not use mobile phones are not within the scope of the thesis, therefore, the questionnaires with the option of not using mobile phones were excluded from the scope of analysis. The number of suitable survey questionnaires included in the statistical analysis was 835.
4.1 Demographic characteristics of the sample
The structure of the survey sample is divided and statistically analyzed according to criteria such as gender, age, occupation, education level and personal income. (Detailed statistical table in Appendix 6)
- Gender structure: Of the 835 completed questionnaires, 49.8% of respondents were male, equivalent to 416 people, and 50.2% were female, equivalent to 419 people. The survey results of the study are completely consistent with the gender ratio in the population structure of Vietnam in general and Hanoi in particular (Male/Female: 49/51).
- Age structure: 36.6% of respondents are <23 years old, equivalent to 306 people. People from 23-34 years old
accounting for the highest proportion: 44.8% equivalent to 374 people, people aged 35-45 and >45 are 70 and 85 people equivalent to 8.4% and 10.2% respectively. Looking at the results of this survey, we can see that the young people - youth account for a large proportion of the total number of people participating in the survey. Meanwhile, the middle-aged people including two age groups of 35 - 45 and >45 have a low rate of participation in the survey. This is completely consistent with the reality when Mobile Marketing is identified as a Marketing service aimed at young people (people under 35 years old).
- Structure by educational level: among 835 valid responses, 541 respondents had university degrees, accounting for the highest proportion of ~ 75%, 102 had secondary school degrees, ~ 13.1%, and 93 had post-graduate degrees, ~ 11.9%.
- Occupational structure: office workers and civil servants are the group with the highest rate of participation with 39.4%, followed by students with 36.6%. Self-employed people account for 12%, retired housewives are 7.8% and other occupational groups account for 4.2%. The survey results show that the student group has the same rate as the group aged <23 at 36.6%. This shows the accuracy of the survey data. In addition, the survey results distributed by occupational criteria have a rate almost similar to the sample division rate in chapter 3. Therefore, it can be concluded that the survey data is suitable for use in analysis activities.
- Income structure: the group with income from 3 to 5 million has the highest rate with 39% of the total number of respondents. This is consistent with the income structure of Hanoi people and corresponds to the average income of the group of civil servants and office workers. Those
People with no income account for 23%, income under 3 million VND accounts for 13% and income over 5 million VND accounts for 25%.
4.2 Mobile phone usage in Hanoi inner city area
According to the survey results, most respondents said they had used the phone for more than 1 year, specifically: 68.4% used mobile phones from 4 to 10 years, 23.2% used from 1 to 3 years, 7.8% used for more than 10 years. Those who used mobile phones for less than 1 year accounted for only a very small proportion of ~ 0.6%. (Table 4.1)
Table 4.1: Time spent using mobile phones
Frequency
Ratio (%)
Valid Percentage
Cumulative Percentage
Alid
<1 year
5
.6
.6
.6
1-3 years
194
23.2
23.2
23.8
4-10 years
571
68.4
68.4
92.2
>10 years
65
7.8
7.8
100.0
Total
835
100.0
100.0
The survey indexes on the time of using mobile phones of consumers in the inner city of Hanoi are very impressive for a developing country like Vietnam and also prove that Vietnamese consumers have a lot of experience using this high-tech device. Moreover, with the majority of consumers surveyed having a relatively long time of use (4-10 years), it partly proves that mobile phones have become an important and essential item in people's daily lives.
When asked about the mobile phone network they are using, 31% of respondents said they are using the network of Vietel company, 29% use the network of
of Mobifone company, 27% use Vinaphone company's network and 13% use networks of other providers such as E-VN telecom, S-fone, Beeline, Vietnammobile. (Figure 4.1).
Figure 4.1: Mobile phone network in use
Compared with the announced market share of mobile telecommunications service providers in Vietnam (Vietel: 36%, Mobifone: 29%, Vinaphone: 28%, the remaining networks: 7%), we see that the survey results do not have many differences. However, the statistics show that there is a difference in the market share of other networks because the Hanoi market is one of the two main markets of small networks, so their market share in this area will certainly be higher than that of the whole country.
According to a report by NielsenMobile (2009) [8], the number of prepaid mobile phone subscribers in Hanoi accounts for 95% of the total number of subscribers, however, the results of this survey show that the percentage of prepaid subscribers has decreased by more than 20%, only at 70.8%. On the contrary, the number of postpaid subscribers tends to increase from 5% in 2009 to 19.2%. Those who are simultaneously using both types of subscriptions account for 10%. (Table 4.2).
Table 4.2: Types of mobile phone subscribers
Frequency
Ratio (%)
Valid Percentage
Cumulative Percentage
Valid
Prepay
591
70.8
70.8
70.8
Pay later
160
19.2
19.2
89.9
Both of the above
84
10.1
10.1
100.0
Total
835
100.0
100.0
The above figures show the change in the psychology and consumption habits of Vietnamese consumers towards mobile telecommunications services, when the use of prepaid subscriptions and junk SIMs is replaced by the use of two types of subscriptions for different purposes and needs or switching to postpaid subscriptions to enjoy better customer care services.
In addition, the majority of respondents have an average spending level for mobile phone services from 100 to 300 thousand VND (406 ~ 48.6% of total respondents). The high spending level (> 500 thousand VND) is the spending level with the lowest number of people with only 8.4%, on the contrary, the low spending level (under 100 thousand VND) accounts for the second highest proportion among the groups of respondents with 25.4%. People with low spending levels mainly fall into the group of students and retirees/housewives - those who have little need to use or mainly use promotional SIM cards. (Table 4.3).
Table 4.3: Spending on mobile phone charges
Frequency
Ratio (%)
Valid Percentage
Cumulative Percentage
Valid
<100,000
212
25.4
25.4
25.4
100-300,000
406
48.6
48.6
74.0
300,000-500,000
147
17.6
17.6
91.6
>500,000
70
8.4
8.4
100.0
Total
835
100.0
100.0
The statistics in Table 4.3 are similar to the percentages in the NielsenMobile survey results (2009) with 73% of mobile phone users having medium spending levels and only 13% having high spending levels.
The survey results also showed that up to 31% ~ nearly one-third of respondents said they sent more than 10 SMS messages/day, meaning that on average they sent 1 SMS message for every working hour. Those with an average SMS message volume (from 3 to 10 messages/day) accounted for 51.1% and those with a low SMS message volume (less than 3 messages/day) accounted for 17%. (Table 4.4)
Table 4.4: Number of SMS messages sent per day
Frequency
Ratio (%)
Valid Percentage
Cumulative Percentage
Valid
<3 news
142
17.0
17.0
17.0
3-10 news
427
51.1
51.1
68.1
>10 news
266
31.9
31.9
100.0
Total
835
100.0
100.0
Similar to sending messages, those with an average message receiving rate (from 3-10 messages/day) accounted for the highest percentage of ~ 55%, followed by those with a high number of messages (over 10 messages/day) ~ 24% and those with a low number of messages received daily (under 3 messages/day) remained at the bottom with 21%. (Table 4.5)
Table 4.5: Number of SMS messages received per day
Frequency
Ratio (%)
Valid Percentage
Cumulative Percentage
Valid
<3 news
175
21.0
21.0
21.0
3-10 news
436
55.0
55.0
76.0
>10 news
197
24.0
24.0
100.0
Total
835
100.0
100.0
When comparing the data of the two result tables 4.4 and 4.5, we can see the reasonableness between the ratio of the number of messages sent and the number of messages received daily by the interview participants.
4.3 Current status of SMS advertising and Mobile Marketing
According to the interview results, in the 3 months from the time of the survey and before, 94% of respondents, equivalent to 785 people, said they received advertising messages, while only a very small percentage of 6% (only 50 people) did not receive advertising messages (Table 4.6).
Table 4.6: Percentage of people receiving advertising messages in the last 3 months
Frequency
Ratio (%)
Valid Percentage
Cumulative Percentage
Valid
Have
785
94.0
94.0
94.0
Are not
50
6.0
6.0
100.0
Total
835
100.0
100.0
The results of Table 4.6 show that consumers in the inner city of Hanoi are very familiar with advertising messages. This result is also the basis for assessing the knowledge, experience and understanding of the respondents in the interview. This is also one of the important factors determining the accuracy of the survey results.
In addition, most respondents said they had received promotional messages, but only 24% of them had ever taken the action of registering to receive promotional messages, while 76% of the remaining respondents did not register to receive promotional messages but still received promotional messages every day. This is the first sign indicating the weaknesses and shortcomings of lax management of this activity in Vietnam. (Table 4.7)
div.maincontent .s1 { color: black; font-family:"Times New Roman", serif; font-style: italic; font-weight: normal; text-decoration: none; font-size: 14pt; } div.maincontent .s2 { color: black; font-family:"Times New Roman", serif; font-style: normal; font-weight: bold; text-decoration: none; font-size: 14pt; } div.maincontent .s3 { color: black; font-family:"Times New Roman", serif; font-style: normal; font-weight: bold; text-decoration: none; font-size: 14pt; } div.maincontent .p { color: black; font-family:"Times New Roman", serif; font-style: normal; font-weight: normal; text-decoration: none; font-size: 14pt; margin:0pt; } div.maincontent p { color: black; font-family:"Times New Roman", serif; font-style: normal; font-weight: normal; text-decoration: none; font-size: 14pt; margin:0pt; } div.maincontent .s4 { color: black; font-family:"Times New Roman", serif; font-style: normal; font-weight: normal; text-decoration: none; font-size: 9.5pt; vertical-align: 6pt; } div.maincontent .s5 { color: black; font-family:"Times New Roman", serif; font-style: normal; font-weight: bold; text-decoration: none; font-size: 14pt; } div.maincontent .s6 { color: black; font-family:"Times New Roman", serif; font-style: normal; font-weight: bold; text-decoration: none; font-size: 14pt; } div.maincontent .s7 { color: black; font-family:"Times New Roman", serif; font-style: italic; font-weight: normal; text-decoration: none; font-size: 14pt; } div.maincontent .s8 { color: black; font-family:"Times New Roman", serif; font-style: italic; font-weight: bold; text-decoration: none; font-size: 14pt; } div.maincontent .s9 { color: black; font-family:Arial, sans-serif; font-style: normal; font-weight: normal; text-decoration: none; font-size: 14pt; } div.maincontent .s10 { color: black; font-family:Arial, sans-serif; font-style: normal; font-weight: normal; text-decoration: none; font-size: 12pt; } div.maincontent .s11 { color: black; font-family:"Times New Roman", serif; font-style: normal; font-weight: normal; font-size: 14pt; } div.maincontent .s12 { color: black; font-family:Arial, sans-serif; font-style: normal; font-weight: normal; text-decoration: none; font-size: 14pt; } div.maincontent .s13 { color: black; font-family:"Times New Roman", serif; font-style: normal; font-weight: normal; text-decoration: none; font-size: 14pt; } div.maincontent .s14 { color: black; font-family:"Times New Roman", serif; font-style: normal; font-weight: bold; text-decoration: none; font-size: 13pt; } div.maincontent .s15 { color: black; font-family:"Times New Roman", serif; font-style: italic; font-weight: normal; text-decoration: none; font-size: 9.5pt; vertical-align: 6pt; } div.maincontent .s16 { color: black; font-family:"Times New Roman", serif; font-style: normal; font-weight: normal; text-decoration: none; font-size: 5.5pt; vertical-align: 3pt; } div.maincontent .s17 { color: black; font-family:"Times New Roman", serif; font-style: normal; font-weight: normal; text-decoration: none; font-size: 8.5pt; } div.maincontent .s18 { color: black; font-family:"Times New Roman", serif; font-style: italic; font-weight: bold; font-size: 14pt; } div.maincontent .s19 { color: black; font-family:"Times New Roman", serif; font-style: normal; font-weight: bold; font-size: 14pt; } div.maincontent .s20 { color: black; font-family:"Times New Roman", serif; font-style: italic; font-weight: normal; text-decoration: none; font-size: 13pt; } div.maincontent .s21 { color: black; font-family:"Times New Roman", serif; font-style: normal; font-weight: normal; text-decoration: none; font-size: 14pt; } div.maincontent .s22 { color: black; font-family:"Courier New", monospace; font-style: normal; font-weight: normal; text-decoration: none; font-size: 14pt; } div.maincontent .s23 { color: black; font-family:"Times New Roman", serif; font-style: normal; font-weight: normal; text-decoration: none; font-size: 13pt; } div.maincontent .s24 { color: black; font-family:"Times New Roman", serif; font-style: italic; font-weight: normal; text-decoration: none; font-size: 13pt; } div.maincontent .s25 { color: black; font-family:"Times New Roman", serif; font-style: normal; font-weight: bold; text-decoration: none; font-size: 14pt; } div.maincontent .s26 { color: black; font-family:"Times New Roman", serif; font-style: normal; font-weight: normal; text-decoration: none; font-size: 14pt; } div.maincontent .s27 { color: black; font-family:"Times New Roman", serif; font-style: normal; font-weight: normal; text-decoration: none; font-size: 1.5pt; } div.maincontent .s28 { color: black; font-family:"Times New Roman", serif; font-style: normal; font-weight: normal; text-decoration: none; font-size: 11pt; } div.maincontent .s29 { color: black; font-family:"Times New Roman", serif; font-style: normal; font-weight: bold; text-decoration: none; font-size: 13pt; } div.maincontent .s30 { color: black; font-family:"Times New Roman", serif; font-style: italic; font-weight: bold; text-decoration: none; font-size: 13pt; } div.maincontent .s31 { color: black; font-family:"Times New Roman", serif; font-style: normal; font-weight: normal; text-decoration: none; font-size: 13pt; } div.maincontent .s32 { color: black; font-family:Arial, sans-serif; font-style: normal; font-weight: normal; text-decoration: none; font-size: 10.5pt; } div.maincontent .s33 { color: black; font-family:Arial, sans-serif; font-style: normal; font-weight: normal; text-decoration: none; font-size: 11pt; } div.maincontent .s35 { color: black; font-family:Arial, sans-serif; font-style: normal; font-weight: bold; text-decoration: none; font-size: 10.5pt; } div.maincontent .s36 { color: #F00; font-family:Arial, sans-serif; font-style: italic; font-weight: bold; text-decoration: none; font-size: 10.5pt; } div.maincontent .s37 { color: black; font-family:Arial, sans-serif; font-style: normal; font-weight: bold; text-decoration: none; font-size: 10.5pt; } div.maincontent .s38 { color: black; font-family:"Times New Roman", serif; font-style: normal; font-weight: bold; text-decoration: none; font-size: 8.5pt; vertical-align: 5pt; } div.maincontent .s39 { color: black; font-family:Arial, sans-serif; font-style: normal; font-weight: normal; text-decoration: none; font-size: 10.5pt; } div.maincontent .s40 { color: black; font-family:Arial, sans-serif; font-style: normal; font-weight: normal; text-decoration: none; font-size: 7pt; vertical-align: 4pt; } div.maincontent .s41 { color: black; font-family:Arial, sans-serif; font-style: normal; font-weight: bold; text-decoration: none; font-size: 10.5pt; } div.maincontent .s42 { color: black; font-family:Arial, sans-serif; font-style: normal; font-weight: bold; text-decoration: none; font-size: 11pt; } div.maincontent .s43 { color: black; font-family:Arial, sans-serif; font-style: normal; font-weight: bold; text-decoration: none; font-size: 7.5pt; vertical-align: 5pt; } div.maincontent .s44 { color: black; font-family:Arial, sans-serif; font-style: normal; font-weight: normal; text-decoration: none; font-size: 7pt; vertical-align: 5pt; } div.maincontent .s45 { color: #F00; font-family:Arial, sans-serif; font-style: normal; font-weight: bold; text-decoration: none; font-size: 10.5pt; } div.maincontent .s46 { color: black; font-family:Arial, sans-serif; font-style: normal; font-weight: bold; text-decoration: none; font-size: 7pt; vertical-align: 5pt; } div.maincontent .s47 { color: black; font-family:Arial, sans-serif; font-style: normal; font-weight: bold; text-decoration: none; font-size: 11pt; } div.maincontent .s48 { color: black; font-family:"Times New Roman", serif; font-style: normal; font-weight: normal; text-decoration: none; font-size: 14pt; } div.maincontent .s49 { color: black; font-family:"Times New Roman", serif; font-style: italic; font-weight: normal; text-decoration: none; font-size: 9.5pt; vertical-align: -2pt; } div.maincontent .s50 { color: black; font-family:"Times New Roman", serif; font-style: normal; font-weight: normal; text-decoration: none; font-size: 9.5pt; } div.maincontent .s51 { color: black; font-family:"Times New Roman", serif; font-style: italic; font-weight: normal; text-decoration: none; font-size: 9.5pt; vertical-align: -1pt; } div.maincontent .s52 { color: black; font-family:"Times New Roman", serif; font-style: normal; font-weight: normal; text-decoration: none; font-size: 9.5pt; vertical-align: -2pt; } div.maincontent .s53 { color: black; font-family:"Times New Roman", serif; font-style: normal; font-weight: normal; text-decoration: none; font-size: 13pt; } div.maincontent .s54 { color: black; font-family:"Times New Roman", serif; font-style: normal; font-weight: normal; text-decoration: none; font-size: 9.5pt; vertical-align: -1pt; } div.maincontent .s55 { color: black; font-family:Arial, sans-serif; font-style: normal; font-weight: normal; text-decoration: none; font-size: 10.5pt; } div.maincontent .s56 { color: #00F; font-family:"Times New Roman", serif; font-style: normal; font-weight: normal; font-size: 14pt; } div.maincontent .s57 { color: #00F; font-family:"Times New Roman", serif; font-style: normal; font-weight: normal; text-decoration: none; font-size: 14pt; } div.maincontent .s58 { color: #00F; font-family:"Times New Roman", serif; font-style: normal; font-weight: normal; font-size: 14pt; } div.maincontent .s59 { color: #00F; font-family:"Times New Roman", serif; font-style: normal; font-weight: normal; text-decoration: none; font-size: 13pt; } div.maincontent .s60 { color: #00F; font-family:"Times New Roman", serif; font-style: normal; font-weight: normal; font-size: 13pt; } div.maincontent .s61 { color: black; font-family:"Times New Roman", serif; font-style: normal; font-weight: bold; text-decoration: none; font-size: 14pt; } div.maincontent .s62 { color: black; font-family:"Times New Roman", serif; font-style: italic; font-weight: bold; text-decoration: none; font-size: 14pt; } div.maincontent .s63 { color: black; font-family:"Times New Roman", serif; font-style: italic; font-weight: bold; text-decoration: none; font-size: 14pt; } div.maincontent .content_head2 { color: #F00; font-family:"Times New Roman", serif; font-style: normal; font-weight: bold; text-decoration: none; font-size: 14pt; } div.maincontent .s64 { color: black; font-family:"Times New Roman", serif; font-style: italic; font-weight: bold; text-decoration: none; font-size: 13pt; } div.maincontent .s67 { color: black; font-family:Arial, sans-serif; font-style: normal; font-weight: normal; text-decoration: none; font-size: 9.5pt; } div.maincontent .s68 { color: black; font-family:"Times New Roman", serif; font-style: normal; font-weight: bold; text-decoration: none; font-size: 12pt; } div.maincontent .s69 { color: black; font-family:"Times New Roman", serif; font-style: italic; font-weight: normal; text-decoration: none; font-size: 12pt; } div.maincontent .s70 { color: black; font-family:"Times New Roman", serif; font-style: normal; font-weight: normal; tex -
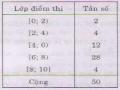 The Average Scores of Grade 10A Students in Semester 1 Are Recorded in the Following Table:
 -
 General Organic Chemistry - Hanoi University of Agriculture - 12
 -
 Average Proportion of Enterprises by Size in the Period 2000-2009 (Source: General Statistics Office)
 -
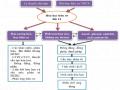 Analysis of Organic Chemistry Program Grade 11


group discussion
Figure 3.3. Students of Hiep Hoa High School No. 2, Bac Giang present results.Figure 3.4. Students of Yen Dung High School No. 2, Bac Giang present their products. project product to learn about alkanes |


Khac Khoan, Hanoi presents project products on alcohol
Figure 3.5. Students of Phung High SchoolFigure 3.6. Students of Kon High School Tum, Kon Tum presents project products on learning about carboxylic acids |
3.5.2.2. Quantitative results
a. Results from teacher assessment
The assessment was conducted at pre-impact (TTD) and post-impact (STD) times using the NLTH assessment form according to the teacher's criteria (section 2.3.1), specifically: measure 1 (at 4 times: pre-impact, after KHBD K1, after KHBD K3 and after KHBD K5) and measure 2 (at 4 times: pre-impact, after KHBD K6, after KHBD K7 and after KHBD K8).
For measure 1:
- At the time of the assessment, the teacher observes the activities and analyzes the learning outcomes of the students, especially the achievements of each student, and collects information through the assessment student survey form and the assessment test, thereby evaluating the 10 credits of the assessment.
- At the STĐ times, teachers observe students' learning activities and collect information through individual KWL diagrams (TC1, TC2, TC9, TC10), lesson plans (TC3, TC4), content of students' notebooks, results of answering/performing exercises/practical tasks of the lesson (TC5, TC6, TC8), results of collaboration in class, diary of students' exchanges on Teams to request support or support other classmates (TC7), results of post-impact tests (TC1, TC2, TC5, TC6, TC8). From there, teachers evaluate and give scores corresponding to 10 credits of NLTH.
Same for measure 2:
- At the time of the assessment, the teacher observes the activities and analyzes the learning outcomes of the students, especially the achievements of each student, and collects information through the assessment student survey form and the assessment test, thereby evaluating the 10 credits of the assessment.
- At the STĐ times, teachers observe students' learning activities and collect information through individual KWL diagrams (TC1, TC2, TC9, TC10), individual plans based on the group's general project implementation plan and adjustments (TC3, TC4), results of individual tasks and group project product evaluation results (TC5, TC6, TC8), group exchange logs on Teams, results of group project implementation process evaluation and contributions of group members (TC7), peer assessment results of project products (TC9) and post-impact test results (TC1, TC2, TC3, TC4, TC5, TC6, TC8, TC9, TC10). From there, teachers determine the achieved score corresponding to 10 criteria for assessing students' learning ability.
We used the Cronbach's Alpha coefficient calculation method on SPSS 20 software to evaluate the reliability of the scale. The results (in Appendix 8.11) show that the scale of 10 criteria for assessing students' learning ability through 2 impact measures has good reliability, all criteria have a corrected item-total correlation coefficient ≥ 0.30, meeting the requirements (Nunnally & Bernstein, 1994) and no criteria reduce the reliability of the results; the scale has a Cronbach's Alpha coefficient ≥ 0.60, so it is statistically acceptable and allows use to assess students' learning ability at each point in time.
 Results for measure 1
We conducted descriptive statistics on the average score assessed by each NLTH criterion (from TC1-TC10) and the overall average score assessing all 10 criteria of 210 students in round 1 and 262 students in round 2. The results are presented in the tables and figures below:
Table 3.6. Statistics of average scores assessing each criterion of NLTH in students through assessment times with measure 1 (round 1)
Evaluation criteria
Average score of NLTH over time | TBK5- TTĐ | T-test (sig.) K5-TTD | ||||||||
TTĐ | K1 | K3 | K5 | |||||||
TB | Deviation standard | TB | Deviation standard | TB | Deviation standard | TB | Deviation standard | |||
1 | 1.86 | 0.63 | 2.15 | 0.56 | 2.54 | 0.51 | 2.59 | 0.49 | 0.74 | 0.000 |
2 | 1.61 | 0.54 | 1.83 | 0.52 | 2.18 | 0.49 | 2.31 | 0.47 | 0.71 | 0.000 |
3 | 1.64 | 0.54 | 1.86 | 0.52 | 2.30 | 0.51 | 2.40 | 0.49 | 0.76 | 0.000 |
4 | 1.48 | 0.52 | 1.65 | 0.50 | 2.01 | 0.48 | 2.12 | 0.38 | 0.65 | 0.000 |
5 | 1.76 | 0.53 | 1.90 | 0.52 | 2.30 | 0.49 | 2.42 | 0.49 | 0.66 | 0.000 |
6 | 1.55 | 0.51 | 1.74 | 0.48 | 2.09 | 0.46 | 2.20 | 0.42 | 0.65 | 0.000 |
7 | 1.75 | 0.56 | 1.97 | 0.52 | 2.31 | 0.52 | 2.53 | 0.50 | 0.78 | 0.000 |
8 | 1.73 | 0.50 | 1.91 | 0.49 | 2.12 | 0.48 | 2.29 | 0.46 | 0.57 | 0.000 |
9 | 1.67 | 0.49 | 1.82 | 0.42 | 2.09 | 0.40 | 2.19 | 0.39 | 0.52 | 0.000 |
10 | 1.65 | 0.48 | 1.78 | 0.41 | 2.04 | 0.39 | 2.10 | 0.31 | 0.45 | 0.000 |
TBC | 1.67 | 0.41 | 1.86 | 0.36 | 2.20 | 0.32 | 2.31 | 0.29 | 0.64 | 0.000 |
Table 3.7. Characteristic parameters for measure 1 (round 1)
Parameters
Round 1 results | ||||
TTĐ | K1 | K3 | K5 | |
TB | 1.67 | 1.86 | 2.20 | 2.31 |
Standard deviation | 0.41 | 0.36 | 0.32 | 0.29 |
Compare | K1 and TTĐ | K3 and K1 | K5 and K3 | K5 and TTĐ |
T-test (Sig.) | 0.000 | 0.000 | 0.000 | 0.000 |
ES (SMD) | 0.46 | 0.94 | 0.37 | 1.57 |
Small | Big | Small | Very large | |
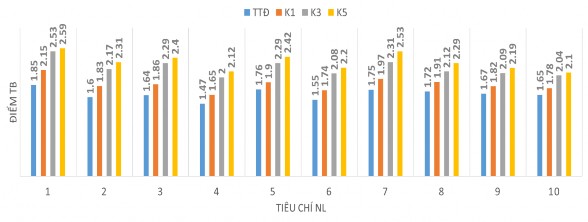
Figure 3.7. Development of students' NLTH through assessment times with measure 1 (round 1)
Table 3.8. Statistics of average scores assessing each criterion of NLTH in students through assessment times with measure 1 (round 2)
Evaluation criteria
Average score of NLTH over time | TBK5- TTĐ | T-test (sig.) K5-TTD | ||||||||
TTĐ | K1 | K3 | K5 | |||||||
TB | Deviation standard | TB | Deviation standard | TB | Deviation standard | TB | Deviation standard | |||
1 | 1.84 | 0.61 | 2.13 | 0.59 | 2.44 | 0.56 | 2.63 | 0.50 | 0.79 | 0.000 |
2 | 1.61 | 0.57 | 1.75 | 0.53 | 2.20 | 0.55 | 2.44 | 0.51 | 0.83 | 0.000 |
3 | 1.74 | 0.60 | 1.95 | 0.59 | 2.29 | 0.58 | 2.55 | 0.50 | 0.81 | 0.000 |
4 | 1.50 | 0.51 | 1.61 | 0.51 | 1.93 | 0.45 | 2.08 | 0.44 | 0.58 | 0.000 |
5 | 1.76 | 0.63 | 1.87 | 0.62 | 2.25 | 0.52 | 2.44 | 0.51 | 0.68 | 0.000 |
6
1.58 | 0.61 | 1.72 | 0.57 | 2.06 | 0.56 | 2.23 | 0.47 | 0.65 | 0.000 | |
7 | 1.81 | 0.55 | 2.05 | 0.53 | 2.36 | 0.51 | 2.56 | 0.50 | 0.75 | 0.000 |
8 | 1.82 | 0.54 | 1.96 | 0.51 | 2.19 | 0.49 | 2.33 | 0.47 | 0.51 | 0.000 |
9 | 1.74 | 0.46 | 1.91 | 0.45 | 2.10 | 0.42 | 2.22 | 0.42 | 0.48 | 0.000 |
10 | 1.59 | 0.49 | 1.72 | 0.47 | 1.99 | 0.39 | 2.16 | 0.39 | 0.57 | 0.000 |
TBC | 1.70 | 0.41 | 1.87 | 0.38 | 2.18 | 0.34 | 2.36 | 0.30 | 0.66 | 0.000 |
Table 3.9. Characteristic parameters for measure 1 (round 2)
Parameters
Round 2 results | ||||
TTĐ | K1 | K3 | K5 | |
Average score | 1.70 | 1.87 | 2.18 | 2.36 |
Standard deviation | 0.41 | 0.38 | 0.34 | 0.30 |
Compare | K1 and TTĐ | K3 and K1 | K5 and K3 | K5 and TTĐ |
T-test (Sig.) | 0.000 | 0.000 | 0.000 | 0.000 |
Image level enjoy ES | 0.41 | 0.82 | 0.54 | 1.62 |
Small | Big | Medium | Very large | |
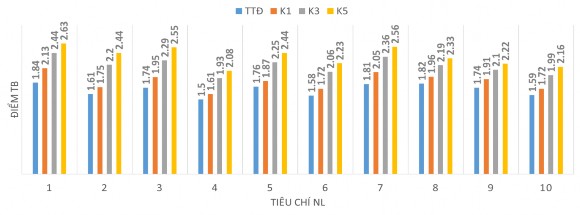
Figure 3.8. Development of students' NLTH through assessment times with measure 1 (round 2)
Comments: Through the data in tables 3.6, 3.7, 3.8, 3.9, it shows that the total average score of all criteria over the assessment times has increased (1.67; 1.86; 2.20; 2.31 in round 1), (1.70; 1.87; 2.18; 2.36 in round 2), the average score assessed with each criterion of NLTH also increased significantly (before the impact, it was all less than 2.0 but after the K5 KHBD, it was all greater than 2.0), proving that the NLTH of students has developed quite evenly. The standard deviation at each assessment time and according to each criterion gradually decreased, proving that the number of
The data collected is less scattered and more reliable. In particular, the criteria with large fluctuations are TC1 (determining learning objectives and content) increased by 0.74 in round 1; 0.79 in round 2, TC2 (determining relevant known things) increased by 0.71 in round 1; 0.83 in round 2, TC3 (determining means and methods of performing learning tasks) increased by 0.76 in round 1; 0.81 in round 2, TC7 (cooperation with teachers and classmates) increased by 0.78 in round 1; 0.75 in round 2 shows that there is a strong development of these criteria through measure 1, the reason is that when studying according to the flipped classroom model, students often read and clearly perceive the lesson objectives, identify the learning tasks, evaluate before and after class about what they have achieved, actively cooperate in class and the online learning process at home.
Figures 3.7 and 3.8 clearly show the progress of students through each period of the TNSP. After the K1 KHBD, students' learning ability has developed but not strongly, the difference in average value is small (0.19 in round 1; 0.17 in round 2), the SMD values are 0.46; 0.41 respectively, also showing the small level of impact, the reason may be that students are not yet familiar with the new learning methods and online learning tools. However, after the K3 KHBD, students' learning ability has developed more strongly, the average value is larger than that of the K1 KHBD (0.34 in round 1; 0.31 in round 2), the SMD values are 0.94; 0.82 also shows a large level of influence, especially after KHBD K5, the average value increased sharply compared to the time of TTD (0.64 in round 1; 0.66 in round 2), SMD also increased by 1.57; 1.62 respectively (reflecting a very large level of influence). In addition, the parameter values p (sig.) in the dependent T-test are always less than 0.05, confirming that this development is not random but due to the impact of measure 1.
 Results for measure 2
Similar to measure 1, we conducted descriptive statistics on the assessment scores according to the NLTH criteria of students at the time points before the impact, after the K6 KHBD, after the K7 KHBD and after the K8 KHBD. The results are summarized and presented below:
Table 3.10. Statistics of average scores assessing each criterion of NLTH in students through assessment times with measure 2 (round 1)
Evaluation criteria
Average score of NLTH over time | TBK8- TTĐ | T-test (sig.) K8-TTD | |||||||
TTĐ | K6 | K7 | K8 | ||||||
TB | Degree | TB | Degree | TB | Degree | TB | Degree | ||
deviated standard | deviated standard | deviated standard | deviated standard | |||||||
1 | 1.87 | 0.54 | 2.17 | 0.53 | 2.54 | 0.51 | 2.62 | 0.49 | 0.75 | 0.000 |
2 | 1.66 | 0.53 | 1.86 | 0.51 | 2.06 | 0.47 | 2.20 | 0.42 | 0.54 | 0.000 |
3 | 1.75 | 0.57 | 2.00 | 0.53 | 2.36 | 0.52 | 2.47 | 0.51 | 0.72 | 0.000 |
4 | 1.55 | 0.53 | 1.81 | 0.51 | 2.08 | 0.47 | 2.25 | 0.46 | 0.70 | 0.000 |
5 | 1.88 | 0.56 | 2.28 | 0.54 | 2.50 | 0.51 | 2.65 | 0.49 | 0.77 | 0.000 |
6 | 1.63 | 0.52 | 1.84 | 0.50 | 2.14 | 0.49 | 2.23 | 0.45 | 0.60 | 0.000 |
7 | 1.80 | 0.54 | 2.04 | 0.53 | 2.43 | 0.51 | 2.56 | 0.50 | 0.76 | 0.000 |
8 | 1.75 | 0.55 | 2.00 | 0.53 | 2.43 | 0.51 | 2.50 | 0.50 | 0.75 | 0.000 |
9 | 1.71 | 0.49 | 1.89 | 0.46 | 2.10 | 0.45 | 2.24 | 0.44 | 0.53 | 0.000 |
10 | 1.64 | 0.50 | 1.85 | 0.44 | 2.02 | 0.41 | 2.12 | 0.35 | 0.48 | 0.000 |
TBC | 1.72 | 0.40 | 1.97 | 0.38 | 2.27 | 0.33 | 2.38 | 0.29 | 0.66 | 0.000 |
Table 3.11. Characteristic parameters for measure 2 (round 1)
Parameters
Round 1 results | ||||
TTĐ | K6 | K7 | K8 | |
TB | 1.72 | 1.97 | 2.27 | 2.38 |
Standard deviation | 0.40 | 0.38 | 0.33 | 0.29 |
Compare | K6 and TTĐ | K7 and K6 | K8 and K7 | K8 and TTĐ |
T-test (Sig.) | 0.000 | 0.000 | 0.000 | 0.000 |
ES (SMD) | 0.63 | 0.78 | 0.36 | 1.65 |
Medium | Medium | Small | Very large | |
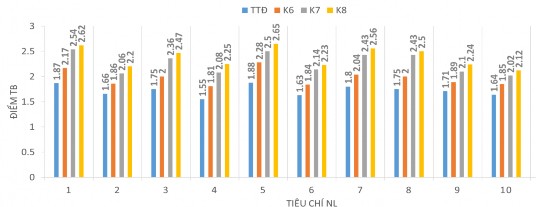
Figure 3.9. Development of students' NLTH through assessment times with measure 2 (round 1)