COMMITMENT
I hereby declare that this is my own research thesis. The results and data presented in this thesis are true and have never been published in any other works!
Da Nang, November 2021
Maybe you are interested!
-
 Research on semi-active suspension control for passenger car internal combustion engine - 13
 -
 Internal Combustion Engine Vibration Isolation System
 -
 Building Vinawind's Situation Analysis and Research Process
 -
 Some Limitations During the Research Implementation Process
 -
 Introduction. This chapter has introduced the necessity as well as the research objectives, scope and subjects of the research and the implementation process.
PhD student
Vo Anh Vu
INDEX
COMMITMENT i
TABLE OF CONTENTS ii
LIST OF FIGURES, GRAPHS v
LIST OF TABLES x
LIST OF SYMBOLS AND ABBREVIATIONS xi
INTRODUCTION 6
1. Urgency of the research topic
6
2. Research objectives 8
3. Research object and scope 8
4. Research methods 10
5. Structure of the thesis 10
6. New contributions of the thesis 10
CHAPTER 1: OVERVIEW 11
1.1. The necessity of using renewable energy [1] 11
1.2. Biofuels [66] 15
1.2.1. Generations of biofuels 15
1.2.2. Biogas 16
1.3. Biogas engine [1] 23
1.3.1. Spark ignition biogas engine converted from gasoline engine 23
1.3.2. Spark ignition biogas engine converted from diesel engine 25
1.4. Research and application situation of biogas engines in the world and Vietnam 28
1.4.1. Research projects on biogas engine applications in the world 28
1.4.2. Research projects on biogas engine development in Vietnam 31
1.5. Conclusion 36
CHAPTER 2: THEORETICAL BASIS OF THE MIXTURE CREATION PROCESS AND
COMBUSTION IN INTERNAL COMBUSTION ENGINES 31
2.1. Basic system of equations
31
2.1.1. General equations 31
2.1.2. Reynolds analysis 31
2.1.3. Favre 32-type average
2.1.4. Closure of the system of equations 33
2.2. Non-uniform combustion model 36
2.2.1. Non-uniform combustion models 36
2.2.2. Non-homogeneous combustion model through conserved quantities 38
2.3. Homogeneous mixture combustion model 42
2.3.1. Establishing the combustion equation system 42
2.3.2. Spread of fire membrane 47
2.4. Local homogeneous combustion model 51
2.5. Conclusion 53
CHAPTER 3: SIMULATION OF FUEL SUPPLY PROCESS AND COMBUSTION PROCESS IN HYBRID FUEL ENGINE
BIOGAS/GASOLINE 54
3.1. Simulation objectives and objects 54
3.2. Geometric model of the engine and simulation boundary conditions 56
3.3. Simulation results of biogas-gasoline hybrid fuel supply process 59
3.4. Simulation of combustion and pollution emissions of DA465QE Towner engine
Use of hybrid biogas-gasoline fuel 67
3.4.1. Effect of the equivalence factor 67
3.4.2. Comparison of engine performance when running on biogas/gasoline 72
3.4.3. Effect of gasoline content added to biogas 75
3.4.4. Effect of engine speed 81
3.4.5. Effect of ignition advance angle 83
3.5. Harmonization between Wi and NOx
88
3.6. Conclusion 90
CHAPTER 4: EXPERIMENTAL RESEARCH AND RESULTS EVALUATION
SIMULATION OF HYBRID BIOGAS-GASOLINE FUEL ENGINE92
4.1. Purpose and limitations of empirical research
92
4.2. Fuel system characteristics of DA465QE 92 engine
4.3. Design of hybrid biogas-gasoline supply system 94
4.3.1. Principle of continuous and intermittent gas supply 94
4.3.2. Biogas supply system for DA465QE 96 engine
4.4. Hybrid biogas-gasoline fuel supply system for DA465QE engine ..98
4.5. Structure of the vacuum valve assembly supplying biogas 99
4.6. Introduction to experimental system
99
4.6.1. Overview of engine power test bench 99
4.6.2. APA 204/08 100 power test bench
4.6.3. Fuel supply and consumption measuring device 733S 101
4.6.4. AVL 553 101 device
4.6.5. Air flow meter 102
4.6.6. Control computer 103
4.6.7. MGT 5 103 Emission Analyzer
4.7. Experimental study of hybrid biogas-gasoline fuel engine
104
4.7.1. Experimental system layout 104
4.7.2. Fuel preparation 105
4.7.3. Install the test engine on the 107 power test bench
4.7.4. Experimental mode 108
4.8. Experimental results and comparison with simulation results 109
4.8.1. Comparison of engine features 109
4.8.2. Comparison of emissions of pollutants given by simulation and experiment
................................................................ ................................................................ ...................115
4.9. Summary of factors affecting hybrid engine performance 119
4.10. Conclusion 120
CONCLUSION AND DEVELOPMENT DIRECTION 122
LIST OF SCIENTIFIC WORKS 125
REFERENCES 127
APPENDIX i
LIST OF FIGURES AND GRAPHICS
Figure 1.1: Energy sources 11
Figure 1.2: Relative distance between Earth and other planets (a) and solar radiation in Vietnam (b) 12
Figure 1.3: Carbon cycle on Earth 14
Figure 1.4: Carbon cycle when using biogas as fuel 17
Figure 1.5: Kinetics of biogas production process [1] 17
Figure 1.6: Biogas production capacity of some raw materials [1] 18
Figure 1.7: Requirements for filtering impurities in biogas with different power generation solutions [1] 20
Figure 1.8: Biogas supply kit for spark ignition engine 32
Figure 1.9: Biogas supply kit for dual fuel biogas-diesel engine 32
................................................................ ................................................................ ................................42
Figure 2.1: Relationship between concentration, temperature and density according to the mixture ratio 42
Figure 2.2: Fire spread diagram according to the two-zone model 44
Figure 3.1: Survey cross-sections on the intake line 56
Figure 3.2: Computational space meshing and element characteristics 57
Figure 3.3: Screenshot of the evolution of parameters in engine cylinder 58
Figure 3.4: Variation of pressure contour, CH4 and C8H18 concentrations during the charging process (n=3000 rpm, biogas M7C3, fuel injection angle 30-60, biogas injection angle 60- 110) 59
Figure 3.5: Pressure variation on the cross sections of the intake manifold when the engine runs at 2000 rpm (a) and 5000 rpm (b) (BG=0, no fuel injection).60 Figure 3.6: Pressure variation on the cross sections of the intake manifold when the engine runs at 2000 rpm (a) and 5000 rpm (b) (BG=30, no fuel injection)
................................................................ ................................................................ ................................61
Figure 3.7: Effect of engine speed on pressure variation at cross section number 3 when throttle valve is fully open (a) and BG=30 (b) 61
Figure 3.8: Variation of average pressure at cross-section number 3 (a) and variation of equivalent coefficient in cylinder (b) according to engine speed corresponding to different throttle valve closing angles (providing biogas M7C3 with fixed injection angle 50TK, no fuel injection)
................................................................ ................................................................ ................................62
Figure 3.9: Contour line of equivalent coefficient when supplying biogas M7C3 and injecting additional gasoline (engine running at 3000 rpm, BG=0, gasoline injection angle 30TK
-60TK, biogas injection angle 60TK -110TK) 63
Figure 3.10: Effect of throttle closing angle BG on variation of equivalent coefficient
according to average pressure at cross section number 3 (Biogas M7C3, injection angle 50TK, no fuel injection) 64
Figure 3.11: Effect of additional fuel injection angle on the variation of the general equivalence coefficient in the combustion chamber when the engine runs at 3000 rpm, BG=30, supplied with biogas M7C32 with injection angle 50TK 65
Figure 3.12: Comparison of the variation of the equivalent coefficient according to engine speed when the throttle is fully open in the case where the engine is only supplied with biogas M7C3, the injector opening angle is 50TK and in the case of additional gasoline injection with a flow rate of 0.5g/s, injection angle is 60TK, at full load mode 65
Figure 3.13: Variation of additional fuel injection time to ensure =1 according to engine speed (a) and according to average pressure at cross section number 3 (b) corresponding to different throttle valve closing degrees (Biogas M8C2, biogas injector opening angle 50TK, fuel injection flow 0.5g/s) 66
Figure 3.14: Engine map of a biogas-gasoline engine fueled by hybrid method 66
Figure 3.15: Effect of equivalence coefficient on pressure variation and heat release rate (fuel M6C4-20G, n=3000 rpm, BG=0) 68
Figure 3.16: Effect of equivalence coefficient on pressure variation in the combustion chamber, biogas fuel M6C4 supplemented with 20% gasoline (M6C4-20G), running at 3000 rpm. 68
................................................................ ................................................................ ................................69
Figure 3.17: Effect of equivalence coefficient on work graph; biogas fuel M6C4 supplemented with 20% gasoline (M6C4-20G), running at 3000 rpm, BG=0 69
Figure 3.18: Variation of combustion temperature when changing the equivalent coefficient at Biogas M6C4 supplemented with 20% gasoline (M6C4-20G), running at 3000 rpm, BG=0 69
Figure 3.19: Effect of equivalence coefficient on NOx concentration when the engine runs on biogas M6C4 supplemented with 20% gasoline (M6C4-20G), running at 3000 rpm, BG=0 70
Figure 3.20: Effect of equivalence coefficient on CO concentration (a) and HC concentration
(b) according to the crankshaft rotation angle at biogas M6C4 supplemented with 20% gasoline (M6C4-20G), running at 3000 rpm. 70
Figure 3.21: Temperature variation and pollution emissions (a), variation of cycle indicator work and engine power (b) according to the equivalent coefficient (fuel M6C4-20G, n=3000 rpm, s=20oTK, BG=0) 71
Figure 3.22: Pressure variation in the cylinder (a) and work graph (b) when the engine runs on gasoline, methane, gasoline-methane mixture and biogas (n=3000 rpm, =1,
s=20oTK, BG=0) 72
Figure 3.23: Comparison of cycle indicator work and engine power when running on different fuels 73
Figure 3.24: Effect of fuel on temperature variation (a), NOx concentration (b), CO concentration (c) and HC concentration (d) according to crankshaft angle 74
Figure 3.25: Comparison of pollution emissions when the engine runs on different fuels at 3000 rpm, equivalence coefficient =1, ignition advance angle s=20oTK, BG=0 75
Figure 3.26: Effect of gasoline content added to biogas M6C4 on cycle indicator work (b), temperature (a) when the engine runs at 3000 rpm, equivalent coefficient =1, BG=0 76
Figure 3.27: Effect of gasoline content added to biogas M6C4 on pressure variation at engine running at 3000 rpm, equivalent coefficient =1, BG=0. 76 Figure 3.28: Effect of gasoline content on variation of heat release rate and pressure in cylinder according to crankshaft rotation angle 77
Figure 3.29: Effect of gasoline content added to biogas M6C4 on NOx concentration when the engine runs at 3000 rpm, equivalent coefficient =1, BG=0 77
Figure 3.30: Effect of gasoline content added to biogas fuel M6C4 on CO concentration (a) and HC concentration (b) according to crankshaft angle (when the engine runs at 3000 rpm, equivalent coefficient =1, BG=0 78
Figure 3.31: Effect of gasoline content added to biogas M7C3 on cycle indicator work (a), temperature (b) when the engine runs at speed n=3000 rpm, =1, BG=0 .79 Figure 3.32: Effect of gasoline content added to biogas M7C3 fuel on the variation of NOx concentration (a), HC (b) and CO (c) according to crankshaft angle (when the engine runs at speed 3000 rpm, equivalent coefficient =1, BG=0 80
Figure 3.33: Variation of cycle indicator work (b), (a) temperature and concentration of pollutants according to gasoline content in biogas M7C3, BG=0 81
Figure 3.34: Effect of engine speed on engine performance and pollution emissions (M7C3-30G, =1, s=25oTK, BG=0) 82
Figure 3.35: Variation of cycle indicator work (a), temperature and pollutant concentration (b) according to engine speed (M7C3-30G, =1, s=25oTK) 83
Figure 3.36: Effect of ignition advance angle on pressure variation (a), heat release rate (b), temperature (c), NOx (d), CO (c) and HC (f) when the engine runs on M8C2-20G fuel at 3000 rpm, BG=0 84
Figure 3.37: Variation of cycle indicator work and engine power (a), variation of pollutant concentration according to ignition advance angle (fuel M8C2-20G, =1, n=3000 rpm, BG=0) 85
Figure 3.38: Effect of ignition advance angle on the combustion process of fuel mixture M7C3-30G according to crankshaft rotation angle at engine speed 5000 rpm, =1 BG=0 86
Figure 3.39: Variation of cycle indicator work and engine power (a); variation of pollutant emissions (b) according to the ignition advance angle (M7C3-30G,=1, n=5000 rpm, BG=0)
................................................................ ................................................................ ................................87
Figure 3.40: Effect of biogas composition on the relationship between Wi and NOx concentration when the ignition advance angle changes from 20TK to 40TK (biogas fuel-30% gasoline, n=5000 rpm, =1, BG=0) 88
Figure 3.41: Effect of engine speed on the variation of Wi and NOx according to s when the engine runs on M7C3-30G fuel (a) and when running on M7C3 biogas (b) ( = 1, full load) 89
Figure 3.42: Variation of p and NOx with engine speed when s is fixed and when s is optimal (M7C3-30G, = 1, 60% load) 90
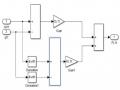
Figure 4.1: Schematic diagram of the operating principle of the DA465QE engine fuel system ...93 Figure 4.2: Block diagram of the electronic fuel injection system 94
Figure 4.3: Diagram of intermittent gas supply valve (a) and continuous gas supply valve (b) 95
Figure 4.4: Average pressure variation at the surveyed cross-sections when biogas is supplied continuously (a) and when biogas is supplied intermittently (b) 95
Figure 4.5: Diagram of biogas supply system with 2 vacuum valves 96
Figure 4.6: Diagram of hybrid biogas-gasoline fuel supply system 98