Unit: Billion VND
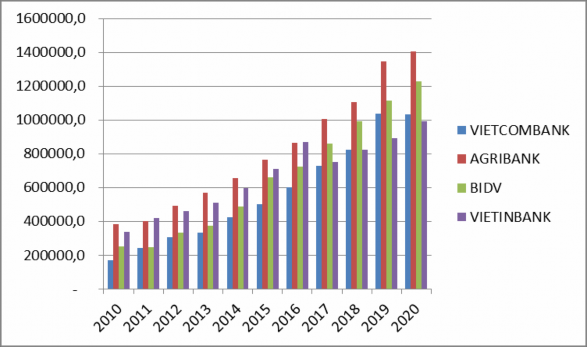
Chart 3.6. Capital mobilization of some commercial banks over the years 2010-2020
Source: Annual reports of credit institutions from 2010-2020
In 2020, Vietcombank's capital mobilization growth rate reached
1,053,354 billion VND, ranking 3rd in scale among the 4 banks above. Leading in capital mobilization scale is Agribank with a value of about 1.4 million billion VND. BIDV ranked 2nd with a value of more than 1.2 million billion VND and Vietinbank ranked 4th with a mobilization scale of 990 million billion VND.
+ Outstanding loans
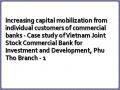
Vietcombank's outstanding loans grew at an average rate of 17% per year for 10 consecutive years from 2010 to 2020. With this rate, Vietcombank ranked 2nd among the 4 banks above. BIDV ranked first with an average outstanding loan growth rate of 17.1% per year, followed by Vietcombank, Agribank and Vietinbank.
In terms of scale, BIDV ranked first with outstanding loan scale in 2020 reaching
1,214,295 billion VND, followed by Agribank, Vietinbank and Vietcombank respectively. In 2020, Vietcombank's total outstanding debt reached 845,128 billion VND, ranking 4th out of the 4 banks above.
Table 3.5. Outstanding loans of some commercial banks over the years 2014 - 2020
Year
Vietcombank | AGRIBANK | BIDV | VIETINBANK | |||||
Amount (billion VND) | Growth (%) | Amount (billion VND) | Growth (%) | Amount (billion VND) | Growth (%) | Amount (billion VND) | Growth (%) | |
2010 | 176,813 | 443,877 | 254,192 | 591,110 | ||||
2011 | 209,417 | 18.4 | 480,453 | 8.2 | 293,937 | 15.6 | 706,876 | 19.6 |
2012 | 241,167 | 15.2 | 489,383 | 1.9 | 339,924 | 15.6 | 837,180 | 18.4 |
2013 | 278,357 | 13.7 | 536,788 | 9.7 | 391,035 | 15.0 | 888,216 | 6.1 |
2014 | 323,332 | 17.9 | 558,659 | 4.1 | 445,693 | 14.0 | 953,178 | 7.3 |
2015 | 387,152 | 19.7 | 630,479 | 12.9 | 598,434 | 34.3 | 591,110 | -38.0 |
2016 | 475,887 | 22.9 | 749,091 | 18.8 | 723,697 | 20.9 | 706,876 | 19.6 |
2017 | 557,688 | 17.2 | 880,396 | 17.5 | 866,885 | 19.8 | 837,180 | 18.4 |
2018 | 639,370 | 14.6 | 1,006,442 | 14.3 | 988,739 | 14.1 | 888,216 | 6.1 |
2019 | 741,387 | 16.0 | 1,121,900 | 11.5 | 1,116,998 | 13.0 | 953,178 | 7.3 |
2020 | 845.128 | 14.0 | 1,212,624 | 8.1 | 1,214,295 | 8.7 | 1,015,333 | 6.5 |
Maybe you are interested!
-
 Increasing capital mobilization from individual customers of commercial banks - Case study of Vietnam Joint Stock Commercial Bank for Investment and Development, Phu Tho Branch - 1
 -
 Solutions to enhance capital mobilization at Lien Viet Post Joint Stock Commercial Bank - Hai Phong Branch - 9
 -
 Solutions to enhance capital mobilization at Lien Viet Post Joint Stock Commercial Bank - Hai Phong Branch - 8
 -
 Capital mobilization management at Northern Branches of Vietnam Prosperity Joint Stock Commercial Bank - 1
 -
 Evaluation of Capital Mobilization Activities of Lien Viet Post Joint Stock Commercial Bank - Hai Phong Branch
Source: Annual reports of credit institutions from 2010-2020
Unit: %
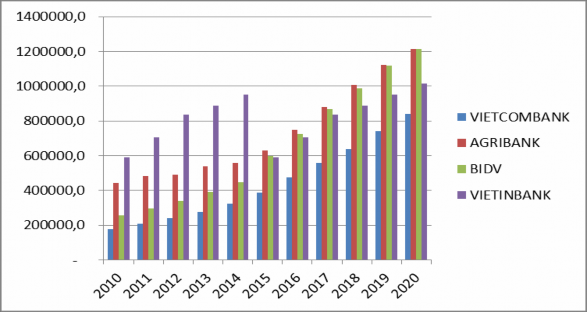
Chart 3.7. Outstanding loans of some commercial banks over the years 2010-2020
Source: Annual reports of credit institutions from 2010-2020
Compared to the other 3 banks, Vietcombank's outstanding loan size is much lower. Over the past 10 years, Vietcombank has changed its business orientation, thereby changing its income structure and increasing profits. Vietcombank has pivoted from lending to large corporate customers and large loans to focusing on individual customers and medium-sized loans to diversify risks. At the same time, it has improved regulations on loan appraisal for customers, screening customers with good financial and business situations for credit granting. Thereby improving the safety and efficiency of the system. In Vietcombank's income structure in 2020, Vietcombank's net interest income proportion is the lowest. At the same time, income from service activities and foreign exchange and gold trading is the highest. From there, it can be seen that Vietcombank's general orientation is to develop the retail segment to diversify risks. At the same time, increase the proportion of income from services and foreign exchange and gold trading to shift the income structure towards reducing dependence on credit activities and shifting the income structure towards modern banking.
+ Profit scale
Table 3.6. Pre-tax profits of some commercial banks over the years from 2010-2020
Year
Vietcombank | AGRIBANK | BIDV | VIETINBANK | |||||
Amount (billion VND) | Growth (%) | Amount (billion VND) | Growth (%) | Amount (billion VND) | Growth (%) | Amount (billion VND) | Growth (%) | |
2010 | 5,569 | 2,217 | 4,626 | 7,345 | ||||
2011 | 5,697 | 2.3 | 4,853 | 118.9 | 4,220 | 2.3 | 8,454 | 2.3 |
2012 | 5,764 | 1.2 | 4.104 | -15.4 | 4,325 | 1.2 | 9,206 | 1.2 |
2013 | 5,743 | -0.4 | 2,456 | -40.2 | 5,290 | -0.4 | 6,559 | -0.4 |
2014 | 5,876 | 2.3 | 2,528 | 2.9 | 6,297 | 2.3 | 11,781 | 2.3 |
2015 | 6,827 | 16.2 | 3,183 | 25.9 | 7,948 | 16.2 | 7,345 | 16.2 |
2016 | 8,523 | 24.8 | 3,881 | 21.9 | 7,664 | 24.8 | 8,454 | 24.8 |
2017 | 11,341 | 33.1 | 4,985 | 28.4 | 8,665 | 33.1 | 9,206 | 33.1 |
2018 | 18,269 | 61.1 | 7,345 | 47.3 | 9,391 | 61.1 | 6,559 | 61.1 |
2019 | 23,122 | 26.6 | 14,116 | 92.2 | 10,732 | 26.6 | 11,781 | 26.6 |
2020 | 23,044 | -0.3 | 12,896 | -8.6 | 9,213 | -0.3 | 17,070 | -0.3 |
Source: Annual reports of credit institutions from 2010-2020
Unit: %
Chart 3.8. Pre-tax profits of some commercial banks over the years 2010-2020
Source: Annual reports of credit institutions from 2010-2020 Within 10 years from 2010-2020, the profit scale and profit ranking of 4 State-owned commercial banks have changed continuously. These four banks continuously take turns leading in profit scale among banks.
Vietnam trade.
Vietcombank has an average pre-tax profit growth rate of 16.7%/year from 2010-2020. Leading the way is Agribank with a rate of 27.3%, followed by Vietcombank, Vietinbank and BIDV. Of the 4 banks above, Vietcombank's growth rate over the years has the most positive and stable growth rate.
In terms of current scale, VCB ranks first among the four state-owned commercial banks with a profit scale of VND 23,044 billion in 2020. The next ranks are Vietinbank, Agribank and BIDV. In terms of profit scale, Vietcombank is quite large and quite far from the other three banks.
Conclusion: In the 05 main indicators of scale including: equity, total assets, capital mobilization, loans and profits from 2010 to present. Currently, Vietcombank ranks first in equity, first in profits, third in capital mobilization, fourth in total assets and outstanding loans. From that, it can be seen that
Vietcombank is the bank with the largest equity and highest operating efficiency. The structure of income and profit has shifted towards reducing dependence on credit and increasing services and foreign exchange.
+ Profitability coefficient ROA, ROE
Table 3.7. Profitability ratio of some commercial banks over the years 2010-2020
Unit: Percent
Group of State-owned commercial banks
Year | Vietcombank | AGRIBANK | BIDV | VIETINBANK | |||||
ROA | ROE | ROA | ROE | ROA | ROE | ROA | ROE | ||
2010 | 1.50 | 22.55 | 0.24 | 5.19 | 1.13 | 18.00 | 1.50 | 22.10 | |
2011 | 1.25 | 17.08 | 0.65 | 11.86 | 0.83 | 13.20 | 2.03 | 26.74 | |
2012 | 1.13 | 12.61 | 0.41 | 7.31 | 0.74 | 12.90 | 1.70 | 19.90 | |
2013 | 0.99 | 10.33 | 0.25 | 4.62 | 0.78 | 13.80 | 1.40 | 13.70 | |
2014 | 0.88 | 10.76 | 0.24 | 4.47 | 0.83 | 15.15 | 1.20 | 10.50 | |
2015 | 0.85 | 12.03 | 0.29 | 5.83 | 0.84 | 16.97 | 1.00 | 10.30 | |
2016 | 0.94 | 14.69 | 0.22 | 7.07 | 0.66 | 14.33 | 1.00 | 11.60 | |
2017 | 1.00 | 18.09 | 0.36 | 8.31 | 0.61 | 14.94 | 0.90 | 12.00 | |
2018 | 1.39 | 25.49 | 0.47 | 10.64 | 0.59 | 14.48 | 0.60 | 8.10 | |
2019 | 1.62 | 25.99 | 0.81 | 17.46 | 0.61 | 12.94 | 1.00 | 13.10 | |
2020 | 1.45 | 21.11 | 0.66 | 14.47 | 0.47 | 9.07 | 1.06 | 16.81 | |
Private Capital Commercial Bank Group | |||||||||
Year | VPB | TCB | VIB | TPB | |||||
ROA | ROE | ROA | ROE | ROA | ROE | ROA | ROE | ||
2010 | 1.15 | 12.98 | 1.71 | 24.80 | 1.05 | 16.58 | 1.02 | 6.69 | |
2011 | 1.12 | 14.28 | 1.91 | 28.79 | 0.67 | 8.66 | (5.99) | (56.33) | |
2012 | 0.69 | 10.19 | 0.42 | 5.93 | 0.65 | 6.33 | 0.58 | 4.66 | |
2013 | 0.91 | 14.17 | 0.39 | 4.84 | 0.07 | 0.61 | 1.62 | 10.87 | |
2014 | 0.90 | 15.00 | 0.65 | 7.49 | 0.66 | 6.34 | 1.28 | 13.05 | |
2015 | 1.30 | 21.40 | 0.83 | 9.73 | 0.63 | 6.09 | 0.88 | 12.44 | |
2016 | 1.90 | 25.70 | 1.47 | 17.47 | 0.59 | 6.47 | 0.62 | 10.79 | |
2017 | 2.50 | 27.50 | 2.55 | 27.71 | 1.00 | 12.80 | 0.84 | 15.59 | |
2018 | 2.40 | 22.80 | 2.87 | 21.56 | 1.70 | 22.50 | 1.39 | 20.84 | |
2019 | 2.36 | 21.47 | 2.95 | 18.23 | 2.02 | 27.11 | 2.06 | 26.11 | |
2020 | 2.62 | 21.92 | 2.99 | 18.03 | 2.16 | 29.57 | 1.89 | 23.54 | |
Source: Annual reports of credit institutions from 2010-2020
The author divides the profitability coefficient into 2 groups of banks including state-owned commercial banks and private-owned commercial banks. In which, the group of state-owned commercial banks includes 4 banks: Vietcombank, Vietinbank, BIDV, Agribank. In the group of private joint-stock commercial banks, the author selects 4 typical banks including VPB, TCB, VIB and TPB.
Return on total assets - ROA:
From 2010-2020, Vietcombank's ROA fluctuated from 0.88% from 2010 to 1.45% in 2020. In 2020, Vietcombank's ROA reached
1.45%, ranking first among the 4 state-owned commercial banks. Vietinbank's ROA ranked second with a value of 1.06%, followed by Agribank and BIDV's ROA with values of 0.66% and 0.47%. Vietcombank's ROA is much higher than the other 3 commercial banks, because Vietcombank's after-tax profit is at the top and has a large gap compared to the other 3 banks. Meanwhile, Vietcombank's total assets only ranked 4th among the 4 banks. In other words, Vietcombank's profitability of total assets is the highest among the 4 state-owned commercial banks.
Compared to some private commercial banks, Vietcombank's ROA is the top among the four state-owned joint stock commercial banks but is behind some private joint stock commercial banks. Specifically, compared to VPB, TCB, VIB and VPB, Vietcombank's ROA is lower, even much lower than VPB and TCB. VPB and TCB's ROA in 2020 were 2.62% and 2.99% respectively, while Vietcombank's was 1.45%. The ROA of the two banks VPB and TCB is almost twice as high as Vietcombank's. In other words, the profitability of total assets of VPB and TCB is much higher than that of VCB.
Return on equity - ROE:
Vietcombank's ROE, like ROA, tends to fluctuate between 2010 and 2020. In 2020, Vietcombank's ROE
Vietcombank achieved 21.11%, ranking first among the four state-owned commercial banks. Next is Vietinbank's ROE with a value of 16.81%. Agribank and BIDV's ROEs ranked next with 2020 values of 14.47% and 9.07%, respectively.
%. BIDV's ROE in 2020 decreased to 9.07 times, down 3.87% compared to 2019, because in 2020 BIDV's profit did not grow due to provisioning for credit loans.
VCB's ROE is lower than some private joint stock commercial banks such as VPB, VIB and TPB. Specifically, the ROE of VPB, VIB and TPB in 2020 reached 21.92%,
29.57 times and 23.54% while VCB's is 18.03%. Although Vietcombank is the leader in profitability among the four state-owned joint stock commercial banks, it is behind some private commercial banks.
Conclusion: Thus, in terms of profit scale and profitability indicators, Vietcombank is currently the leading bank among the four state-owned commercial banks. However, compared to the group of private joint-stock commercial banks, Vietcombank currently has a lower profitability ratio than some banks in the private group.
+ Capital adequacy ratio - Car
Table 3.8. Capital adequacy ratio - Car of commercial banks over the years 2010-2020
Unit: %
Year
Vietcombank | Agribank | BIDV | VTB | VPB | VIB | TCB | |
2014 | 11.35 | 9.27 | 10.40 | 11:30 | 17.71 | 15.70 | |
2015 | 11.04 | 9.81 | 10.60 | 12.20 | 18.04 | 14.70 | |
2016 | 11.13 | 11.05 | 10.15 | 10.40 | 13.20 | 13.25 | 13.10 |
2017 | 11.63 | 10.17 | 10.90 | 9.40 | 14.60 | 13.07 | 12.70 |
2018 | 12.14 | 9.35 | 10:30 | 9.30 | 12:30 | 12.88 | 14.60 |
2019 | 9.34 | 9.21 | 12:30 | 9.60 | 11.10 | 9.70 | 15.50 |
2020 | 9.56 | 10:30 | 8.30 | 10.50 | 11.00 | 10.12 | 16.10 |
Source: Annual reports of credit institutions from 2010-2020
Vietcombank's capital adequacy ratio tends to decrease from 2014-2020, from 11.35% in 2014 to 9.56% in 2020. In 2020, the Car
Vietcombank's Car coefficient reached 9.70% and ranked 3rd in the group of 4 joint stock commercial banks with State capital. Leading the Car coefficient of this group is Vietinbank with a value of
10.50%. Vietcombank's Car coefficient at all evaluation times meets the requirements according to Circular 41/2016/TT-NHNN.
Compared to some other commercial banks such as VPB, VIB, TCB, Vietcombank's Car ratio is still low, even quite far apart. VPB, VIB and TCB's Car in 2020 reached 11.00%, 10.12% and 16.10% respectively. In terms of capital safety according to Basel II, the above 3 banks have much higher capital safety than Vietcombank.
+ Liquidity reserve ratio
Table 3.9. Liquidity reserve ratio of commercial banks over the years 2016-2020
Unit: %
2016 | 2017 | 2018 | 2019 | 2020 | |
Vietinbank | 14.3 | 14.32 | 13.39 | 14.03 | 12.28 |
BIDV | 15.8 | 15.49 | 15.42 | 18.39 | 11.95 |
Vietcombank | 30.5 | 35.86 | 24.12 | 22.05 | 19.24 |
Agriculture | 12.7 | 13.71 | 13.34 | 15.75 | 15.19 |
Source: Annual reports of credit institutions from 2016-2020 During the period from 2016-2020, Vietcombank's liquidity reserve ratio tended to decrease, from 30.5% in 2016 to 19.24% in 2020. In general, during this period, the liquidity reserve ratios of Vietcombank, BIDV, and Vietinbank all tended to decrease in the medium term.
except Agribank has an increasing trend.
As of 2020, Vietcombank's liquidity reserve ratio reached
19.24%, ranking first among the four state-owned commercial banks. Next are Agribank, Vietinbank and BIDV ranked last with values of 15.19%, 12.28% and 11.95% respectively.