- Short-term solvency
Table 2.8. Analysis of the short-term solvency of the enterprise
Target
December 31, 2017 | December 31, 2018 | December 31, 2019 | Difference | ||
2018- 2017 | 2019- 2018 | ||||
Current assets (million dong) | 19,002,943 | 18,505,885 | 19,828,855 | -497.058 | 1,322,970 |
Short-term debt (million dong) | 9,111,522 | 9,011,802 | 12,870,780 | -99.720 | 3,858,978 |
Short term solvency ratio time limit | 2,086 | 2,054 | 1,541 | -0.032 | -0.513 |
Maybe you are interested!
-

 Improving the quality of short-term loans for small and medium enterprises - 2
 -
 Improving the quality of short-term loans for small and medium enterprises - 12
 -
 Analysis of Capital Structure and Cost of Capital at Some Typical Enterprises
 -
 Discussion on Causes, Limitations and Existing Problems of Short-Term Loan Service Quality Khdn
 -
 Some Factors Affecting the Quality of Short-Term Loan Services for Business Customers of Commercial Banks
Source: Author's calculation from the financial statements and business performance reports of 2017, 2018, 2019
Company
December 31, 2017
December 31, 2018
12/31/209
December 31, 2017
December 31, 2018
12/31/209
Chart 2.2. Short-term solvency of the enterprise
Source: Author's calculation from the financial statements and business performance reports of 2017, 2018, 2019
Company
+ Looking at the chart, we can see that at the end of 2018, the short-term solvency of the enterprise decreased compared to the end of 2017, which is relatively equal. Short-term debt at the end of 2018 decreased compared to the end of 2017 by 1.09%, but the enterprise's short-term assets also decreased by 2.62%, meeting the ability to pay short-term debt close to the end of 2017, so the short-term solvency at the end of 2018 decreased by 1.91% compared to the end of 2017, but not significantly.
We can see that the short-term solvency of the enterprise at the end of 2018 is 2.054 > 1, so the enterprise is operating very effectively.
+ At the end of 2019, the short-term solvency of the enterprise compared to the end of 2018 was quite different, the short-term solvency at the end of 2019 decreased by 24.88% compared to the end of 2018.
Because the short-term debt of the enterprise at the end of 2019 increased more than at the end of 2018 by 42.82%, the short-term assets of the enterprise at the end of 2019 also increased compared to the end of 2018 but increased by a small amount of 7.15%.
At the end of 2018, the company's short-term assets decreased by 497,508 million VND compared to the end of 2017, a decrease of 2.62%, and at the end of 2019, the company's short-term assets increased by 1,322,970 million VND compared to the end of 2018, an increase of 7.15%.
However, the short-term solvency of the business at the end of the year
2019 is 1.541 > 1 so the business is still operating well.
The basic measures to improve this indicator should be aimed at increasing stable sources of capital (equity and long-term debt) instead of short-term debt.
- Instant payment ratio
Table 2.9. Analysis of the Enterprise's Instant Payment Ability
Target
December 31, 2017 | December 31, 2018 | December 31, 2019 | Difference | ||
2018-2017 | 2019-2018 | ||||
Money and payments Cash equivalents (million VND) | 1,522,610 | 963,356 | 1,011,235 | -559.254 | 47,879 |
Short-term debt (million dong) | 9,111,522 | 9,011,802 | 12,870,780 | -99.720 | 3,858,978 |
Liquidity ratio instant math (times) | 0.17 | 0.11 | 0.08 | -0.06 | -0.03 |
Source: Author's calculation from the financial statements and business performance reports of 2017, 2018, 2019
Company
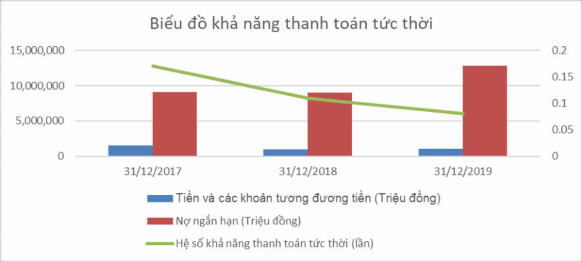
Chart 2.3. Immediate payment ability of enterprises
Source: Author's calculation from the financial statements and business performance reports of 2017, 2018, 2019
Company
The company's instant solvency ratio in 2017, 2018, 2019 was 0.17 times, 0.11 times, 0.08 times respectively. At the end of 2018, it decreased by 0.06 times compared to the end of 2017. The company's cash and cash equivalents at the end of 2018 decreased by VND 559,254 million compared to the end of 2017, short-term debt decreased by VND 99,720 million. At the end of 2019, it decreased by 0.03 times compared to the end of 2018. The company's cash and cash equivalents at the end of 2019 increased by VND 47,879 million compared to the end of 2018, short-term debt increased by VND 3,858,978 million.
This ratio reflects the Company's ability to immediately pay short-term debts with cash and cash equivalents, indicating how many times the Company can immediately pay short-term debts with cash in hand and cash equivalents.
In 2018 and 2019, the company's current ratio tended to decrease due to a decrease in cash flow from operating activities and net cash flow from investing activities (in a negative state). The company increased debt mobilization to increase cash inflow, but total net cash flow was still negative, cash and cash equivalents decreased or increased slightly in the years, but the company increased short-term debt sharply, thereby reducing the current ratio.
2.3.4. Analysis of business results
Table 2.10. Analysis of the company's business results
Unit: Million VND
Target
2017 | 2018 | 2019 | 2018 vs 2017 | 2019 vs 2018 | |||
Difference | Proportion (%) | Difference deviated | Proportion (%) | ||||
1. Sales and service revenue | 47,506,683 | 46,924,852 | 50,822,277 | -581.831 | -1.22 | 3,897,425 | 8.31 |
2. Revenue deductions | 47,904 | 31,642 | 50,767 | -16.262 | -33.95 | 19,125 | 60.44 |
3. Net revenue from sales and service provision | 47,458,779 | 46,893,210 | 50,771,510 | -565.569 | -1.19 | 3,878,300 | 8.27 |
4. Cost of goods sold | 24,244,098 | 23,675,569 | 25,736,368 | -568.529 | -2.35 | 2,060,799 | 8.7 |
5. Gross profit from sales and service provision | 23,214,681 | 23,217,641 | 25,035,142 | 2,960 | 0.01 | 1,817,501 | 7.83 |
6. Financial operating revenue | 1,282,828 | 748,301 | 773,077 | -534.527 | -41.67 | 24,776 | 3.31 |
7. Financial costs | 25,580 | 72,236 | 130,431 | 46,656 | 182.39 | 58,195 | 80.56 |
In which: Interest expense | 12,869 | 20,506 | 71,983 | 7,637 | 59.34 | 51,477 | 251.03 |
8. Selling expenses | 11,018,891 | 11,705,281 | 12,422,237 | 686,390 | 6.23 | 716,956 | 6.13 |
9. Business management costs | 983,689 | 746,894 | 964,848 | -236.795 | -24.07 | 217,954 | 29.18 |
10. Net operating profit business | 12,469,349 | 11,441,531 | 12,290,703 | -1,027,818 | -8.24 | 849,172 | 7.42 |
11. Other income | 153,645 | 365,230 | 118,809 | 211,585 | 137.71 | -246.421 | -67.47 |
Target
2017 | 2018 | 2019 | 2018 vs 2017 | 2019 vs 2018 | |||
Difference | Proportion (%) | Difference deviated | Proportion (%) | ||||
12. Other costs | 126,142 | 111,608 | 98,356 | -14,534 | -11.52 | -13.252 | -11.87 |
13. Results from other activities | 27,503 | 253,622 | 20,453 | 226,119 | 822.16 | -233.169 | -91.94 |
11. Profit before tax | 12,496,852 | 11,695,153 | 12,311,156 | -801.699 | -6.42 | 616.003 | 5.27 |
14. Current corporate income tax expense | 1,947,434 | 1,883,006 | 2,217,172 | -64.428 | -3.31 | 334,166 | 17.75 |
14. Deferred corporate income tax expense/(benefit) | 4,256 | -1.963 | 8824 | -6.219 | -146.12 | 10,787 | -549.5 |
15. Profit after corporate income tax | 10,545,162 | 9,814,110 | 10,085,160 | -731.052 | -6.93 | 271,050 | 2.76 |
Operating profit margin after tax (ROS) | 0.215 | 0.204 | 0.195 | -0.011 | -5.18 | -0.009 | -4,542 |
Operating profit margin before tax | 0.255 | 0.243 | 0.238 | -0.012 | -4.65 | -0.005 | -2,215 |
Operating profit ratio business | 0.256 | 0.240 | 0.238 | -0.016 | -6.12 | -0.002 | -0.712 |
Cost of goods sold | 0.511 | 0.505 | 0.507 | -0.006 | -1.17 | 0.002 | 0.4007 |
Cost of sales ratio | 0.232 | 0.250 | 0.245 | 0.017 | 7.51 | -0.005 | -1,982 |
Business management cost coefficient | 0.021 | 0.016 | 0.019 | -0.005 | -23.16 | 0.003 | 19,314 |
Source: Author's calculation from the Company's 2017, 2018, 2019 Financial Statements and Business Performance Reports
Business performance evaluation
* Net revenue from sales activities
Vinamilk's revenue in 2017, 2018, 2019 was VND 47,458,779 million, VND 46,893,210 million, VND 50,771,510 million, respectively. In 2018, it decreased by VND 565,569 million (down 1.19%) compared to 2017. In 2019, it increased by VND 3,873,300 million (up 8.28%) compared to 2018.
Since equitization in November 2003, Vinamilk's revenue has grown at an average rate of 22% per year.
* Gross profit from sales and service provision
Vinamilk's gross profit in 2017, 2018, 2019 was VND 23,214,681 million, VND 23,217,641 million, VND 25,035,142 million respectively. In 2018, it increased slightly by VND 2,960 million (up 0.01%) compared to 2017, and in 2019, it increased by VND 2,960 million (up 0.01%) compared to 2017.
1,817,501 million VND (up 7.83%) compared to 2018.
The Company's gross profit always accounts for a high proportion, from 48.92% in 2017 to 49.51% in 2018 and by 2019 this index decreased to 49.31%.
This result shows the ability to manage costs as well as the company not changing much of its product structure towards focusing on valuable products.
In absolute terms, cost of goods sold decreased from VND 24,244,098 million in 2017 to VND 23,675,569 million in 2018 (down 2.35%), and in 2019 cost of goods sold increased to VND 25,736,368 million (up 8.57%). Although the Company's main raw material prices, fresh milk and powdered milk, are high.
* Financial operating revenue
Revenue from financial activities in 2017, 2018, 2019 were VND 1,282,828 million, VND 748,301 million, VND 773,077 million, respectively. 2018
decreased by 534,527 million VND (decreased by 41.67%) compared to 2017. In 2019, it increased
24,776 million VND (up 3.31%) compared to 2018.
Revenue from financial activities as of 2019 decreased sharply compared to 2017 due to reduced dividends and profits.
* Financial costs
Financial expenses in 2017, 2018, 2019 were 25,580 million VND, 72,236 million VND, 130,431 million VND respectively. In 2018, it increased by 46,656 million VND.
VND (up 182.39%) compared to 2017, 2019 increased by VND 58,195 million
(up 80.56%) compared to 2018.
Financial expenses increased over the years due to provisions for devaluation of securities investments and exchange rate losses, along with increased interest expenses.
* Selling expenses
Selling expenses in 2017, 2018, 2019 were VND 11,018,891 million, VND 11,705,281 million, VND 12,422,237 million, respectively. In 2018, it increased by VND 686,390 million (up 6.23%) compared to the end of 2017, in 2019 it increased by VND 716,965 million (up 6.13%) compared to 2018.
Selling expenses increased due to increased promotional and distributor support costs.
* Management costs
Management expenses in 2017, 2018, 2019 were VND 983,689 million, VND 746,894 million, VND 964,848 million respectively. In 2018, it decreased by VND 236,795 million.
VND (down 24.07%) compared to 2017, increased by VND 217,954 million in 2019
(up 29.18%) compared to 2018.
Administrative expenses increased mainly due to increased costs of outsourced services.
* Net profit from business activities
Net profit from business activities at the end of 2018 decreased by 8.24% compared to 2017, in 2019 this indicator increased again at a rate of 7.42% compared to 2018.
Operating profit margin / net revenue in 2019 reached 24.21%, lower than 24.40% in 2018 and 26.27% in 2017 mainly due to higher revenue than expenses.
81
2.3.5. Analysis of net cash flow situation
Table 2.11. Analysis of the Company's net cash flow situation
Unit: Million VND
Target
2017 | 2018 | 2019 | 2018 vs 2017 | 2019 vs 2018 | |||
Difference | Proportion (%) | Difference | Proportion (%) | ||||
Net cash flow from operating activities | 10,041,507 | 7,586,313 | 11,378,216 | -2,455,194 | -24.45 | 3,791,903 | 49.98 |
Net cash flow from operating activities | -2,781,850 | -747.354 | -7,762,933 | 2,034,496 | 73.13 | 7,015,579 | 938.72 |
Net cash flow from the Board of Directors | -7,011,305 | -6,559,498 | -3,667,480 | 451,807 | 6.44 | 2,892,018 | 44.09 |
Net cash flow during the period | 248,352 | 279,461 | -52,197 | 31,109 | 12.53 | -331.658 | -118.68 |
Source: Author's calculation from the Company's 2017, 2018, 2019 Financial Statements and Business Performance Reports