3. Data analysis results – Business evaluation scale
Table PL-B-31: Results of EFA condition test for satisfaction scale of business assessment
KMO and Bartlett's Test
Kaiser-Meyer-Olkin Measure of Sampling Adequacy. | ,736 | |
Bartlett's Test of Sphericity | Approx. Chi-Square | 123,262 |
df | 3 | |
Sig. | ,000 | |
Maybe you are interested!
-

 Some solutions to improve the quality of training in Tourism - Hotel in Ba Ria - Vung Tau province - 17
 -
 Focus on Training to Improve the Quality of Human Resources
 -
 Measure 2: Training Teachers on Tnkq Exam Construction Techniques and How to Process Results to Improve Quality
 -
 Solutions to improve the quality of consumer lending activities at Vietnam Prosperity Joint Stock Commercial Bank - 2
 -
 Current situation and solutions to improve the quality of room service at Habana Hotel - 2
Table PL-B-32: EFA Results for the Business Assessment Satisfaction Scale
Total Variance Explained
Component
Initial Eigenvalues | Extraction Sums of Squared Loadings | |||||
Total | % of Variance | cumulative % | Total | % of Variance | cumulative % | |
1 | 2,389 | 79,639 | 79,639 | 2,389 | 79,639 | 79,639 |
2 | ,346 | 11,518 | 91,157 | |||
3 | ,265 | 8,843 | 100,000 | |||
Extraction Method: Principal Component Analysis.
Table PL-B-33: KMO & Bartlett test for the set of variables of the enterprise's evaluation scale
KMO and Bartlett's Test
Kaiser-Meyer-Olkin Measure of Sampling Adequacy. | ,862 | |
Approx. Chi-Square | 1369,886 | |
Bartlett's Test of Sphericity | df | 136 |
Sig. | ,000 | |
Table PL-B-34: Factor extraction (PCA) results of business evaluation
Total Variance Explained
Compo nent
Initial Eigenvalues | Extraction Sums of Squared Loadings | Rotation Sums of Squared Loadings | |||||||
Total | % of Variance | cumulative % | Total | % of Variance | cumulative % | Total | % of Variance | cumulative % | |
1 | 10,335 | 57,417 | 57,417 | 10,335 | 57,417 | 57,417 | 4,849 | 26,941 | 26,941 |
2 | 1,259 | 6,994 | 64,410 | 1,259 | 6,994 | 64,410 | 4,588 | 25,488 | 52,429 |
3 | 1,100 | 6,109 | 70,519 | 1,100 | 6,109 | 70,519 | 3,256 | 18,090 | 70,519 |
4 | ,931 | 5,171 | 75,690 | ||||||
5 | ,769 | 4,275 | 79,965 | ||||||
18 | ,042 | ,234 | 100,000 | ||||||
Extraction Method: Principal Component Analysis.
Table PL-B-35: Factor rotation results (Varimax) of business assessment
Rotated Component Matrix a
Component | |||
1 | 2 | 3 | |
NL3 | ,832 | ||
NL4 | ,828 | ||
NL2 | ,790 | ||
NL1 | ,714 | ,536 | |
NL5 | ,679 | ||
TC3 | ,531 | ||
TC2 | ,773 | ||
DU4 | ,507 | ,706 | |
DU3 | ,566 | ,690 | |
DU2 | ,661 | ||
DU1 | ,656 | ||
HH1 | ,586 | ||
HH2 | ,584 | ,552 | |
TC4 | ,572 | ||
TC1 | ,565 | ||
DC1 | ,778 | ||
DC2 | ,528 | ,733 | |
DC3 | ,690 | ||
Table PL-B-36: Correlation test results between pairs of variables - business evaluation scales
Correlations
HL | KN | TD | DC | ||
HL | Pearson Correlation | 1 | ,828** | ,797** | ,730** |
KN | Pearson Correlation | ,828** | 1 | ,777** | ,727** |
TD | Pearson Correlation | ,797** | ,777** | 1 | ,696** |
DC | Pearson Correlation | ,730** | ,727** | ,696** | 1 |
**. Correlation is significant at the 0.01 level (2-tailed). | |||||
Table PL-B-37: Regression results – business assessment scale
Model Summary b
Mode l
R | R Square | Adjusted R Square | Std. Error of the Estimate | Durbin-Watson | |
1 | , 871a | ,759 | ,750 | ,36223 | 1,772 |
a. Predictors: (Constant), DC, TD, KN
b. Dependent Variable: HL
ANOVA a
Model
Sum of Squares | df | Mean Square | F | Sig. | ||
Regression | 33,133 | 3 | 11,044 | 84,174 | ,000 b | |
1 | Residual | 10,497 | 80 | ,131 | ||
Total | 43,630 | 83 |
a. Dependent Variable: HL
b. Predictors: (Constant), DC, TD, KN
Table PL-B-38: Results of regression coefficients of business evaluation
Coefficients a
Model
Unstandardized Coefficients | Standardized Coefficients | t | Sig. | Collinearity Statistics | ||||
B | Std. Error | Beta | Tolerance | VIF | ||||
(Constant) | ,531 | ,246 | 2,159 | ,034 | ||||
1 | KN | ,371 | ,080 | ,441 | 4,613 | ,000 | ,329 | 3,043 |
TD | ,367 | ,102 | ,329 | 3,594 | ,001 | ,360 | 2,778 | |
DC | ,190 | ,088 | ,181 | 2,157 | ,034 | ,428 | 2,337 | |
a. Dependent Variable: HL
Chart PL-B-5: Scatter plot of residuals (standardized) and dependent variable (standardized) – business assessment
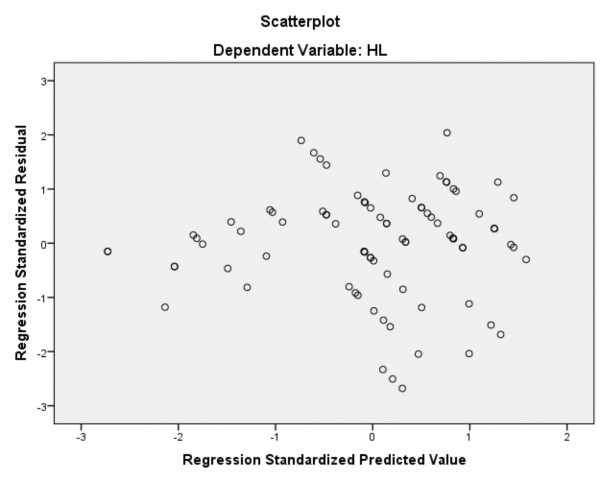
Table PL-B-39: Spearman rank correlation analysis results - business evaluation
Correlations
HL | TT | ||
HL | Correlation Coefficient | 1,000 | -,007 |
Sig (2-tailed) | ,949 | ||
Spearman's rho | N | 84 | 84 |
Correlation Coefficient | -,007 | 1,000 | |
TT | |||
Sig (2-tailed) | ,949 | ||
N | 84 | 84 |
**. Correlation is significant at the 0.01 level (2-tailed).
Chart PL-B-6: Residual PP chart - business evaluation scale
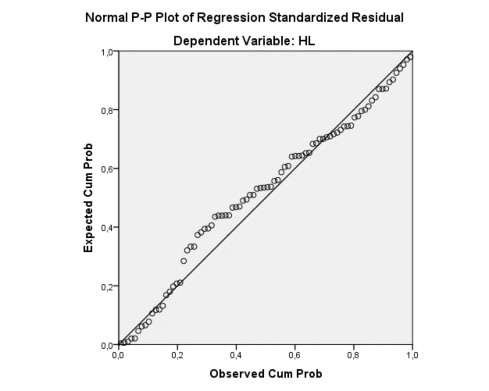
Table PL-B-40: Overall average estimates of factors influencing business evaluation
One-Sample Statistics
N | Mean | Std. Deviation | Std. Error Mean | |
KN | 84 | 3.3433 | ,86326 | ,09419 |
TD | 84 | 3,7791 | ,64823 | ,07073 |
DC | 84 | 3,2659 | ,69185 | ,07549 |
HL | 84 | 3.7778 | ,72502 | ,07911 |
One-Sample Test
Test Value = 0 | ||||||
t | df | Sig (2-tailed) | Mean Difference | 95% Confidence Interval of the Difference | ||
Lower | Upper | |||||
KN | 35,495 | 83 | ,000 | 3.34325 | 3,1559 | 3,5306 |
TD | 53,432 | 83 | ,000 | 3,77910 | 3,6384 | 3,9198 |
DC | 43,264 | 83 | ,000 | 3,26587 | 3,1157 | 3,4160 |
HL | 47,756 | 83 | ,000 | 3,77778 | 3,6204 | 3,9351 |
Table PL-B-41: Overall average estimates of factors affecting the enterprise's DC rating
One-Sample Statistics
N | Mean | Std. Deviation | Std. Error Mean | |
DC1 | 84 | 3.23 | ,812 | ,089 |
DC2 | 84 | 3.18 | ,907 | ,099 |
DC3 | 84 | 3.39 | ,621 | ,068 |
One-Sample Test
Test Value = 0 | ||||||
t | df | Sig (2-tailed) | Mean Difference | 95% Confidence Interval of the Difference | ||
Lower | Upper | |||||
DC1 | 36,422 | 83 | ,000 | 3,226 | 3.05 | 3.40 |
DC2 | 32,109 | 83 | ,000 | 3,179 | 2.98 | 3.38 |
DC3 | 50,053 | 83 | ,000 | 3,393 | 3.26 | 3.53 |
Table PL-B-42: Estimated overall average of factors affecting business evaluation TD
One-Sample Statistics
N | Mean | Std. Deviation | Std. Error Mean | |
TC1 | 84 | 3.89 | ,712 | ,078 |
TC2 | 84 | 4.10 | ,830 | ,091 |
TC4 | 84 | 3.76 | ,900 | ,098 |
HH1 | 84 | 3.67 | ,841 | ,092 |
HH2 | 84 | 3.44 | ,766 | ,084 |
DU1 | 84 | 3.69 | ,776 | ,085 |
DU2 | 84 | 3.85 | ,912 | ,099 |
DU3 | 84 | 3.83 | ,862 | ,094 |
DU4 | 84 | 3.79 | ,851 | ,093 |
One-Sample Test
Test Value = 0 | ||||||
t | df | Sig (2-tailed) | Mean Difference | 95% Confidence Interval of the Difference | ||
Lower | Upper | |||||
TC1 | 50,135 | 83 | ,000 | 3,893 | 3.74 | 4.05 |
TC2 | 45,198 | 83 | ,000 | 4,095 | 3.92 | 4.28 |
TC4 | 38,307 | 83 | ,000 | 3,762 | 3.57 | 3.96 |
HH1 | 39,972 | 83 | ,000 | 3,667 | 3.48 | 3.85 |
HH2 | 41,164 | 83 | ,000 | 3,440 | 3.27 | 3.61 |
DU1 | 43,600 | 83 | ,000 | 3,690 | 3.52 | 3.86 |
DU2 | 38,656 | 83 | ,000 | 3,845 | 3.65 | 4.04 |
DU3 | 40,760 | 83 | ,000 | 3,833 | 3.65 | 4.02 |
DU4 | 40,760 | 83 | ,000 | 3,786 | 3.60 | 3.97 |
Table PL-B-43: Estimated overall average of factors affecting business evaluation
One-Sample Statistics
N | Mean | Std. Deviation | Std. Error Mean | |
NL1 | 84 | 3.81 | ,828 | ,090 |
NL2 | 84 | 3.18 | ,959 | ,105 |
NL3 | 84 | 2.87 | 1,117 | ,122 |
NL4 | 84 | 3.06 | 1,196 | ,130 |
NL5 | 84 | 3.48 | 1,092 | ,119 |
TC3 | 84 | 3.67 | ,812 | ,089 |
One-Sample Test
Test Value = 0 | ||||||
t | df | Sig (2-tailed) | Mean Difference | 95% Confidence Interval of the Difference | ||
Lower | Upper | |||||
NL1 | 42,150 | 83 | ,000 | 3,810 | 3.63 | 3.99 |
NL2 | 30,380 | 83 | ,000 | 3,179 | 2.97 | 3.39 |
NL3 | 23,541 | 83 | ,000 | 2,869 | 2.63 | 3.11 |
NL4 | 23,448 | 83 | ,000 | 3,060 | 2.80 | 3.32 |
NL5 | 29,179 | 83 | ,000 | 3,476 | 3.24 | 3.71 |
TC3 | 41,408 | 83 | ,000 | 3,667 | 3.49 | 3.84 |