Quoc, Phuoc Long, Dong Xoai and Ca Mau (Figure 3.14b).
|
Maybe you are interested!
-
 Research on the Current Characteristics of Forest Resources and Factors Affecting Forest Resources Management in the National Park Area
 -
 Testing the Difference in Service Quality at Cinestar Hue Cinemas According to the Characteristics of the Research Sample
 -
 Research on agrobiological characteristics of some apricot varieties and technical measures affecting the growth and flowering of Yen Tu yellow apricot in Hanoi - 22
 -
 Characteristics of Vietnamese Garment Enterprises with Research Sampling
 -
 Some Characteristics of the Research Subject Sample
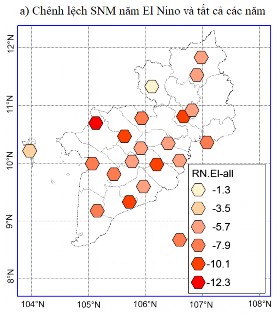
Figure 3.14 Difference in the average number of rainy days in the rainy season between El Nino years (a), La Nina years (b) and all years.
Considering the trend of the number of moderate and heavy rain days in ENSO years, it means considering the relationship between ENSO years and the phenomenon of rain that can have a large impact. This is a factor that has received much attention in recent years. The difference in the number of moderate rain days (the number of days with daily rainfall from 25mm to -50mm in the rainy months between El Nino, La Nina and all years) is shown in Figure 3.15.
Like other characteristics, the average number of moderate rainy days in El Nino years is generally lower than in all other years. The negative difference is found in most stations, accounting for 91% of the total number of stations, except for Bac Lieu and Tay Ninh stations which have positive differences. Stations with higher negative differences with values of about -3 to -4 days are Phu Quoc, Chau Doc, Ca Mau; stations with differences of about 2-3 days are Soc Trang, Vi Thanh, My Tho, Moc Hoa and Cao Lanh stations. Stations with small differences of about 1-2 days are stations in the Southeast region such as Phuoc Long, Dong Xoai, HCM, Bien Hoa, Vung Tau and some stations in the West such as Ba Tri, Tra Vinh, Can Tho and Rach Gia (Figure 3.15a).
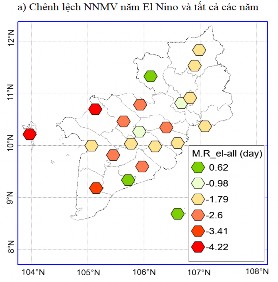
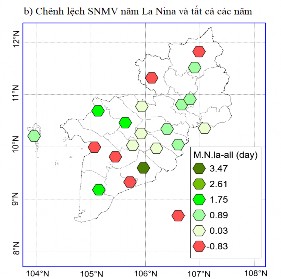
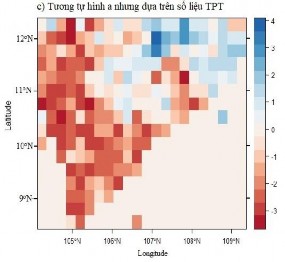
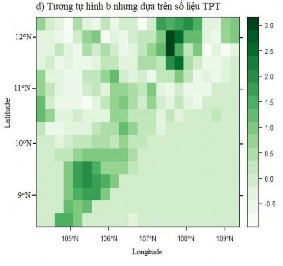
Figure 3.15 SNMV difference in El Nino (a) and La Nina (b) years and all years. (c) and (d) are calculated from (TPT) data.
Note that there are stations with negative differences in El Nino years but also negative differences in La Nina years, such as Vi Thanh, Rach Gia; or stations with positive differences in El Nino years but negative differences in La Nina years such as Con Dao, Soc Trang, Tay Ninh and Phuoc Long. However, it is clear that the majority of stations (accounting for 76% of the stations) have increased SNMV in La Nina years. This shows that ENSO not only affects the rainy season, rainfall but also the number of rainy and moderate rainy days (Figure 3.15b).
TPT data also show a positive difference of SNMV between El Nino year and all years, except for one area around longitude 107 0 E – 108 0 E and latitude 12 o N with a negative difference (Dong Nai province). Meanwhile, the positive difference
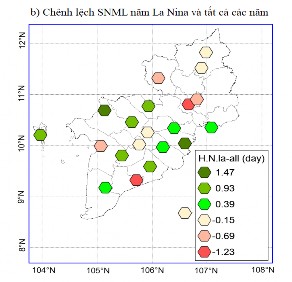
During La Nina years, it is quite consistent throughout the Southern region, more prominent at latitude 12 0 N, longitude 108 0 E and in Ca Mau region around 9 0 N, 105-106 0 E (Figure 3.15c,d).
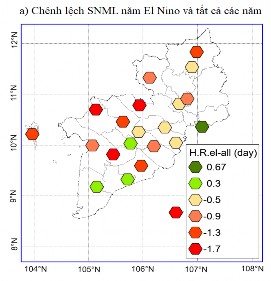
Figure 3.16 SNML difference in El Nino (a) and La Nina (b) years and all years. (c) and (d) are calculated from (TPT) data.
The results of calculating the difference in the number of heavy rain days (SNML) in the rainy season of the ENSO year and all years are shown in Figure 3.16. It can be seen that the negative difference trend in the El Nino year is also shown in the majority of stations, accounting for about 81% of the total 21 stations with common negative difference values from -0.9 to 1.7 days (Figure 3.16a). In the La Nina year, the positive difference accounts for about 57% of the total 21 stations (Figure 3.16b). It is worth noting that in the rainfall characteristics, SNML has the lowest proportion of stations with negative difference in the La Nina year compared to the other years.
Another characteristic, about 43% of the total stations, moreover most of the stations in the Eastern region have a negative trend in La Nina years, except Vung Tau (Figure 3. 16b).
According to TPT data, there is a difference, most of the area has a positive difference in the El Nino year, except for the area at latitude 12 0 N, longitude from 108-109 0 E and a small area at about 9 0 N, 105 0 N. In the La Nina year, the area with a negative trend is not high and almost has a positive difference (Figure 3.16d). This once again recommends the use of TPT rainfall data when analyzing the climate of the Southern region.
3.3. Rainfall change trends during the rainy season in the South
3.3.1. Change trends of the rainy season
Climate change is a major challenge in Vietnam, so in the past year there have been many studies on the changing trends of climate factors and climate extremes for the Southern region. However, these studies often use time series from 1961-2007. Therefore, the main objective of the thesis is to examine the trends for the last two decades (1996-2016). In order to compare and cross-check the changing trends of rainfall characteristics, the thesis uses both the Sen coefficient and the a1 coefficient of the linear regression equation. The significance level of the trend is based on the Mann-Kendall test for the Sen trend and the Student test with a correlation coefficient of =0.1. For linear correlation, the correlation coefficient r>0.36, then the linear change trend reaches 90% significance level (we have, when r=0.36, t=1.77 and t (0.1; 21)=1.70).
The results of calculating the Sen trend and the coefficient a1 of the linear regression equation over time are shown in Figure 3.17. Accordingly, the majority of stations (accounting for 67% of the total 21 stations) have a decreasing trend in the length of the rainy season (the Sen slope and the coefficient a1 are negative) and only 33% of stations have an increasing trend (the Sen slope and a1 are positive). This shows that the decreasing trend in the length of the rainy season in the last two decades is more common. However, no station shows a significance level of 10%.
Figure 3.17 Change trend of rainy season length (DD), period 1996-2016; (a) Sen's slope trend and (b) coefficient a1 of the regression equation over time; circle
Bold black represents a trend of change that reaches the 10% significance level.
3.3.2. Rainfall change trends during the rainy season
The results of calculating the Sen trend and coefficient a1 of the regression equation of total rainfall in the season, period 1996-2016 are shown in Figure 3.18. Rainfall in the rainy season in the period 1996-2016 has a fairly typical and common decreasing trend at stations in the South. Except for the two stations Tay Ninh and Dong Xoai, the other stations have a decreasing trend in rainy season rainfall, some stations have a decreasing trend reaching the 10% significance level such as Vung Tau, Soc Trang, Ca Mau, Rach Gia, Chau Doc, Moc Hoa and Can Tho, this is shown in the consensus of both the Sen coefficient and a1 (Figure 3.18).
Previous studies such as [1], [7], [8] have shown that the rainfall trend in the South tends to increase. The difference here is that these studies show the trend of change in the previous period (1961-2007) at some representative stations. The survey results here show that the rainfall in the period 1996-2016 tends to decrease at most stations. This can be explained as two different trend determination periods leading to different trend results and this is one of the objectives of the thesis. On the other hand, the thesis has surveyed some stations with long periods in the past and the results are similar to the above studies, few stations achieved the 10% significance level (the results are not shown in the thesis).
Figure 3.18 Rainfall change trend, period 1996-2016; (a) Sen's slope trend and (b) coefficient a1 of the regression equation over time; bold black circle shows change trend reaching 10% significance level.
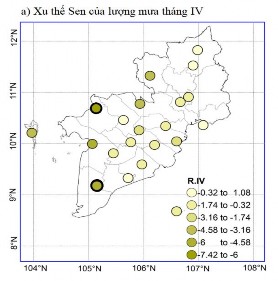
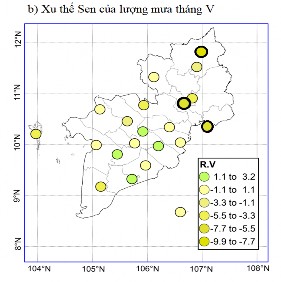
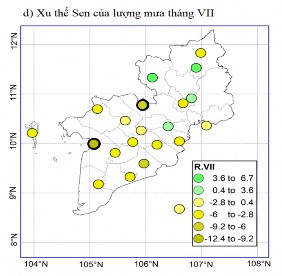
Furthermore, the thesis has examined rainfall data and calculated using two methods to determine and verify the calculated trend results. The thesis has also examined the Sen trend by month, the results are shown in Figure 3.19. Accordingly, in the months of April, May, June, July, August, October and November, most of the stations have a negative Sen trend, although not many stations reach the 10% significance level. Only in September, the majority of the stations (accounting for 81% of the stations) have a positive Sen trend with about 5 stations reaching the 10% significance level, namely Bac Lieu, Phu Quoc, Ho Chi Minh, Tay Ninh and Dong Xoai (Figure 3.19f).
|
|
|
|
|
Figure 3.19 Trend of monthly rainfall change, period 1996-2016; (a) trend Sen's slope and (b) coefficient a1 of the regression equation over time; black circle | |
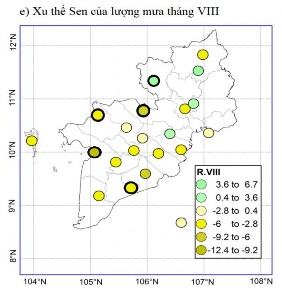
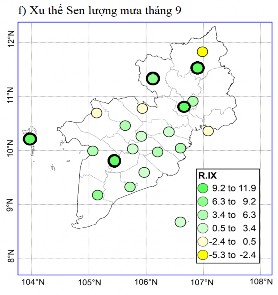
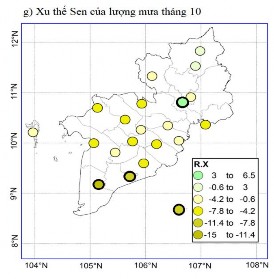
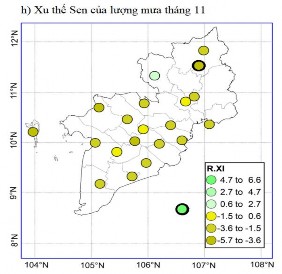
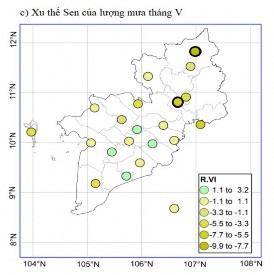
Bold indicates a change trend that reaches the 10% significance level.
3.3.3. Change trends of Rx and SNM
Figure 3.20 Change trend of maximum rainfall (Rx), period 1996-2016; (a) Sen's slope trend and (b) coefficient a1 of the regression equation over time; bold black circle shows change trend reaching 10% significance level.
Like the length of the rainy season and rainfall, the change trend of rainfall Rx also tends to decrease at most stations, except for some stations such as Tay Ninh, Dong Xoai, Bien Hoa and Bac Lieu which have an increasing trend but do not reach the 10% significance level. Stations with a decreasing trend reaching the 10% significance level are Ca Mau, Rach Gia, Can Tho and Moc Hoa (Figure 3.20a). The linear trend distribution based on coefficient a1 is also relatively consistent with the Sen trend. The linear change rate of Rx is generally around 6% to 15%/two decades (% compared to the average of the period 1996-2016).
The Sen trend and coefficient a1 of the number of rainy days (SNM) in the rainy season months are shown in Figure 3.21. It can be seen that the stations with a decreasing trend of SNM account for 71%. However, only a few stations have a statistical significance of 10% such as Soc Trang and Tra Vinh. Some stations with an increasing trend of rainfall are My Tho and Dong Xoai (Figure 3.21a). The linear variation of SNM is generally around 7 to 15 days/two decades. If calculating the average linear decreasing trend of 15 stations, it is around 10 days/two decades (Figure 3.21b).