Currently, the ratio of long-term investment income per contributed capital is very low and has tended to decrease in the last 3 years (Table 2.7).
Thus, it can be assessed that the structure of profitable assets of Agribank, although accounting for a large proportion and tending to increase over the years, the profitability of each type of assets has decreased and bad debt has increased, which is one of the reasons for liquidity difficulties for Agribank.
Table 2.7. Profitability of long-term investment activities
Unit: Billion VND
2008 | 2009 | 2010 | 2011 | 2012 | 2013 | 2014 | |
Average long-term investment contribution | 2534 | 2357 | 2472 | 3215 | 3107 | 2679 | 2651 |
Income from capital contribution to purchase shares | 40 | 34 | 51 | 202 | 119 | 61 | 70 |
TN contributed capital to buy shares/ contributed capital ( ) | 1.58 | 1.44 | 2.06 | 6.28 | 3.83 | 2.28 | 2.64 |
Maybe you are interested!
-

 Improving the quality of financial appraisal of investment projects in medium and long-term lending at the Military Commercial Joint Stock Bank, Hoang Quoc Viet branch - 14
 -
 Improving the quality of financial appraisal of investment projects in medium and long-term lending at the Military Commercial Joint Stock Bank, Hoang Quoc Viet Branch - 2
 -
 Expanding consumer lending activities at the Joint Stock Commercial Bank for Investment and Development, Thang Long Branch - 8
 -
 Financial Appraisal of Investment Projects in Medium and Long-Term Lending of Commercial Banks
 -
 Identify Rating Levels and Rating Scales
zt2i3t4l5ee
zt2a3gstourism,quan lan,quang ninh,ecology,ecotourism,minh chau,van don,geography,geographical basis,tourism development,science
zt2a3ge
zc2o3n4t5e6n7ts
of the islanders. Therefore, this indicator will be divided into two sub-indicators:
a1. Natural tourism attractiveness a2. Cultural tourism attractiveness
b. Tourist capacity
The two island communes in Quan Lan have different capacities to receive tourists. Minh Chau Commune is home to many standard hotels and resorts, attracting high-income domestic and international tourists. Meanwhile, Quan Lan Commune has many motels mainly built and operated by local people, so the scale and quality are not high, and will be suitable for ordinary tourists such as students.
c. Time of exploitation of Quan Lan Island Commune:
Quan Lan tourism is seasonal due to weather and climate conditions and festivals only take place on certain days of the year, specifically in spring. In Quan Lan commune, the period from April to June and from September to November is considered the best time to visit Quan Lan because the cultural tourism activities are mainly associated with festivals taking place during this time.
Minh Chau island commune:
Tourism exploitation time is all year round, because this is a place with a number of tourist attractions with diverse ecosystems such as Bai Tu Long National Park Research Center, Tram forest, Turtle Laying Beach, so besides coming to the beach for tourism and vacation in the summer, Minh Chau will attract research groups to come for tourism combined with research at other times of the year.
d. Sustainability
The sustainability of ecotourism sites in Quan Lan and Minh Chau communes depends on the sensitivity of the ecosystems to climate changes.
landscape. In general, these tourist destinations have a fairly high level of sustainability, because they are natural ecosystems, planned and protected. However, if a large number of tourists gather at certain times, it can exceed the carrying capacity and affect the sustainability of the environment (polluted beaches, damaged trees, animals moving away from their habitats, etc.), then the sustainability of the above ecosystems (natural ecosystems, human ecosystems) will also be affected and become less sustainable.
e. Location and accessibility
Both island communes have ports to take tourists to visit from Van Don wharf:
- Quan Lan – Van Don traffic route:
Phuc Thinh – Viet Anh high-speed boat and Quang Minh high-speed boat, depart at 8am and 2pm from Van Don to Quan Lan, and at 7am and 1pm from Quan Lan to Van Don. There are also wooden boats departing at 7am and 1pm.
- Van Don - Minh Chau traffic route:
Chung Huong high-speed train, Minh Chau train, morning 7:30 and afternoon 13:30 from Van Don to Minh Chau, morning 6:30 and afternoon 13:00 from Minh Chau to Van Don.
f. Infrastructure
Despite receiving investment attention, the issue of infrastructure and technical facilities for tourism on Quan Lan Island is still an issue that needs to be resolved because it has a direct impact on the implementation of ecotourism activities. The minimum conditions for serving tourists such as accommodation, electricity, water, communication, especially medical services, and security work need to be given top priority. Ecotourism spots in Minh Chau commune are assessed to have better infrastructure and technical facilities for tourism because there are quite complete and synchronous conditions for serving tourists, meeting many needs of domestic and foreign tourists.
3.2.1.4. Determine assessment levels and assessment scales
Corresponding to the levels of each criterion, the index is the score of those levels in the order of 4, 3, 2, 1 decreasing according to the standard of each level: very attractive (4), attractive (3), average (2), less attractive (1).
3.2.1.5. Determining the coefficients of the criteria
For the assessment of DLST in the two communes of Quan Lan and Minh Chau islands, the students added evaluation coefficients to show the importance of the criteria and indicators as follows:
Coefficient 3 with criteria: Attractiveness, Exploitation time. These are the 2 most important criteria for attracting tourists to tourism in general and eco-tourism in particular, so they have the highest coefficient.
Coefficient 2 with criteria: Capacity, Infrastructure, Location and accessibility . Because the assessment area is an island commune of Van Don district, the above criteria are selected by the author with appropriate coefficients at the average level.
Coefficient 1 with criteria: Sustainability. Quan Lan has natural and human-made ecotourism sites, with high biodiversity and little impact from local human factors. Most of the ecotourism sites are still wild, so they are highly sustainable.
3.2.1.6. Results of DLST assessment on Quan Lan island
a. Assessment of the potential for natural tourism development
For Minh Chau commune:
+ Natural tourism attractiveness is determined to be very attractive (4 points) and the most important coefficient (coefficient 3), so the score of the Attractiveness criterion is 4 x 3 = 12.
+ Capacity is determined as average (2 points) and the coefficient is quite important (coefficient 2), then the score of Capacity criterion is 2 x 2 = 4.
+ Exploitation time is long (4 points), the most important coefficient (coefficient 3) so the score of the Exploitation time criterion is 4 x 3 = 12.
+ Sustainability is determined as sustainable (4 points), the important coefficient is the average coefficient (coefficient 1), so the score of the Sustainability criterion is 4 x 1 = 4 points
+ Location and accessibility are determined to be quite favorable (2 points), the coefficient is quite important (coefficient 2), the criterion score is 2 x 2 = 4 points.
+ Infrastructure is assessed as good (3 points), the coefficient is quite important (coefficient 2), then the score of the Infrastructure criterion is 3 x 2 = 6 points.
The total score for evaluating DLST in Minh Chau commune according to 6 evaluation criteria is determined as: 12 + 4 + 12 + 4 + 4 + 6 = 42 points
Similar assessment for Quan Lan commune, we have the following table:
Table 3.3: Assessment of the potential for natural ecotourism development in Quan Lan and Minh Chau communes
Attractiveness of self-tourismof course
Capacity
Mining time
Sustainability
Location and accessibility
Infrastructure
Result
Point
DarkMulti
Point
DarkMulti
Point
DarkMulti
Point
DarkMulti
Point
DarkMulti
Point
DarkMulti
CommuneMinh Chau
12
12
4
8
12
12
4
4
4
8
6
8
42/52
Quan CommuneLan
6
12
6
8
9
12
4
4
4
8
4
8
33/52
b. Assessment of the potential for humanistic tourism development
For Quan Lan commune:
+ The attractiveness of human tourism is determined to be very attractive (4 points) and the most important coefficient (coefficient 3), so the score of the Attractiveness criterion is 4 x 3 = 12.
+ Capacity is determined to be large (3 points) and the coefficient is quite important (coefficient 2), then the score of the Capacity criterion is 3 x 2 = 6.
+ Mining time is average (3 points), the most important coefficient (coefficient 3) so the score of the Mining time criterion is 3 x 3 = 9.
+ Sustainability is determined as sustainable (4 points), the important coefficient is the average coefficient (coefficient 1), so the score of the Sustainability criterion is 4 x 1 = 4 points.
+ Location and accessibility are determined to be quite favorable (2 points), the coefficient is quite important (coefficient 2), the criterion score is 2 x 2 = 4 points.
+ Infrastructure is rated as average (2 points), the coefficient is quite important (coefficient 2), then the score of the Infrastructure criterion is 2 x 2 = 4 points.
The total score for evaluating DLST in Quan Lan commune according to 6 evaluation criteria is determined as: 12 + 6 + 6 + 4 + 4 + 4 = 36 points.
Similar assessment with Minh Chau commune we have the following table:
Table 3.4: Assessment of the potential for developing humanistic eco-tourism in Quan Lan and Minh Chau communes
Attractiveness of human tourismliterature
Capacity
Mining time
Sustainability
Location and accessibility
Infrastructure
Result
Point
DarkMulti
Point
DarkMulti
Point
DarkMulti
Point
DarkMulti
Point
DarkMulti
Point
DarkMulti
Quan CommuneLan
12
12
6
8
9
12
4
4
4
8
4
8
39/52
Minh CommuneChau
6
12
4
8
12
12
4
4
4
8
6
8
36/52
Basically, both Minh Chau and Quan Lan localities have quite favorable conditions for developing ecotourism. However, Quan Lan commune has more advantages to develop ecotourism in a humanistic direction, because this is an area with many famous historical relics such as Quan Lan Communal House, Quan Lan Pagoda, Temple worshiping the hero Tran Khanh Du, ... along with local festivals held annually such as the wind praying ceremony (March 15), Quan Lan festival (June 10-19); due to its location near the port and long exploitation time, the beaches in Quan Lan commune (especially Quan Lan beach) are no longer hygienic and clean to ensure the needs of tourists coming to relax and swim; this is also an area with many beautiful landscapes such as Got Beo wind pass, Ong Phong head, Voi Voi cave, but the ability to access these places is still very limited (dirt hill road, lots of gravel and rocks), especially during rainy and windy times; In addition, other natural resources such as mangrove forests and sea worms have not been really exploited for tourism purposes and ecotourism development. On the contrary, Minh Chau commune has more advantages in developing ecotourism in the direction of natural tourism, this is an area with diverse ecosystems such as at Rua De Beach, Bai Tu Long National Park Conservation Center...; Minh Chau beach is highly appreciated for its natural beauty and cleanliness, ranked in the top ten most beautiful beaches in Vietnam; Minh Chau commune is also home to Tram forest with a large area and a purity of up to 90%, suitable for building bridges through the forest (a very effective type of natural ecotourism currently applied by many countries) for tourists to sightsee, as well as for the purpose of studying and researching.
Figure 3.1: Thenmala Forest Bridge (India) Source: https://www.thenmalaecotourism.com/(August 21, 2019)
3.2.2. Using SWOT matrix to evaluate Quan Lan island tourism
General assessment of current tourism activities of Quan Lan island is shown through the following SWOT matrix:
Table 3.5: SWOT matrix evaluating tourism activities on Quan Lan island
Internal agent
Strengths- There is a lot of potential for tourism development, especially natural ecotourism and humanistic ecotourism.- The unskilled labor force is relatively abundant.- resource environmentunpolluted, still
Weaknesses- Poorly developed infrastructure, especially traffic routes to tourist destinations on the island.- The team of professional staff is still weak.- Tourism products in general
quite wild, originalintact
general and DLST in particularalone is monotonous.
External agents
Opportunity- Tourism is a key industry in the socio-economic development strategy of the province and Van Don economic zone.- Quan Lan was selected as a pilot area for eco-tourism development within the framework of the green growth project between Quang Ninh province and the Japanese organization JICA.- The flow of tourists and especially ecotourism in the world tends toincreasing
Challenge- Weather and climate change abnormally.- Competition in tourism products is increasingly fierce, especially with other localities in the province such as Ha Long, Mong Cai...- Awareness of tourists, especially domestic tourists, about ecotourism and nature conservation is not high.
Through summary analysis using SWOT matrix we see that:
To exploit strengths and take advantage of opportunities, it is necessary to:
- Diversify products and service types (build more tourism routes aimed at specific needs of tourists: experiential tourism immersed in nature, spiritual cultural tourism...)
- Effective exploitation of resources and differentiated products (natural resources and human resources)
div.maincontent .p { color: black; font-family:"Times New Roman", serif; font-style: normal; font-weight: normal; text-decoration: none; font-size: 14pt; margin:0pt; } div.maincontent p { color: black; font-family:"Times New Roman", serif; font-style: normal; font-weight: normal; text-decoration: none; font-size: 14pt; margin:0pt; } div.maincontent .s1 { color: black; font-family:"Times New Roman", serif; font-style: normal; font-weight: normal; text-decoration: none; font-size: 13pt; } div.maincontent .s2 { color: black; font-family:"Times New Roman", serif; font-style: normal; font-weight: normal; text-decoration: none; font-size: 13pt; } div.maincontent .s3 { color: #0D0D0D; font-family:"Times New Roman", serif; font-style: normal; font-weight: bold; text-decoration: none; font-size: 14pt; } div.maincontent .s4 { color: black; font-family:"Times New Roman", serif; font-style: italic; font-weight: normal; text-decoration: none; font-size: 14pt; } div.maincontent .s5 { color: black; font-family:"Times New Roman", serif; font-style: italic; font-weight: bold; text-decoration: none; font-size: 14pt; } div.maincontent .s6 { color: black; font-family:"Times New Roman", serif; font-style: italic; font-weight: normal; text-decoration: none; font-size: 14pt; vertical-align: -3pt; } div.maincontent .s7 { color: black; font-family:"Times New Roman", serif; font-style: italic; font-weight: normal; text-decoration: none; font-size: 14pt; vertical-align: -2pt; } div.maincontent .s8 { color: black; font-family:"Times New Roman", serif; font-style: italic; font-weight: normal; text-decoration: none; font-size: 14pt; vertical-align: -1pt; } div.maincontent .s9 { color: black; font-family:"Times New Roman", serif; font-style: normal; font-weight: normal; text-decoration: none; font-size: 14pt; } div.maincontent .s10 { color: black; font-family:"Times New Roman", serif; font-style: normal; font-weight: bold; text-decoration: none; font-size: 14pt; } div.maincontent .s11 { color: black; font-family:"Times New Roman", serif; font-style: normal; font-weight: normal; text-decoration: none; font-size: 14pt; } div.maincontent .s12 { color: black; font-family:Symbol, serif; font-style: normal; font-weight: normal; text-decoration: none; font-size: 14pt; } div.maincontent .s13 { color: black; font-family:Wingdings; font-style: normal; font-weight: normal; text-decoration: none; font-size: 14pt; } div.maincontent .s14 { color: black; font-family:"Times New Roman", serif; font-style: normal; font-weight: normal; text-decoration: none; font-size: 9pt; vertical-align: 5pt; } div.maincontent .s15 { color: black; font-family:"Times New Roman", serif; font-style: normal; font-weight: normal; text-decoration: none; font-size: 9pt; vertical-align: 5pt; } div.maincontent .s16 { color: black; font-family:Cambria, serif; font-style: italic; font-weight: normal; text-decoration: none; font-size: 14pt; } div.maincontent .s17 { color: #080808; font-family:"Times New Roman", serif; font-style: normal; font-weight: bold; text-decoration: none; font-size: 14pt; } div.maincontent .s18 { color: #080808; font-family:"Times New Roman", serif; font-style: normal; font-weight: normal; text-decoration: none; font-size: 14pt; } div.maincontent .s19 { color: black; font-family:"Times New Roman", serif; font-style: normal; font-weight: normal; text-decoration: none; font-size: 11pt; } div.maincontent .s20 { color: black; font-family:"Times New Roman", serif; font-style: normal; font-weight: normal; text-decoration: none; font-size: 10pt; } div.maincontent .s21 { color: black; font-family:"Times New Roman", serif; font-style: normal; font-weight: bold; text-decoration: none; font-size: 11pt; } div.maincontent .s22 { color: black; font-family:"Times New Roman", serif; font-style: normal; font-weight: normal; text-decoration: none; font-size: 11pt; } div.maincontent .s23 { color: black; font-family:"Times New Roman", serif; font-style: italic; font-weight: normal; text-decoration: none; font-size: 14pt; } div.maincontent .s24 { color: #212121; font-family:"Times New Roman", serif; font-style: normal; font-weight: normal; tex
Identify Rating Levels and Rating Scales
zt2i3t4l5ee
zt2a3gstourism,quan lan,quang ninh,ecology,ecotourism,minh chau,van don,geography,geographical basis,tourism development,science
zt2a3ge
zc2o3n4t5e6n7ts
of the islanders. Therefore, this indicator will be divided into two sub-indicators:
a1. Natural tourism attractiveness a2. Cultural tourism attractiveness
b. Tourist capacity
The two island communes in Quan Lan have different capacities to receive tourists. Minh Chau Commune is home to many standard hotels and resorts, attracting high-income domestic and international tourists. Meanwhile, Quan Lan Commune has many motels mainly built and operated by local people, so the scale and quality are not high, and will be suitable for ordinary tourists such as students.
c. Time of exploitation of Quan Lan Island Commune:
Quan Lan tourism is seasonal due to weather and climate conditions and festivals only take place on certain days of the year, specifically in spring. In Quan Lan commune, the period from April to June and from September to November is considered the best time to visit Quan Lan because the cultural tourism activities are mainly associated with festivals taking place during this time.
Minh Chau island commune:
Tourism exploitation time is all year round, because this is a place with a number of tourist attractions with diverse ecosystems such as Bai Tu Long National Park Research Center, Tram forest, Turtle Laying Beach, so besides coming to the beach for tourism and vacation in the summer, Minh Chau will attract research groups to come for tourism combined with research at other times of the year.
d. Sustainability
The sustainability of ecotourism sites in Quan Lan and Minh Chau communes depends on the sensitivity of the ecosystems to climate changes.
landscape. In general, these tourist destinations have a fairly high level of sustainability, because they are natural ecosystems, planned and protected. However, if a large number of tourists gather at certain times, it can exceed the carrying capacity and affect the sustainability of the environment (polluted beaches, damaged trees, animals moving away from their habitats, etc.), then the sustainability of the above ecosystems (natural ecosystems, human ecosystems) will also be affected and become less sustainable.
e. Location and accessibility
Both island communes have ports to take tourists to visit from Van Don wharf:
- Quan Lan – Van Don traffic route:
Phuc Thinh – Viet Anh high-speed boat and Quang Minh high-speed boat, depart at 8am and 2pm from Van Don to Quan Lan, and at 7am and 1pm from Quan Lan to Van Don. There are also wooden boats departing at 7am and 1pm.
- Van Don - Minh Chau traffic route:
Chung Huong high-speed train, Minh Chau train, morning 7:30 and afternoon 13:30 from Van Don to Minh Chau, morning 6:30 and afternoon 13:00 from Minh Chau to Van Don.
f. Infrastructure
Despite receiving investment attention, the issue of infrastructure and technical facilities for tourism on Quan Lan Island is still an issue that needs to be resolved because it has a direct impact on the implementation of ecotourism activities. The minimum conditions for serving tourists such as accommodation, electricity, water, communication, especially medical services, and security work need to be given top priority. Ecotourism spots in Minh Chau commune are assessed to have better infrastructure and technical facilities for tourism because there are quite complete and synchronous conditions for serving tourists, meeting many needs of domestic and foreign tourists.
3.2.1.4. Determine assessment levels and assessment scales
Corresponding to the levels of each criterion, the index is the score of those levels in the order of 4, 3, 2, 1 decreasing according to the standard of each level: very attractive (4), attractive (3), average (2), less attractive (1).
3.2.1.5. Determining the coefficients of the criteria
For the assessment of DLST in the two communes of Quan Lan and Minh Chau islands, the students added evaluation coefficients to show the importance of the criteria and indicators as follows:
Coefficient 3 with criteria: Attractiveness, Exploitation time. These are the 2 most important criteria for attracting tourists to tourism in general and eco-tourism in particular, so they have the highest coefficient.
Coefficient 2 with criteria: Capacity, Infrastructure, Location and accessibility . Because the assessment area is an island commune of Van Don district, the above criteria are selected by the author with appropriate coefficients at the average level.
Coefficient 1 with criteria: Sustainability. Quan Lan has natural and human-made ecotourism sites, with high biodiversity and little impact from local human factors. Most of the ecotourism sites are still wild, so they are highly sustainable.
3.2.1.6. Results of DLST assessment on Quan Lan island
a. Assessment of the potential for natural tourism development
For Minh Chau commune:
+ Natural tourism attractiveness is determined to be very attractive (4 points) and the most important coefficient (coefficient 3), so the score of the Attractiveness criterion is 4 x 3 = 12.
+ Capacity is determined as average (2 points) and the coefficient is quite important (coefficient 2), then the score of Capacity criterion is 2 x 2 = 4.
+ Exploitation time is long (4 points), the most important coefficient (coefficient 3) so the score of the Exploitation time criterion is 4 x 3 = 12.
+ Sustainability is determined as sustainable (4 points), the important coefficient is the average coefficient (coefficient 1), so the score of the Sustainability criterion is 4 x 1 = 4 points
+ Location and accessibility are determined to be quite favorable (2 points), the coefficient is quite important (coefficient 2), the criterion score is 2 x 2 = 4 points.
+ Infrastructure is assessed as good (3 points), the coefficient is quite important (coefficient 2), then the score of the Infrastructure criterion is 3 x 2 = 6 points.
The total score for evaluating DLST in Minh Chau commune according to 6 evaluation criteria is determined as: 12 + 4 + 12 + 4 + 4 + 6 = 42 points
Similar assessment for Quan Lan commune, we have the following table:
Table 3.3: Assessment of the potential for natural ecotourism development in Quan Lan and Minh Chau communes
Attractiveness of self-tourismof course
Capacity
Mining time
Sustainability
Location and accessibility
Infrastructure
Result
Point
DarkMulti
Point
DarkMulti
Point
DarkMulti
Point
DarkMulti
Point
DarkMulti
Point
DarkMulti
CommuneMinh Chau
12
12
4
8
12
12
4
4
4
8
6
8
42/52
Quan CommuneLan
6
12
6
8
9
12
4
4
4
8
4
8
33/52
b. Assessment of the potential for humanistic tourism development
For Quan Lan commune:
+ The attractiveness of human tourism is determined to be very attractive (4 points) and the most important coefficient (coefficient 3), so the score of the Attractiveness criterion is 4 x 3 = 12.
+ Capacity is determined to be large (3 points) and the coefficient is quite important (coefficient 2), then the score of the Capacity criterion is 3 x 2 = 6.
+ Mining time is average (3 points), the most important coefficient (coefficient 3) so the score of the Mining time criterion is 3 x 3 = 9.
+ Sustainability is determined as sustainable (4 points), the important coefficient is the average coefficient (coefficient 1), so the score of the Sustainability criterion is 4 x 1 = 4 points.
+ Location and accessibility are determined to be quite favorable (2 points), the coefficient is quite important (coefficient 2), the criterion score is 2 x 2 = 4 points.
+ Infrastructure is rated as average (2 points), the coefficient is quite important (coefficient 2), then the score of the Infrastructure criterion is 2 x 2 = 4 points.
The total score for evaluating DLST in Quan Lan commune according to 6 evaluation criteria is determined as: 12 + 6 + 6 + 4 + 4 + 4 = 36 points.
Similar assessment with Minh Chau commune we have the following table:
Table 3.4: Assessment of the potential for developing humanistic eco-tourism in Quan Lan and Minh Chau communes
Attractiveness of human tourismliterature
Capacity
Mining time
Sustainability
Location and accessibility
Infrastructure
Result
Point
DarkMulti
Point
DarkMulti
Point
DarkMulti
Point
DarkMulti
Point
DarkMulti
Point
DarkMulti
Quan CommuneLan
12
12
6
8
9
12
4
4
4
8
4
8
39/52
Minh CommuneChau
6
12
4
8
12
12
4
4
4
8
6
8
36/52
Basically, both Minh Chau and Quan Lan localities have quite favorable conditions for developing ecotourism. However, Quan Lan commune has more advantages to develop ecotourism in a humanistic direction, because this is an area with many famous historical relics such as Quan Lan Communal House, Quan Lan Pagoda, Temple worshiping the hero Tran Khanh Du, ... along with local festivals held annually such as the wind praying ceremony (March 15), Quan Lan festival (June 10-19); due to its location near the port and long exploitation time, the beaches in Quan Lan commune (especially Quan Lan beach) are no longer hygienic and clean to ensure the needs of tourists coming to relax and swim; this is also an area with many beautiful landscapes such as Got Beo wind pass, Ong Phong head, Voi Voi cave, but the ability to access these places is still very limited (dirt hill road, lots of gravel and rocks), especially during rainy and windy times; In addition, other natural resources such as mangrove forests and sea worms have not been really exploited for tourism purposes and ecotourism development. On the contrary, Minh Chau commune has more advantages in developing ecotourism in the direction of natural tourism, this is an area with diverse ecosystems such as at Rua De Beach, Bai Tu Long National Park Conservation Center...; Minh Chau beach is highly appreciated for its natural beauty and cleanliness, ranked in the top ten most beautiful beaches in Vietnam; Minh Chau commune is also home to Tram forest with a large area and a purity of up to 90%, suitable for building bridges through the forest (a very effective type of natural ecotourism currently applied by many countries) for tourists to sightsee, as well as for the purpose of studying and researching.
Figure 3.1: Thenmala Forest Bridge (India) Source: https://www.thenmalaecotourism.com/(August 21, 2019)
3.2.2. Using SWOT matrix to evaluate Quan Lan island tourism
General assessment of current tourism activities of Quan Lan island is shown through the following SWOT matrix:
Table 3.5: SWOT matrix evaluating tourism activities on Quan Lan island
Internal agent
Strengths- There is a lot of potential for tourism development, especially natural ecotourism and humanistic ecotourism.- The unskilled labor force is relatively abundant.- resource environmentunpolluted, still
Weaknesses- Poorly developed infrastructure, especially traffic routes to tourist destinations on the island.- The team of professional staff is still weak.- Tourism products in general
quite wild, originalintact
general and DLST in particularalone is monotonous.
External agents
Opportunity- Tourism is a key industry in the socio-economic development strategy of the province and Van Don economic zone.- Quan Lan was selected as a pilot area for eco-tourism development within the framework of the green growth project between Quang Ninh province and the Japanese organization JICA.- The flow of tourists and especially ecotourism in the world tends toincreasing
Challenge- Weather and climate change abnormally.- Competition in tourism products is increasingly fierce, especially with other localities in the province such as Ha Long, Mong Cai...- Awareness of tourists, especially domestic tourists, about ecotourism and nature conservation is not high.
Through summary analysis using SWOT matrix we see that:
To exploit strengths and take advantage of opportunities, it is necessary to:
- Diversify products and service types (build more tourism routes aimed at specific needs of tourists: experiential tourism immersed in nature, spiritual cultural tourism...)
- Effective exploitation of resources and differentiated products (natural resources and human resources)
div.maincontent .p { color: black; font-family:"Times New Roman", serif; font-style: normal; font-weight: normal; text-decoration: none; font-size: 14pt; margin:0pt; } div.maincontent p { color: black; font-family:"Times New Roman", serif; font-style: normal; font-weight: normal; text-decoration: none; font-size: 14pt; margin:0pt; } div.maincontent .s1 { color: black; font-family:"Times New Roman", serif; font-style: normal; font-weight: normal; text-decoration: none; font-size: 13pt; } div.maincontent .s2 { color: black; font-family:"Times New Roman", serif; font-style: normal; font-weight: normal; text-decoration: none; font-size: 13pt; } div.maincontent .s3 { color: #0D0D0D; font-family:"Times New Roman", serif; font-style: normal; font-weight: bold; text-decoration: none; font-size: 14pt; } div.maincontent .s4 { color: black; font-family:"Times New Roman", serif; font-style: italic; font-weight: normal; text-decoration: none; font-size: 14pt; } div.maincontent .s5 { color: black; font-family:"Times New Roman", serif; font-style: italic; font-weight: bold; text-decoration: none; font-size: 14pt; } div.maincontent .s6 { color: black; font-family:"Times New Roman", serif; font-style: italic; font-weight: normal; text-decoration: none; font-size: 14pt; vertical-align: -3pt; } div.maincontent .s7 { color: black; font-family:"Times New Roman", serif; font-style: italic; font-weight: normal; text-decoration: none; font-size: 14pt; vertical-align: -2pt; } div.maincontent .s8 { color: black; font-family:"Times New Roman", serif; font-style: italic; font-weight: normal; text-decoration: none; font-size: 14pt; vertical-align: -1pt; } div.maincontent .s9 { color: black; font-family:"Times New Roman", serif; font-style: normal; font-weight: normal; text-decoration: none; font-size: 14pt; } div.maincontent .s10 { color: black; font-family:"Times New Roman", serif; font-style: normal; font-weight: bold; text-decoration: none; font-size: 14pt; } div.maincontent .s11 { color: black; font-family:"Times New Roman", serif; font-style: normal; font-weight: normal; text-decoration: none; font-size: 14pt; } div.maincontent .s12 { color: black; font-family:Symbol, serif; font-style: normal; font-weight: normal; text-decoration: none; font-size: 14pt; } div.maincontent .s13 { color: black; font-family:Wingdings; font-style: normal; font-weight: normal; text-decoration: none; font-size: 14pt; } div.maincontent .s14 { color: black; font-family:"Times New Roman", serif; font-style: normal; font-weight: normal; text-decoration: none; font-size: 9pt; vertical-align: 5pt; } div.maincontent .s15 { color: black; font-family:"Times New Roman", serif; font-style: normal; font-weight: normal; text-decoration: none; font-size: 9pt; vertical-align: 5pt; } div.maincontent .s16 { color: black; font-family:Cambria, serif; font-style: italic; font-weight: normal; text-decoration: none; font-size: 14pt; } div.maincontent .s17 { color: #080808; font-family:"Times New Roman", serif; font-style: normal; font-weight: bold; text-decoration: none; font-size: 14pt; } div.maincontent .s18 { color: #080808; font-family:"Times New Roman", serif; font-style: normal; font-weight: normal; text-decoration: none; font-size: 14pt; } div.maincontent .s19 { color: black; font-family:"Times New Roman", serif; font-style: normal; font-weight: normal; text-decoration: none; font-size: 11pt; } div.maincontent .s20 { color: black; font-family:"Times New Roman", serif; font-style: normal; font-weight: normal; text-decoration: none; font-size: 10pt; } div.maincontent .s21 { color: black; font-family:"Times New Roman", serif; font-style: normal; font-weight: bold; text-decoration: none; font-size: 11pt; } div.maincontent .s22 { color: black; font-family:"Times New Roman", serif; font-style: normal; font-weight: normal; text-decoration: none; font-size: 11pt; } div.maincontent .s23 { color: black; font-family:"Times New Roman", serif; font-style: italic; font-weight: normal; text-decoration: none; font-size: 14pt; } div.maincontent .s24 { color: #212121; font-family:"Times New Roman", serif; font-style: normal; font-weight: normal; tex
Source: [25]
Second, the TSC mechanism is not profitable.
Agribank's non-profitable assets are shown in the following indicators: Cash position index, treasury position, liquid securities index, proportion of fixed assets and other assets.
- Cash position and treasury position index
Table 2.2 shows that Agribank's cash position index has fluctuated slightly, generally being relatively stable over the years. As we know, cash is the most liquid asset to meet customers' withdrawal needs and the bank's own spending, but this is a non-profitable asset, so cash reserves need to be maintained at a reasonable level, according to Basel regulations (BCBS) - principles for strengthening corporate governance in banks, October 2010, the cash index should be in the range of 2-3%. Compared to this level, Agribank has maintained cash at a low level, which will increase the bank's profitability, but whether it affects the ability to pay or not depends on how much the bank holds other cash equivalents.
Specifically, we will consider the bank's treasury index. In contrast to the cash index, Agribank's treasury index has large fluctuations during times of liquidity stress and the general trend is to decrease over the years, especially sharply in 2010 and 2011. This is due to changes in Agribank's treasury structure. Table 2.8 shows that deposits at the State Bank always account for a large proportion of the bank's treasury. However, this component also has sharp fluctuations and declines during periods when the bank has liquidity difficulties and capital mobilization declines.
Table 2.8. Agribank's treasury structure
Unit: %
Target
2008 | 2009 | 2010 | 2011 | 2012 | 2013 | 2014 | |
Cash | 16.0 | 14.5 | 34.1 | 27.7 | 15.3 | 21.4 | 37.8 |
TG KKH at other credit institutions | 6.35 | 11.05 | 13.89 | 11.90 | 2.71 | 3.65 | 3.87 |
Payment period at the State Bank | 77.63 | 74.47 | 51.99 | 60.38 | 81.97 | 74.92 | 58.33 |
Total budget | 36419 | 45832 | 22631 | 28886 | 49554 | 41698 | 28183 |
Source: [25]
According to the Regulation on Compulsory Reserves issued by the State Bank, credit institutions must maintain compulsory reserves on payment deposit accounts at the State Bank and according to the principle that the average balance of payment deposit accounts during the period of maintaining compulsory reserves is not lower than the compulsory reserve in the period. The compulsory reserve in the period is calculated on the basis of the average mobilized deposit balance of each type of deposit subject to compulsory reserves at the Head Office and branches of the credit institution during the period of determining compulsory reserves and the corresponding compulsory reserve ratio prescribed by the Governor of the State Bank for each period. In reality, credit institutions in general and Agribank in particular often maintain balances on payment deposit accounts at the State Bank and sufficient compulsory reserves according to the regulations of the State Bank. So the sharp decline in deposits at the State Bank in 2010 and 2011, both in absolute and relative terms, at a faster rate than the increase of the remaining components, caused the treasury index to decline sharply, which can be explained by the sharp decline in mobilized capital (Chart 2.1) - the subject of compulsory reserves according to the State Bank's regulations in 2010 and 2011.
- Liquidity stock index
The calculation results in Tables 2.2 and 2.9 show that Agribank's liquidity index remained low and decreased sharply in 2009 and 2010, then gradually increased but was still lower than in 2008. In 2009, Agribank no longer held SBV bills but mainly held government bonds and treasury bills, which are securities with the lowest risk and highest liquidity among all types of securities, but they often have low interest rates.
Table 2.9. Liquidity stock index
Unit: Billion VND
Target
2008 | 2009 | 2010 | 2011 | 2012 | 2013 | 2014 | |
State Bank Bills | 8773 | 0 | 0 | 0 | 0 | 0 | 0 |
KB bills | 9463 | 2701 | 3162 | 614 | 978 | 867 | 0 |
CP Securities | 14453 | 15111 | 16743 | 26768 | 30712 | 33987 | 30255 |
Total assets | 391520 | 466020 | 519759 | 558371 | 612905 | 693355 | 794414 |
Liquidity Index ( ) | 8.35 | 3.82 | 3.83 | 4.88 | 5.17 | 5.03 | 3.81 |
Source: [25]
Agribank's liquidity index has decreased over the years, although it may increase the profitability of assets, on the other hand, it will affect the initiative in finding sources to compensate for liquidity shortages.
- Fixed assets ratio
The proportion of Agribank's fixed assets tends to increase over the years but not strongly and accounts for a small proportion of total assets, increasing from 0.9 in 2008 to 1.3 in 2013 (Table 2.2). This shows that Agribank has also paid attention to investing in facilities to serve the bank's business activities and has control and management within the permitted limits to increase the efficiency of using fixed assets in particular and assets in general of the bank.
- Other TSC density
Agribank's other assets account for a small proportion and tend to decrease over time.
t from 3.1 in 2008 to 2.9 in 2014 shows that the bank has increased the collection of receivables, reduced capital appropriation, contributing to making the bank's asset structure more reasonable.
Third, asset utilization efficiency
Table 2.2 also shows that the efficiency of using assets of Agribank is not high, shown in the income indicators of profitable assets/profitable assets and operating income/assets both decreasing over the years. It is worth noting that the ratio of operating income/assets is always greater than the ratio of profitable assets/profitable assets, showing that the efficiency of using profitable assets is not high, which also reflects that the asset structure is not reasonable.
Correlation between TSC and TSN
In the process of implementing LM, gribank has also paid attention to ensuring the correlation between TSC and TSN, which is reflected in setting out planning indicators on capital mobilization and capital use and based on the actual situation to adjust the structure of TSC and TSN appropriately to ensure the regulations of the State Bank, ensuring profit and safety targets. The results of adjusting this correlation are reflected in the following basic indicators:
- Ratio of profitable assets/mobilized capital
Table 2.10. Ratio of profitable assets/mobilized capital
Unit: Billion VND
Target
2008 | 2009 | 2010 | 2011 | 2012 | 2013 | 2014 | |
Profitable TSC | 328109 | 390373 | 447043 | 471873 | 524178 | 611484 | 722015 |
Capital mobilized | 352405 | 426140 | 464963 | 491264 | 527787 | 603709 | 700124 |
Profitable assets/Working capital (%) | 93.11 | 91.61 | 96.15 | 96.05 | 99.32 | 101.29 | 103.13 |
Average interest rate | 5.06 | 3.89 | 4.21 | 5.43 | 4.78 | 3.14 | 3.14 |
Source: [25]
Table 2.10 shows that the ratio of profitable assets/mobilized capital tends to increase rapidly over the years, even reaching over 100 in 2013 and 2014, which proves that Agribank has fully utilized mobilized capital to invest in assets to bring in profits.
income to offset the cost of capital. However, the average interest rate difference tends to decrease, showing that the balance between assets and liabilities is not reasonable.
- Loan balance ratio/Mobilized capital
As shown in Table 2.2, loans are the asset that accounts for the largest proportion of Agribank's total assets and is also the asset that generates the main income for the bank. This asset is financed by mobilized capital. In fact, Agribank has balanced loans and mobilized capital based on the growth target of mobilized capital to decide on the growth target of outstanding loans.
Table 2.11. Credit to capital mobilization ratio
Unit: Billion VND
Target
2008 | 2009 | 2010 | 2011 | 2012 | 2013 | 2014 | |
Outstanding Loans | 287198 | 361661 | 422005 | 449945 | 476215 | 533147 | 600378 |
Capital mobilized | 352405 | 426140 | 464963 | 491264 | 527787 | 603709 | 700124 |
Outstanding loans/Working capital ( ) | 81.50 | 84.87 | 90.76 | 91.59 | 90.23 | 88.31 | 85.75 |
TD granting rate in VND (%) | 82.4 | 89.5 | 91.6 | 92.7 | 90.7 | 88.5 | 85.1 |
Rate of foreign currency credit (%) | 73.7 | 54.6 | 83.7 | 78.2 | 83.1 | 83.7 | 98.1 |
Source: [25]
Table 2.11 shows that the credit granting ratio of Agribank's mobilized capital tends to increase over the years with a very large number (over 81 to over 91), which shows that mobilized capital is mainly used for credit granting, on the one hand proving that Agribank has expanded lending to serve the economy, but on the other hand also showing that capital mobilization still has limitations, especially capital mobilization in foreign currency in the past 3 years has tended to decrease, causing the credit granting ratio in foreign currency to increase significantly. However, the actual credit quality is not as high as analyzed in Table 2.4, which will reduce the efficiency of capital use of the bank, reducing the liquidity of assets. Realizing that, Agribank has gradually adjusted to narrow the credit granting/mobilized capital ratio and this ratio has tended to decrease since 2013.
here, however, is still at a relatively high level.
Profitability
Profitability can be assessed through the net interest margin (NIM). Table 2.12 shows that Agribank's net interest margin (NIM) is unstable and has been on a sharp downward trend in the past 3 years, meaning that the growth rate of net interest income is not commensurate with the growth rate of assets.
This is explained by two basic reasons: the profitability - generating income - of assets has decreased, although the proportion of profitable assets has tended to increase as analyzed in Table 2.2; in terms of asset structure, Agribank has not exploited low-cost capital sources in market 1, so it has to increase borrowing in market 2, leading to increased interest expenses, that is, interest expenses to finance assets increase while income generated from assets decreases, causing NIM to decrease.
Table 2.12. Agribank's marginal interest income
Unit: Billion VND
Target
2008 | 2009 | 2010 | 2011 | 2012 | 2013 | 2014 | |
Interest income | 42185 | 41778 | 53484 | 67628 | 64298 | 52132 | 57541 |
Interest expense | 29900 | 30118 | 36623 | 44430 | 41427 | 34191 | 35790 |
Assets | 391520 | 466020 | 519759 | 558371 | 612905 | 693355 | 794414 |
Average TSC | 352453 | 428770 | 492889.5 | 539065 | 585638 | 653130 | 743885 |
NIM (%) | 3.49 | 2.72 | 3.42 | 4.30 | 3.91 | 2.75 | 2.92 |
Source: [25]
2.2.2.2. Liquidity risk management of Agribank
Through the analysis of the structure of Agribank's assets and liabilities above, it can be seen that Agribank's liquidity has also had difficult periods. Although it has not yet fallen into crisis, Agribank has had to incur costly expenses to maintain it. To demonstrate this, we can consider the following two aspects: How are liquidity indicators maintained? How do market signals reflect the bank's liquidity?
a. Liquidity indicators of Agribank
With the current information system and database of Agribank, it is enough to apply the method to evaluate liquidity, which is the liquidity index method, but it does not meet the conditions to use the modern method, which is the maturity ladder method. The results of liquidity risk management are shown in the following indicators:
- The indicators of capital structure and assets reflect the liquidity of Agribank:
As analyzed in section 2.2.2.1, these indicators include: deposit structure index (chart 2.3 and chart 2.6), cash status index, treasury status index; liquid securities index and loan/total assets ratio (table 2.2). Thereby, it shows that in difficult periods of liquidity of Agribank, it is mainly due to unreasonable structure of assets and liabilities. The loan ratio is too high while credit quality seriously declines, reducing Agribank's liquidity. Meanwhile, mobilization in market 1 encounters many difficulties, leading Agribank to mobilize in market 2. Chart 2.3 shows that the mobilization ratio in market 2, although a modest number, tends to increase over the years. Obviously, excessive credit expansion, not commensurate with the growth rate of capital mobilization, leads to liquidity tensions, forcing Agribank to borrow more in market 2, thereby changing Agribank's "net position" in market 2.
First, consider the net position index of Agribank with respect to other credit institutions. This index is calculated as the difference between “deposits at and loans to other credit institutions” and “deposits from and loans to other credit institutions”. If this index is positive, it shows that Agribank deposits and lends more to other credit institutions than borrows from other credit institutions and vice versa.
Looking at chart 2.12, we see that Agribank's net position with other credit institutions has fluctuated over the quarters during the period but in general it has tended to increase, meaning it has shifted from being a "borrower" (quarter 4/08, quarter 2/09 - quarter 4/09) to being a "lender" for other credit institutions, which clearly shows the role of Agribank.
Agribank's role is to be a strong and prestigious bank in the interbank market.
50000
40000
30000
20000
10000
0
-10000
-20000
-30000
Q4/0 Q1/0 Q2/0 Q3/0 Q4/0 Q1/1 Q2/1 Q3/1 Q4/1 Q1/1 Q2/1 Q3/1 Q4/1 Q1/1 Q2/1 Q3/1 Q4/ 1 Q1/1 Q2/1 Q3/1 Q4/1
8 9 9 9 9 0 0 0 0 1 1 1 1 2 2 2 2 3 3 3 3
Net position with TCTD ≠ -1083 7088 -1409 -9423 -1850 7377 10280 15181 20959 21724 9994 16110 8871 9802 6613 5651 10254 9485 9503 6933 16340
Net position on TT 2 27165 44246 17479 2034 7616 15683 21615 34975 11793 4331 -566 12685 -6937 -6004 12788 19985 28145 16137 21514 25009 29232
T copper
Chart 2.12. Agribank's net position
Source: [31]
However, if we consider the net position index in market 2 of Agribank, there is a downward trend. The net position in market 2 here is determined to include the net position with other credit institutions and transactions with the State Bank, that is, the difference between "deposits at the State Bank, deposits and loans to other credit institutions" and "borrowing from the State Bank and deposits and loans from other credit institutions". Thus, if this position is positive, it reflects that the bank uses more capital than mobilizes capital in market 2 and vice versa, if this position is negative, it means that the bank mobilizes more capital in market 2, which also reflects the bank's liquidity in a state of tension.
Chart 2.12 also shows that although Agribank's net position in market 2 is mainly positive, there is a relatively large level of fluctuation between quarters of the year and a tendency to decrease, even at times decreasing to negative levels such as in the second quarter of 2011 and the fourth quarter of 2011. At times from the third quarter of 2010 and earlier, we can see that the graph line representing Agribank's net position in market 2 is above the net position line for other credit institutions, which means that Agribank's transactions with the State Bank are always in a positive position. However, from the fourth quarter of 2010 to the first quarter of 2012
The net position in market 2 is lower than the net position with other credit institutions, which means that Agribank borrows more from the State Bank while with other credit institutions, Agribank is still in the position of a lender. That shows that Agribank's capital balance is not good, but it also shows that Agribank's ability to access capital from the State Bank is very large. From the second quarter of 2012 until now, transactions with other credit institutions and with the State Bank are all in a positive state, showing that Agribank's liquidity is no longer in a tense state.
- Net loans/Total deposits
Table 2.13 shows that Agribank invested in lending activities at a very high level, even too much in the years 2009-2011, which affected the bank's liquidity, especially in the condition that the bank's bad debt had not been resolved as analyzed in Table 2.4 and Chart 2.11.
Table 2.13. Net loans/total deposits ratio
Unit: Billion VND
Target
2008 | 2009 | 2010 | 2011 | 2012 | 2013 | 2014 | |
Net lending | 278288 | 356963 | 413451 | 429264 | 454810 | 521703 | 569792 |
Deposit | 316197 | 358084 | 400070 | 423332 | 507865 | 590911 | 662046 |
Net CV/Deposits (%) | 88.01 | 99.69 | 103.34 | 101.40 | 89.55 | 88.29 | 86.07 |
Source: [25]
- Affordability ratio
During the research period of the thesis (2008-2014), the solvency ratios prescribed by the State Bank of Vietnam changed according to two documents of the State Bank of Vietnam, namely Decision 457/2005/QD-NHNN dated April 19, 2005, promulgating "Regulations on safety ratios in the operations of credit institutions" and Circular 13/2010/TT-NHNN dated May 20, 2010, promulgating "Regulations on safety ratios in the operations of credit institutions", effective from October 1, 2010. According to these two documents, commercial banks must ensure two solvency ratios: the solvency ratio of the next day and the solvency ratio of the next 7 days.
+ Next day solvency ratio:
The assessment of Agribank's compliance with the next-day solvency ratio will be divided into 2 stages: Stage 1 from 2008 to the end of September 2010 and Stage 2 from October 2010 to the end of 2014. Data is taken at the reporting times of the last day of the month shown in Chart 2.13.
Chart 2.13. Agribank's next-day solvency ratio
Unit: %
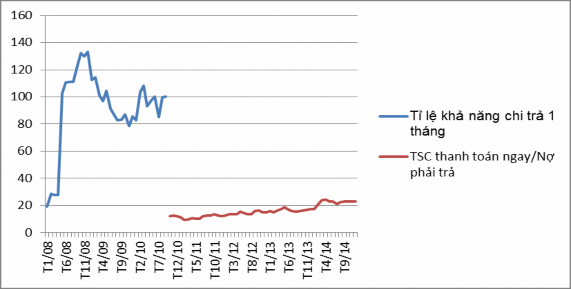
Source: Agribank's liquidity indicators report
Looking at chart 2.13, we can see that the monthly solvency ratio according to Decision 457, which stipulates a minimum level of 25, has been well complied with by Agribank, even far exceeding the level prescribed by the State Bank, at times reaching 133. However, when it came to the stage of applying Circular 13/2010/TT-NHNN in October 2010 of the State Bank, which stipulates that the ratio of immediately payable assets calculated on total payable debts must be at least 15%, Agribank did not achieve it. This ratio was always lower than 15 and often fluctuated between 10 and 13 until the end of September 2012.
One of the reasons here is the way these indicators are calculated. Both of these indicators are calculated as a ratio between immediately payable assets, that is, the numerator is "immediately payable assets", but according to Decision 457/2005/QD-NHNN, it is calculated on payable assets within 1 month, while according to Circular 13/2010/TT-NHNN, it is calculated on immediately payable assets within 1 month.
on Total liabilities, so these two indexes have very different denominators (that's why the minimum level is different). But more importantly, there are also differences in the "Immediately payable" component of these two indexes. Basically, according to Decision 457/2005/QD-NHNN, "Immediately payable" takes into account secured and unsecured loans due within 1 month, bills of exchange of export payment certificates accepted for payment by foreign banks, with a remaining term of 01 month or less, receivables due, while these components are not included in "Immediately payable" according to Circular 13/2010/TT-NHNN.
Chart 2.14. One-month solvency ratio of the State-owned commercial bank sector
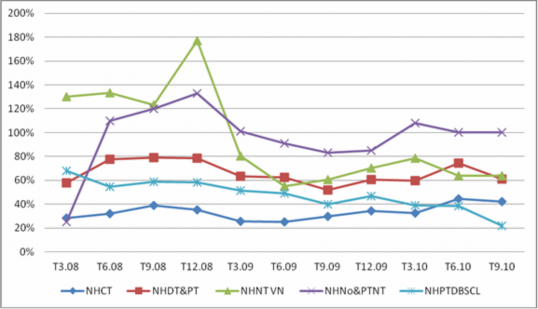
Source: Report on liquidity indicators of banks
For Agribank, as seen, the bank's asset structure is mainly loans while the treasury ratio and the liquid securities ratio are both low, leading to "immediately payable assets" if calculated according to Decision 457/2005/QD-NHNN will be much larger than "immediately payable assets" calculated according to Circular 13/2010/TT-NHNN. Furthermore, according to Decision 457/2005/QD-NHNN, assets due for payment within the next month are all reported by banks based on the contract term while during that period, banks in general and Agribank in particular are still allowed to apply products
convenient deposit products for customers, creating conditions for customers to withdraw money before maturity while still enjoying high interest rates, leading to the actual term being far different from the nominal term, making the actual payment obligation of the bank always much higher than the contractual obligation. That shows that the fact that Agribank and many other banks (Chart 2.14) maintain the payment capacity ratio according to Decision 457/2005/QD-NHNN at a much higher level than the regulations of the State Bank is not necessarily good and accurately reflects the liquidity problem of the bank. And in fact, when switching to implementing the regulations according to Circular 13/2010/TT-NHNN of the State Bank with a reserve requirement calculated on total payable debt (not calculated on payable debt within 1 month) of 15%, Agribank did not meet it.
+ 7-day solvency ratio
Chart 2.15. Agribank's 7-day solvency ratio
9.0
8.0
7.0
6.0
5.0
4.0
3.0
2.0
7-day coverage ratio VND
7-Day Coverage Ratio USD
7 Day Coverage Ratio EUR
1.0
0.0
Unit: %
T10/10
Jan 11 Apr 11 Jul 11 Oct 11 Jan 12 Apr 12 Jul 12 Oct 12 Jan 13 Apr 13 Jul 13 Oct 13 Jan 14 Apr 14 Jul 14
T10/14
Source: Agribank's liquidity indicators report
According to Decision 457/2005/QD-NHNN and Circular 13/2010/TT-NHNN, the 7-day solvency ratio must be at least 1 at the end of the day. In fact, during the period when Decision 457/2005/QD-NHNN was still in effect, many banks, including