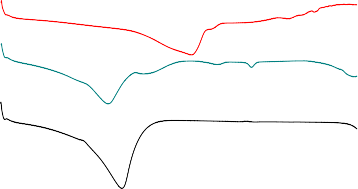
The FT-IR spectrum of rutin shows a very broad band at 3431 cm -1, which is characteristic of the valence vibration of the OH bond [55] (Figure 3.8). The band at 2941 cm -1 is assigned to the valence vibration of the CH bond in the CH- and CH 2 - groups [56]. A rather strong and narrow band at 1656 cm -1 corresponds to the deformation vibration of the OH bond [56]. The quite strong and narrow peaks at 1598 and 1506 cm -1 correspond to the valence vibration of the C=C bond, 1363 and 1294 cm -1 correspond to the CO bond [57].
The COC bond of rutin was observed very clearly by the valence vibrations with characteristic peaks at wavenumbers 1204, 1062 and 1012 cm -1 [57,64]. The deformation vibrational bands of the С-Н bond in the benzene ring were registered at 808 cm -1 [58].
In the infrared spectrum of β-CD, a very strong and broad band with wave number 3404 cm -1 corresponding to the valence vibration of the OH bond appears [67]. We also observed a band with wave number 2929 cm -1 which is believed to be the valence vibration of the C-H bond in the CH- and CH 2 - groups of the host molecule [59]. The deformation vibrations of the OH bond in the COH group are observed at wave number 1641 cm -1 [59]. The frequency range from 1400 to 1200 cm -1 shows characteristic peaks with maximum wave numbers 1417, 1365, 1331 and 1158 cm -1 corresponding to the deformation vibrations of the CH bonds of primary and secondary hydroxyl groups [59]. The spectral bands in the region 1200 to 1030 cm -1 correspond to the valence vibrational absorption bands of the CO bond in sugar ethers and the hydroxyl group of cyclodextrin (1081, 1031 cm -1 ) [58]. The absorption bands in the region 950-700 cm -1 correspond to the deformation vibrations of the CH bond (940, 857,754 and 709 cm -1 ).
The infrared spectrum of the complex shows the structure of both rutin and β-cyclodextrin (Figure 3.8b). The valence vibration band of the OH bond in the complex (3425 cm -1 ) is narrower than the corresponding vibration in βCD and wider than in pure rutin, indicating the formation of a complex - a common phenomenon observed by many researchers in the synthesis of host-guest complexes of β-cyclodextrin [57-59]. We also observed the valence vibration of the CH bond at the wave number 2925 cm -1 . The deformation vibration of the OH bond is reduced in intensity and shifted towards a shorter wavelength (1652 cm -1 ) indicating that the OH group has participated in the complexation reaction. The valence vibration of the C=C bond is strongly reduced and shifted towards
region with longer wavelength (1602 cm -1 ). In the IR spectrum of the complex, peaks characteristic of the valence vibration of the COC bond (1204, 1062 and 1012 cm -1 ) appeared. However, compared with the spectrum of rutin, the intensity of the peak at 1204 cm -1 was strongly reduced, the peaks at 1062 and 1012 cm -1 almost disappeared, proving that the COC bond participated in the complex formation with cyclodextrin.
Thus, the main difference in the spectra of rutin and the [RuT- βCD] complex is the strong displacement and attenuation of the characteristic vibrations of the C=C, OH and COH bonds due to the partial encapsulation of the rutin molecule inside the cavity of the cyclodextrin and the formation of hydrogen bonds to form the complex [60,61].
Similarly, the results of infrared spectroscopy analysis of Quer, HPβCD and the [Quer-HPβCD] complex are presented in Figure 3.9.
1661
1613
1385 1267
3423
1648
2923
2
3424
1035
1646 1634
2924
1036
3424
3
Transmission
1
3500 3000 2500 2000 1500 1000 500
Wavenumbers, cm -1
Figure 3.9: Fourier transform infrared spectra of Quer (1), HPβCD (2) and the [Quer-HPβCD] complex (3).
The IR spectrum of Quer shows characteristic bands for the bonds: 3409 cm -1 (OH), 1667 cm- 1 (C = O), 1610 cm -1 (C = C), 1381 cm- 1 (C-OH) and
1264 cm -1 (COC). The infrared spectrum of HPβCD shows a very strong and broad band with wave number 3404 cm -1 corresponding to the valence vibration of the OH bond. Ta
A spectrum with wavenumber 2929 cm -1 was also observed, which was attributed to the valence vibration of the CH bond in the CH- and CH 2 - groups of the host molecule. A short band between 1600 and 1700 cm -1 and a large band containing distinct peaks in the region 900 to 1200 cm -1 were also observed.
The infrared spectrum of the complex shows the structures of both Quer and HPβCD. The main differences in the spectra of the complex compared to those of Quer and HPβCD are: the valence vibration band of the OH bond in the complex (3424 cm -1 ) is broader than the corresponding vibration in HPβCD, indicating the formation of a complex; the valence vibrations of the characteristic aromatic carbonyl bond in quercetin are shifted to the shorter wavenumber region of 1646 cm -1 with a marked decrease in leakage intensity, indicating that the C=O bond is involved in the complex formation.
3.3.2 DSC analysis results
Differential scanning calorimetry (DSC) is commonly used in supramolecular complex chemistry to demonstrate the differences in the composition of “guest” molecules before and after complexation. Specifically, the disappearance or decrease in intensity of the endothermic peaks of the reaction products is evidence of complexation.
Heat flux, W/g
100 200 | ||||
Temperature, 0 C | ||||
a | ||||
174.8 0 C | ||||
139 0 C | b | |||
111 0 C | ||||
c | ||||
121 0 C | ||||
Maybe you are interested!
-
 1 H, 13 C-Nmr Spectrum Data Of At3 (Cd 3 Od, 500/125Mhz)
 -
 Scale of Factors Affecting Tdnh with Cd Cckt City. Hcm
 -
 Applications of Z-Transform in Signal Processing and Discrete Systems
 -
 Observe the following 2 pictures and based on the knowledge of light scattering of colored objects, please indicate in which case the eye will receive stronger infrared rays.
0
-2
-4
Figure 3.9: DSC curves of rutin (a); rutin nanocomplex (b) and β-CD (c).
Figure 3.9 shows the thermal curves of rutin, β-cyclodextrin and the nanocomplex analyzed in the temperature range from 25 to 300 o C under an inert atmosphere (nitrogen).
The differential scanning calorimetry analysis results of rutin show a wide thermal region corresponding to the dehydration process, the endothermic peak at 174.8 0 C corresponding to the melting point of rutin.
In the case of βCD, the DSC spectrum gives a broader region (from 84 0 C to 136 0 C) (figure 3.10, curve c) corresponding to the release of water molecules from the inner cavity of βCD; the melting point of β-cyclodextrin is 121 o C.
Heat flow
Curve b) shows the thermal analysis results of the nanocomplex [RuT-βCD]. The endothermic peak of βCD in the complex is at 111 0 C, which does not change much but the peak intensity has decreased compared to βCD. More significantly, the endothermic peak of rutin in the complex has decreased significantly in both intensity and temperature (at 139 0 C). This is evidence that there is an interaction between rutin and βCD, a part of rutin molecules has entered the cavity of βCD and formed the complex.
140 0
88 0 C
1
79 0 C
133 0 C
2
3
50 100 150 200
Temperature, 0 C
Figure 3.11: DSC curves of Quer (1), HPβCD (2) and complex (3).
Figure 3.11 shows the differential scanning calorimetry results of Quer as a broad thermal region with an endothermic peak at 140 0 C corresponding to the melting point of Quer. Similar to βCD, the DSC spectrum of HPβCD gives a broader region (from 60 0 C to 125 0 C) corresponding to the release of water molecules from the internal cavity of HPβCD with a melting point of 88 o C.
Comparing the thermal curve of the complex with the curve of Quer and HPβCD shows that the endothermic peak of HPβCD in the complex is 79 0 C, not much change but the peak intensity has decreased significantly compared to HPβCD. The endothermic peak of Quer in the complex has decreased significantly and almost disappeared (133 0 C). This is evidence that there was an interaction between Quer and HPβCD, a part of the Quer molecule has entered the cavity of HPβCD and formed a complex.
3.3.3 Results of structural morphology analysis
The surface morphology of RuT, Quer, before and after complexation is shown in Figure 3.12.
 a)
a)
| |
|
|
Figure 3.12: FESEM images of RuT (a), Quer (c), [RuT-βCD] (b) and [Quer-HPβCD] (d) particles.
From Figure 3.12, we can see that RuT and Quer (Figures a and b) have a rod-like or thin structure throughout the crystal surface. After complexation (Figures c and d), the resulting particles are spherical in shape, quite uniform with an average size of 40-60 nm. This value corresponds to the typical size of functional units in living organisms, allowing them to interact effectively with biomolecules, thereby increasing bioavailability while limiting some side effects due to prolonged presence on the gastric mucosa.
In the microscopy image of the [Quer-HPβCD] complex (Figure 3.12d), the nanoparticles have highly porous and rough surfaces. However, the shape of the nanoparticles is inconsistent and tends to agglomerate. Their sizes vary from a few nm to more than 100 nm.
3.3.4 Results of constructing phase diagram of dissolution process
The construction of dissolution diagrams is commonly used in supramolecular chemistry to determine the reaction rates of substances and the stability constants of complexes. The concept of dissolution phase diagrams was first introduced by Higuchi and Connors to show how the solubility of a drug changes as the concentration of cyclodextrin increases.
Before determining the dissolution phase diagram, it is necessary to construct a standard curve equation of the active ingredients in the solution by the multiple dilution method on a UV-Vis spectrophotometer. The standard curve equations are used to calculate the solubility concentration of RuT or Quer in solvents containing cyclodextrin.
Figure 3.13 shows an example of the UV-Vis absorption spectra of quercetin solutions in the absence of HPβCD (curve a) and in the presence of increasing concentrations of HPβCD (curves 1-5) in the range of 1 ÷ 8 mM. It can be seen that in the range of 300 - 450 nm, Quer exhibits an absorption maximum (curve a) at 370 nm, which can be considered as a transition in the single benzene ring (Buchweitz M et al., 2016). Curves 1-5 in Figure 3.13 show that the formation of an encapsulation complex of Quer with HPβCD leads to a bathochromic effect: the absorption maximum is shifted towards longer wavelengths (375 nm).
= 375 nm
5
4
3
2
1
a
= 370 nm
0.25
0.20
Absorbance
0.15
0.10
0.05
0.00
300 350
/nm
400 450
Figure 3.13: UV-Vis spectrum of quercetin in the absence of HPβCD (curve a) and in the presence of HPβCD with increasing concentrations (curves 1-5).
From the calibration curve equation of the active ingredients, we can accurately determine the concentrations of RuT and Quer dissolved in each cyclodextrin solution. The correlation between the concentrations of the host molecules and the solubility of the guest molecules is shown in Figure 3.14.
C , mmol/l
1.0x10⁻⁴
0.08
Ru
8.0x10⁻⁵
C Que r , mol/l
0.06
6.0x10⁻⁵
0.04
4.0x10⁻⁵
0.02
0.00
2.0x10⁻⁵
0.0 2.0x10 -3 4.0x10 -3 6.0x10 -3 8.0x10 -3
0 1 2 3 4 5
C CD , mmol/l
a)
C HP CD , mol/l
b)
Figure 3.14: Graph showing the correlation between the concentration of cyclodextrin and the solubility of RuT (a) and Quer (b).
The results showed that the solubility of both RuT and Quer increased significantly and linearly depended on the concentration of cyclodextrin in the solution, the specific results are presented.
shown in Table 3.4. The linear shape also demonstrates that the best chemical ratio for forming the 2-component complex in both systems is 1:1.
Table 3.4 : Phase diagram analysis results of the dissolution process with the complexes [RuT-βCD] and [Quer-HPβCD].
Complex
phase diagram of dissolution process | Regression coefficient | Stability constant | Variation of energy Gibbs charge, kJ/mol | |
[RuT-βCD] | y=0.0226x+0.00012 | 0.992 | 154 | -12.48 |
[Quer-HPβCD] | y=0.00792x+0.00002 | 0.989 | 363 | -14.60 |
The Gibbs energy change of the complex formation reaction is calculated based on the equation: ∆ r G = – RTln K (3), the results are listed in table 3.4.
Thus, the complexation reaction spontaneously occurred in aqueous medium at 298K. The results obtained were consistent with the research results obtained by IM Savic et al. in the publication.
3.3.5 Results of solubility determination of rutin and the complex [RuT-βCD]
Similar to section 3.3.4 before determining the solubility of rutin in a solution with pH 7.4, we construct the standard curve equation of RuT using the multiple concentration dilution method. The result obtained for the standard curve equation of RuT is y=13752x-0.0031 with regression coefficient R 2 =0.9995.
Figure 3.13 shows the solubility of rutin before and after complexation over time in pH 7.4 environment.