- The earliest and most commonly used monochromatic radiation lamp in AAS measurement is the hollow cathode lamp, which only emits sensitive emission rays of the metal element that makes up the hollow cathode. The sensitive emission lines of an element are usually resonance lines. Therefore, the hollow cathode lamp is also called a resonance radiation source. It is the emission spectrum of elements in a poor gas environment.
- Structure of hollow cathode lamp:
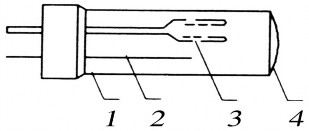
Figure 2.5 Hollow cathode lamp
1. Glass bulb. 2. Anode 3. Cathode 4. Quartz window The hollow cathode lamp is a cylindrical glass bulb, 3 - 5cm in diameter, with
The window is made of glass or quartz. The anode is made of a metal bar. Both poles are placed in a glass bulb containing inert gas (argon or neon) with a small pressure (0.2 - 2MPa). The hollow cathode lamp is connected to a 300 - 500V current, which is stable and must have high stability. The discharge current of the lamp is usually a few milliamperes. When the lamp is working, the current density on the inside of the cathode is higher than the outside. Therefore, the opening of the cathode will glow. The cathode of the lamp is made of metal, a refractory alloy containing the element to be determined.
Question 22:What are the main components of a hollow cathode lamp? HDTL:
Hollow cathode lamp consists of 3 main parts: (see figure 2.5) Part 1 is the lamp body and window.
Part 2 is the cathode and anode electrodes.
Part 3 is the gas contained in the lamp. It is inert gas He, Ar or Nitrogen.
+ Body and shell: The lamp body consists of the lamp shell, window and base for the anode and cathode electrodes. The base is made of PVC plastic. The lamp body and shell are made of glass or quartz. The S-window of the lamp can be glass or quartz transparent in the UV or VIS range depending on the type of lamp of each element emitting the emission beam in which spectrum range.
+ Electrodes: The electrodes of the lamp are the cathode and the anode. The anode is made of inert and heat-resistant metals such as W or Pt. The cathode is made in the form of a cylinder or hollow tube with a diameter of 3 - 5mm, a length of 5 - 6mm and is made of the metal to be analyzed with high purity (at least 99.9%). The cathode wire is also W or Pt metal. The power source is a DC source with a voltage of 220 - 240V.
+ Gas in the lamp: The lamp must suck out all the air and replace it with an inert gas with a pressure of 5 - 15mmHg. The inert gas is argon, helium or nitrogen but must have a purity higher than 99.99%. The gas charged into the lamp must not emit a spectrum that affects the lamp's emission beam and when working under certain conditions, the ratio depends on each type of lamp and each metal element that makes up the hollow cathode. The working intensity of the hollow cathode lamp is usually from 3 - 50mA.
II.3. EXERCISES:
Form 1 : Determine the concentration of metal in the sample, when knowing the metal content in the standard solution and the absorbance.
Solution:
Applying the linear regression method according to the principle of least squares, we construct the standard line: A = aC + b.
Calculate a, b?
i
i
i
i
i
nnnnnnn
i
i
i
i
n AC A C
A C 2 A . C C
a =i 1 i 1 i 1
; b =
i 1 i 1 i 1 i 1
n n 2 n n 2
i
i
i
i
n C 2 C n C 2 C
i 1
i 1
i 1
i 1
Lesson 1:Nowadays, to determine the mercury contamination of aqueous solutions by atomic absorption method, people use the new flameless method of fogging. The apparatus consists of a mercury reduction flask connected to an absorption cuvette. Put 10ml of water sample in the mercury reduction flask and dilute to 100ml, then add 25ml of concentrated sulfuric acid and 10ml of 10% tin (II) sulfate solution, 0.25M sulfuric acid (this last solution is used as a reducing agent). The mercury is reduced to the elemental (atomic) state and transferred to the absorption cuvette by a stream of air, people let this stream of air pass through the solution in the flask to reduce the mercury. Finally, use a lamp
Using a hollow cathode as a source, the absorption of mercury atoms at a wavelength of 2537A0 was measured , the absorption reaching its maximum after nearly 3 minutes.
The following values of absorbance were obtained for a series of standard solutions of mercury (II):
Hg content in standard solution, g
Absorbance | |
0.00 | 0.002 |
0.30 | 0.090 |
0.60 | 0.175 |
1.00 | 0.268 |
2.00 | 0.440 |
Maybe you are interested!
-

 Car body electrical practice - 8
zt2i3t4l5ee
zt2a3gs
zt2a3ge
zc2o3n4t5e6n7ts
If the voltage is out of specification, replace the wire or connector.
If the voltage is within specification, install the front fog light relay and follow step 5.
Step 5 Check the front fog light switch
- Remove the D4 connector of the fog light switch
- Use a multimeter to measure the resistance of the front fog light switch.
Measurement location
Condition
Standard
D4-3 (BFG) -D4-4 (LFG)
Light switchFront Fog OFF
>10kΩ
D4-3 (BFG) -D4-4 (LFG)
Front fog light switchON
<1 Ω
- Standard resistor
D4 connector is located on the combination switch assembly.
If the resistance is out of specification, replace the combination switch (the fog light switch is located in the combination switch).
If the resistance is within specification, follow step 6.
Step 6 Check wiring and connectors (front fog light relay-light selector switch)
- Disconnect connector D4 of the combination switch assembly
- Use a voltmeter to measure the voltage value of jack D4 on the wire side.
Measurement location
Control modecontrol
Standard
D4-3 (BFG) - (-) AQ
TAIL
11 to 14 V
D4 connector for the wiring of the combination switch assembly
If the voltage does not meet the standard, replace the wire or connector.
If the voltage is within standard, there may have been an error in the previous measurements.
Step 7 Check the front fog lights
- Remove the front fog light electrical connector.
- Supply battery voltage to the fog lamp terminals
Jack 8, B9 of front fog lamp on the electrical side
blind first.
Power supply location
Terms and Conditions
Battery positive terminal - Terminal 2Battery negative terminal - Terminal 1
Fog lightsbefore morning
- If the light does not come on, replace the bulb.
If the light is on, re-plug the jack and continue to step 8.
Step 8 Check wiring and connectors (relay and front fog lights)
- Disconnect the B8 and B9 connectors of the front fog lights.
- Use a voltmeter to measure voltage at the following locations:
Measurement location
Switch location
Terms and Conditions
B8-2 - (-) AQ
Electric lock ON TAIL size switchFog switch ON
11 to 14 V
B9-2 - (-) AQ
Electric lock ONTAIL size switch Fog switch ON
11 to 14 V
B8 and B9 connectors on the front fog lamp wiring side
Voltage is not up to standard, repair or replace the jack. If up to standard, there may have been an error in the measurement process.
2.2.4. Procedure for removing, installing and adjusting fog lights 1. Procedure for removing
- Remove the front inner ear pads
Use a screwdriver to remove the 3 screws and remove the front part of the front inner ear liner
-Remove the fog light assembly
+ Disconnect the connector.
+ Use a screwdriver to remove 3 screws to remove the fog light cover
2. Installation sequence
-Rotate the fog lamp bulb in the direction indicated by the arrow as shown in the figure and remove the fog lamp from the fog lamp assembly.
-Rotate the fog light bulb in the direction indicated by the arrow as shown in the figure and install the light into the fog light assembly.
- Use a screwdriver to install the fog light cover
-Install the electrical connector
Attention: Be careful not to damage the plastic thread on the lamp assembly.
- Install the front inner ear pads
Use a screwdriver to install the front inner bumper with 3 screws.
3. Prepare the vehicle to adjust the fog light convergence. Prepare the vehicle:
- Make sure there is no damage or deformation to the vehicle body around the fog lights.
- Add fuel to the fuel tank
- Add oil to standard level.
- Add engine coolant to standard level.
- Inflate the tire to standard pressure.
- Place spare tire, tools and jack in original design position
- Do not leave any load in the luggage compartment.
- Let a person weighing about 75 kg sit in the driver's seat.
4. Prepare to check the fog light convergence
a/ Prepare the vehicle status as follows:
- Place the car in a dark enough place to see the lines. The lines are the dividing line, below which the light from the fog lights can be seen but above which it cannot.
- Place the car perpendicular to the wall.
- Keep a distance of 7.62 m between the center of the fog lamp and the wall.
- Park the car on level ground.
- Press the car down a few times to stabilize the suspension.
Note: A distance of approximately 7.62 m is required between the vehicle (fog lamp center) and the wall to adjust the convergence correctly. If the distance of 7.62 m cannot be achieved, set the correct distance of 3 m to check and adjust the fog lamp convergence. (Since the target area varies with the distance, please follow the instructions as shown in the figure.)
b/ Prepare a piece of thick white paper about 2 m high and 4 m wide to use as a screen.
c/ Draw a vertical line through the center of the screen (line V).
d/ Set the screen as shown in the picture. Note:
- Keep the screen perpendicular to the ground.
- Align the V line on the screen with the center of the vehicle.
e/Draw the reference lines (H, V LH and V RH lines) on the screen as shown in the figure.HINT:
Mark the center of the fog lamp on the screen. If the center mark cannot be seen on the fog lamp, use the center of the fog lamp or the manufacturer's name mark on the fog lamp as the center mark.
H line (fog light height):
Draw a line across the screen so that it passes through the center mark. Line H should be at the same height as the center mark of the fog light bulb.
Line V LH, V RH (center mark position of left fog lamp LH and right fog lamp RH):
Draw two lines so that they intersect line H at the center marks.
5. Check the fog light convergence
a/ Cover the fog lamp or remove the connector of the other side fog lamp to prevent light from the unchecked fog lamp from affecting the fog lamp convergence test.
b/ Start the engine.
c/ Turn on the fog lights and make sure that the dividing line is outside the standard area as shown in the drawing.
6. Adjust the fog light convergence
Use a screwdriver to adjust the fog light to the standard area by turning the toe adjustment screw.
Note: If the screw is adjusted too far, loosen it and then tighten it again, so that the last rotation of the light adjustment screw is clockwise.
3. Self-study questions
1. Describe the operating principle of the lighting system with automatic headlight function
2. Describe the operating principle of the lighting system with the function of rotating headlights when turning
3. Draw diagram and connect lighting system on Hyundai Porter car
4. Draw diagram and connect lighting system on Honda Accord 1992
5. Draw the lighting circuit on a 1993 Toyota Lexus
LESSON 3 MAINTENANCE AND REPAIR OF SIGNAL SYSTEM
I. IMPLEMENTATION GOAL
After completing this lesson, students will be able to:
- Distinguish between types of signals on cars
- Correctly describe common symptoms and suspected areas causing damage.
- Connecting signal circuits ensures technical requirements
- Disassemble, install, check, maintain and repair the signal system to ensure technical requirements.
- Ensure safety in work and industrial hygiene
II. LESSON CONTENT
1. General description
The signal system equipped on cars aims to create signals to notify other vehicles participating in traffic about the vehicle's operating status such as: stopping, parking, braking, reversing, turning...
Signals are used either by light such as headlamps, brake lights, turn signals….. or by sound such as horns, reverse music….
Just like the lighting system. A signal system circuit usually consists of: battery, fuse, wire, relay, electrical load and control switch. Only some switches of the signal system are on the combination switch. The switches of other signals are usually located in different locations such as in the gearbox or brake pedal……
2. Maintenance and repair
2.1. Turn signals and hazard lights
The installation location of the turn signal is shown in Figure 3.1. The turn signal control switch is located in the combination switch under the steering wheel. Turning this switch to the right or left will make the turn signal turn right or left.
The hazard light switch is used when the vehicle has a problem while participating in traffic. When the hazard light switch is turned on, all the turn signals on the vehicle will light up at a certain frequency. The hazard light switch is usually placed separately from the turn signal switch (some old cars integrate the hazard and turn signal switches on the same combination switch cluster).
Figure 3.1 Turn signal switch Figure 3.2 Hazard switch
The part that generates the flashing frequency for the lights is called a turn signal relay. The turn signal relay usually has 3 terminals: B (positive power supply); E (negative power supply); L (providing the turn signal switch to distribute to the
lamp)
2.1.1. Circuit diagram
To generate the frequency for the turn signal, a turn signal relay is used in the turn signal circuit. The current from the turn signal relay will be sent to the turn signal switch assembly to distribute the current to the turn signal lights for the driver's purpose.
Figure 3.3. Schematic diagram of a turn signal circuit without a hazard switch
1. Battery; 2. Electric lock; 3. Turn signal relay; 4. Turn signal switch; 5. Turn signal lamp; 6. Turn signal lamp; 7. Hazard switch
Figure 3.4 Schematic diagram of turn signal circuit with hazard switch
1. Battery; 2. Combination switch cluster; 3. Turn signal;
4. Turn signal light; 5. Turn signal relay
Today's cars no longer use three-pin turn signal relays (B, L, E) but use eight-pin turn signal relays (figure 3.5) (pin number 8 is used for hazard lights).
For this type, the current supplying the turn signal lights is supplied directly from the turn signal relay to the lights.
div.maincontent .p { color: black; font-family:"Times New Roman", serif; font-style: normal; font-weight: normal; text-decoration: none; font-size: 14pt; margin:0pt; } div.maincontent p { color: black; font-family:"Times New Roman", serif; font-style: normal; font-weight: normal; text-decoration: none; font-size: 14pt; margin:0pt; } div.maincontent .s1 { color: black; font-family:"Times New Roman", serif; font-style: normal; font-weight: normal; text-decoration: none; font-size: 13pt; } div.maincontent .s2 { color: black; font-family:"Times New Roman", serif; font-style: italic; font-weight: normal; text-decoration: none; font-size: 14pt; } div.maincontent .s3 { color: black; font-family:"Times New Roman", serif; font-style: normal; font-weight: normal; text-decoration: none; font-size: 14pt; } div.maincontent .s4 { color: black; font-family:"Times New Roman", serif; font-style: normal; font-weight: normal; text-decoration: none; font-size: 13pt; } div.maincontent .s5 { color: black; font-family:"Times New Roman", serif; font-style: normal; font-weight: normal; text-decoration: none; font-size: 13pt; vertical-align: 1pt; } div.maincontent .s6 { color: black; font-family:"Times New Roman", serif; font-style: normal; font-weight: normal; text-decoration: none; font-size: 11pt; } div.maincontent .s7 { color: black; font-family:"Times New Roman", serif; font-style: normal; font-weight: normal; text-decoration: none; font-size: 14pt; vertical-align: -9pt; } div.maincontent .s8 { color: black; font-family:"Times New Roman", serif; font-style: normal; font-weight: normal; text-decoration: none; font-size: 11pt; } div.maincontent .s9 { color: #008000; font-family:"Times New Roman", serif; font-style: normal; font-weight: normal; text-decoration: none; font-size: 14pt; } div.maincontent .s10 { color: black; font-family:"Times New Roman", serif; font-style: italic; font-weight: normal; te
Car body electrical practice - 8
zt2i3t4l5ee
zt2a3gs
zt2a3ge
zc2o3n4t5e6n7ts
If the voltage is out of specification, replace the wire or connector.
If the voltage is within specification, install the front fog light relay and follow step 5.
Step 5 Check the front fog light switch
- Remove the D4 connector of the fog light switch
- Use a multimeter to measure the resistance of the front fog light switch.
Measurement location
Condition
Standard
D4-3 (BFG) -D4-4 (LFG)
Light switchFront Fog OFF
>10kΩ
D4-3 (BFG) -D4-4 (LFG)
Front fog light switchON
<1 Ω
- Standard resistor
D4 connector is located on the combination switch assembly.
If the resistance is out of specification, replace the combination switch (the fog light switch is located in the combination switch).
If the resistance is within specification, follow step 6.
Step 6 Check wiring and connectors (front fog light relay-light selector switch)
- Disconnect connector D4 of the combination switch assembly
- Use a voltmeter to measure the voltage value of jack D4 on the wire side.
Measurement location
Control modecontrol
Standard
D4-3 (BFG) - (-) AQ
TAIL
11 to 14 V
D4 connector for the wiring of the combination switch assembly
If the voltage does not meet the standard, replace the wire or connector.
If the voltage is within standard, there may have been an error in the previous measurements.
Step 7 Check the front fog lights
- Remove the front fog light electrical connector.
- Supply battery voltage to the fog lamp terminals
Jack 8, B9 of front fog lamp on the electrical side
blind first.
Power supply location
Terms and Conditions
Battery positive terminal - Terminal 2Battery negative terminal - Terminal 1
Fog lightsbefore morning
- If the light does not come on, replace the bulb.
If the light is on, re-plug the jack and continue to step 8.
Step 8 Check wiring and connectors (relay and front fog lights)
- Disconnect the B8 and B9 connectors of the front fog lights.
- Use a voltmeter to measure voltage at the following locations:
Measurement location
Switch location
Terms and Conditions
B8-2 - (-) AQ
Electric lock ON TAIL size switchFog switch ON
11 to 14 V
B9-2 - (-) AQ
Electric lock ONTAIL size switch Fog switch ON
11 to 14 V
B8 and B9 connectors on the front fog lamp wiring side
Voltage is not up to standard, repair or replace the jack. If up to standard, there may have been an error in the measurement process.
2.2.4. Procedure for removing, installing and adjusting fog lights 1. Procedure for removing
- Remove the front inner ear pads
Use a screwdriver to remove the 3 screws and remove the front part of the front inner ear liner
-Remove the fog light assembly
+ Disconnect the connector.
+ Use a screwdriver to remove 3 screws to remove the fog light cover
2. Installation sequence
-Rotate the fog lamp bulb in the direction indicated by the arrow as shown in the figure and remove the fog lamp from the fog lamp assembly.
-Rotate the fog light bulb in the direction indicated by the arrow as shown in the figure and install the light into the fog light assembly.
- Use a screwdriver to install the fog light cover
-Install the electrical connector
Attention: Be careful not to damage the plastic thread on the lamp assembly.
- Install the front inner ear pads
Use a screwdriver to install the front inner bumper with 3 screws.
3. Prepare the vehicle to adjust the fog light convergence. Prepare the vehicle:
- Make sure there is no damage or deformation to the vehicle body around the fog lights.
- Add fuel to the fuel tank
- Add oil to standard level.
- Add engine coolant to standard level.
- Inflate the tire to standard pressure.
- Place spare tire, tools and jack in original design position
- Do not leave any load in the luggage compartment.
- Let a person weighing about 75 kg sit in the driver's seat.
4. Prepare to check the fog light convergence
a/ Prepare the vehicle status as follows:
- Place the car in a dark enough place to see the lines. The lines are the dividing line, below which the light from the fog lights can be seen but above which it cannot.
- Place the car perpendicular to the wall.
- Keep a distance of 7.62 m between the center of the fog lamp and the wall.
- Park the car on level ground.
- Press the car down a few times to stabilize the suspension.
Note: A distance of approximately 7.62 m is required between the vehicle (fog lamp center) and the wall to adjust the convergence correctly. If the distance of 7.62 m cannot be achieved, set the correct distance of 3 m to check and adjust the fog lamp convergence. (Since the target area varies with the distance, please follow the instructions as shown in the figure.)
b/ Prepare a piece of thick white paper about 2 m high and 4 m wide to use as a screen.
c/ Draw a vertical line through the center of the screen (line V).
d/ Set the screen as shown in the picture. Note:
- Keep the screen perpendicular to the ground.
- Align the V line on the screen with the center of the vehicle.
e/Draw the reference lines (H, V LH and V RH lines) on the screen as shown in the figure.HINT:
Mark the center of the fog lamp on the screen. If the center mark cannot be seen on the fog lamp, use the center of the fog lamp or the manufacturer's name mark on the fog lamp as the center mark.
H line (fog light height):
Draw a line across the screen so that it passes through the center mark. Line H should be at the same height as the center mark of the fog light bulb.
Line V LH, V RH (center mark position of left fog lamp LH and right fog lamp RH):
Draw two lines so that they intersect line H at the center marks.
5. Check the fog light convergence
a/ Cover the fog lamp or remove the connector of the other side fog lamp to prevent light from the unchecked fog lamp from affecting the fog lamp convergence test.
b/ Start the engine.
c/ Turn on the fog lights and make sure that the dividing line is outside the standard area as shown in the drawing.
6. Adjust the fog light convergence
Use a screwdriver to adjust the fog light to the standard area by turning the toe adjustment screw.
Note: If the screw is adjusted too far, loosen it and then tighten it again, so that the last rotation of the light adjustment screw is clockwise.
3. Self-study questions
1. Describe the operating principle of the lighting system with automatic headlight function
2. Describe the operating principle of the lighting system with the function of rotating headlights when turning
3. Draw diagram and connect lighting system on Hyundai Porter car
4. Draw diagram and connect lighting system on Honda Accord 1992
5. Draw the lighting circuit on a 1993 Toyota Lexus
LESSON 3 MAINTENANCE AND REPAIR OF SIGNAL SYSTEM
I. IMPLEMENTATION GOAL
After completing this lesson, students will be able to:
- Distinguish between types of signals on cars
- Correctly describe common symptoms and suspected areas causing damage.
- Connecting signal circuits ensures technical requirements
- Disassemble, install, check, maintain and repair the signal system to ensure technical requirements.
- Ensure safety in work and industrial hygiene
II. LESSON CONTENT
1. General description
The signal system equipped on cars aims to create signals to notify other vehicles participating in traffic about the vehicle's operating status such as: stopping, parking, braking, reversing, turning...
Signals are used either by light such as headlamps, brake lights, turn signals….. or by sound such as horns, reverse music….
Just like the lighting system. A signal system circuit usually consists of: battery, fuse, wire, relay, electrical load and control switch. Only some switches of the signal system are on the combination switch. The switches of other signals are usually located in different locations such as in the gearbox or brake pedal……
2. Maintenance and repair
2.1. Turn signals and hazard lights
The installation location of the turn signal is shown in Figure 3.1. The turn signal control switch is located in the combination switch under the steering wheel. Turning this switch to the right or left will make the turn signal turn right or left.
The hazard light switch is used when the vehicle has a problem while participating in traffic. When the hazard light switch is turned on, all the turn signals on the vehicle will light up at a certain frequency. The hazard light switch is usually placed separately from the turn signal switch (some old cars integrate the hazard and turn signal switches on the same combination switch cluster).
Figure 3.1 Turn signal switch Figure 3.2 Hazard switch
The part that generates the flashing frequency for the lights is called a turn signal relay. The turn signal relay usually has 3 terminals: B (positive power supply); E (negative power supply); L (providing the turn signal switch to distribute to the
lamp)
2.1.1. Circuit diagram
To generate the frequency for the turn signal, a turn signal relay is used in the turn signal circuit. The current from the turn signal relay will be sent to the turn signal switch assembly to distribute the current to the turn signal lights for the driver's purpose.
Figure 3.3. Schematic diagram of a turn signal circuit without a hazard switch
1. Battery; 2. Electric lock; 3. Turn signal relay; 4. Turn signal switch; 5. Turn signal lamp; 6. Turn signal lamp; 7. Hazard switch
Figure 3.4 Schematic diagram of turn signal circuit with hazard switch
1. Battery; 2. Combination switch cluster; 3. Turn signal;
4. Turn signal light; 5. Turn signal relay
Today's cars no longer use three-pin turn signal relays (B, L, E) but use eight-pin turn signal relays (figure 3.5) (pin number 8 is used for hazard lights).
For this type, the current supplying the turn signal lights is supplied directly from the turn signal relay to the lights.
div.maincontent .p { color: black; font-family:"Times New Roman", serif; font-style: normal; font-weight: normal; text-decoration: none; font-size: 14pt; margin:0pt; } div.maincontent p { color: black; font-family:"Times New Roman", serif; font-style: normal; font-weight: normal; text-decoration: none; font-size: 14pt; margin:0pt; } div.maincontent .s1 { color: black; font-family:"Times New Roman", serif; font-style: normal; font-weight: normal; text-decoration: none; font-size: 13pt; } div.maincontent .s2 { color: black; font-family:"Times New Roman", serif; font-style: italic; font-weight: normal; text-decoration: none; font-size: 14pt; } div.maincontent .s3 { color: black; font-family:"Times New Roman", serif; font-style: normal; font-weight: normal; text-decoration: none; font-size: 14pt; } div.maincontent .s4 { color: black; font-family:"Times New Roman", serif; font-style: normal; font-weight: normal; text-decoration: none; font-size: 13pt; } div.maincontent .s5 { color: black; font-family:"Times New Roman", serif; font-style: normal; font-weight: normal; text-decoration: none; font-size: 13pt; vertical-align: 1pt; } div.maincontent .s6 { color: black; font-family:"Times New Roman", serif; font-style: normal; font-weight: normal; text-decoration: none; font-size: 11pt; } div.maincontent .s7 { color: black; font-family:"Times New Roman", serif; font-style: normal; font-weight: normal; text-decoration: none; font-size: 14pt; vertical-align: -9pt; } div.maincontent .s8 { color: black; font-family:"Times New Roman", serif; font-style: normal; font-weight: normal; text-decoration: none; font-size: 11pt; } div.maincontent .s9 { color: #008000; font-family:"Times New Roman", serif; font-style: normal; font-weight: normal; text-decoration: none; font-size: 14pt; } div.maincontent .s10 { color: black; font-family:"Times New Roman", serif; font-style: italic; font-weight: normal; te -
 Building a system to monitor water level, temperature and send warnings via SMS/GSM network - 2
 -
 Building a Research Model of Factors Affecting Agribank's Brand Value
 -
 Rules for Building a Fair Performance Management System
 -
 Building software to manage a bank of multiple choice questions for university admissions - 16

The absorbance values of the two water samples are 0.040 and 0.305 respectively. What is the content of mercury in each sample? What is the concentration ( g / ml ) of mercury in each sample? [28]
Prize:
Proceed to construct the standard line, linear regression according to the least squares principle A = aC + b:
STT
Hg content (C) | Absorbance (A) | AC | C 2 | |
1 | 0.00 | 0.002 | 0.000 | 0.000 |
2 | 0.30 | 0.090 | 0.027 | 0.090 |
3 | 0.60 | 0.175 | 0.105 | 0.360 |
4 | 1.00 | 0.268 | 0.268 | 1,000 |
5 | 2.00 | 0.440 | 0.880 | 4,000 |
n=5 | C = 3.9 | A = 0.975 | AC =1.28 | C 2 = 5.45 |
nnn
n A i C i Ai C
a i 1 i 1 i 1 5.1, 28 0, 975.3, 9
= 0.2157
n n 2
5.5, 45 3.9 2
i
n C 2 C i
i 1
i 1
yes
i
A i C 2 A i C i C i
b i 1 i 1 i 1 i 1
0, 975.5, 45 1, 28.3, 9
= 0.02672
n n 2
5.5, 45 3.9 2
i
n C 2 C i
i 1
i 1
The resulting regression equation is: A = 0.2157C + 0.0267
* With A = 0.040 substituted into the equation to obtain the mercury content:
0.040 = 0.2157C + 0.02672
Therefore C = 0.0617 g corresponding to a concentration of 0.00617 g/ml.
* With A = 0.305 substituted into the equation to obtain the mercury content:
0.305 = 0.2157C + 0.02672
Therefore C = 1.2902 g corresponding to a concentration of 0.12902 g/ml.
Lesson 2:Atomic absorption spectrometry can be used to determine traces of heavy metals in fuel oil. To analyze a 5.000 g sample of used fuel oil, it is placed in a 25.00 ml volumetric flask, dissolved in 2-methyl-4-pentanol and brought to the mark with this solvent. The resulting solution is then nebulized in an air-acetylene flame. To determine copper and lead, hollow cathode lamps with emission lines of 324.7 and 283.3 nm are used, respectively. To obtain the calibration graphs, a series of standard solutions containing known amounts of copper and lead in the mixture corresponding to unused fuel oil and 2-methyl-4-pentanol are required. The regression equations for copper and lead in a 5.000 g sample of used fuel oil are constructed according to the following data:
Solution
Absorbance | ||
at 283.3 nm (Pb) | at 324.7 nm (Cu) | |
a, Standard: 19.5 g / ml Pb 5.25 g / ml Cu | 0.356 | 0.514 |
b, Standard: 4.00 g / ml Pb 4.00 g / ml Cu | 0.073 | 0.392 |
c, Standard: 12.1 g / ml Pb 6.27 g / ml Cu | 0.220 | 0.612 |
d, Standard: 8.50 g / ml Pb | 0.155 | 0.101 |
đ, Standard: 15.2 g / ml Pb 2.40 g / ml Cu | 0.277 | 0.232 |
e, Unknown | 0.247 | 0.371 |
Prize:
Proceed to construct the standard line, linear regression according to the least squares principle A = aC + b:
Status
Lead content (C) | Absorbance (A) | AC | C 2 | |
1 | 4.00 | 0.073 | 0.292 | 16,000 |
2 | 8.50 | 0.155 | 1,318 | 72,250 |
3 | 12.1 | 0.220 | 2,662 | 146,410 |
4 | 0.00 | 0.247 | 0.000 | 0.000 |
5 | 15.2 | 0.277 | 4,210 | 231,040 |
6 | 19.5 | 0.356 | 6,942 | 380,250 |
C = 59.3 | A = 1.382 | AC = 15.424 | C 2 = 845,950 |
nnn
n A i C i A i C i
a =i 1 i 1 i 1=
6.15,424 1,328.59.3
= 0.1099
n n 2
6,845,950 59.3 2
i
i
n C 2 C
i 1
i 1
yes
A C 2 A . C C
iiii
i 1,328,845.95 15,424.59.3
b =i 1 i 1 i 1 i 1=
= 0.1339
n n 2
6,845,950 59.3 2
i
i
n C 2 C
i 1
i 1
The resulting regression equation is: A = 0.1099C + 0.1339
Status
Copper content (C) | Absorbance (A) | AC | C 2 | |
1 | 0.00 | 0.101 | 0.000 | 0.000 |
2 | 2.40 | 0.232 | 0.557 | 5,760 |
3 | 0.00 | 0.371 | 0.000 | 0.000 |
4 | 4.00 | 0.392 | 1,568 | 16,000 |
5 | 5.25 | 0.514 | 2,699 | 27,563 |
6 | 6.27 | 0.612 | 3,837 | 39,313 |
C = 17.92 | A = 2.222 | AC = 8.661 | C 2 = 88.635 |
nnn
n A i C i A i C i
a =i 1 i 1 i 1=
6.8,661 2,222.17.92
= 0.0557
n n 2
6.88,635 17.92 2
i
i
n C 2 C
i 1
i 1
yes
A C 2 A . C C
iiii
i 2,222.88,635 8,661.17.92
b =i 1 i 1 i 1 i 1=
= 0.1981
n n 2
6.88,635 17.92 2
i
i
n C 2 C
i 1
i 1
The resulting regression equation is: A = 0.0557C + 0.1981
Lesson 3 : To determine the copper content in the FFDT sample (dry free fat sample obtained from the joint extract), 11.23 mg of FFDT was mixed in a 5.00 ml flask with 0.75 M HNO3 solution to the mark. Atomic absorption spectroscopy was performed using an air-acetylene flame to obtain an absorbance of 0.023 at a wavelength of 324.8 nm. Standard solutions were measured under similar conditions, and the results were as follows:
ppm Cu
0.000 | 0.100 | 0.200 | 0.300 | 0.400 | 0.500 | 0.600 | 0.700 | 1,000 | |
Absorbance | 0.000 | 0.006 | 0.013 | 0.020 | 0.026 | 0.033 | 0.039 | 0.046 | 0.066 |
What is the concentration of copper ( g/gram FFDT)?
Solution: Construct the standard line and linear regression according to the least squares principle A = aC + b:
Status
Copper content (C) | Absorbance (A) | AC | C 2 | |
1 | 0.000 | 0.000 | 0.000 | 0.000 |
2 | 0.100 | 0.006 | 0.001 | 0.010 |
3 | 0.200 | 0.013 | 0.003 | 0.040 |
4 | 0.300 | 0.020 | 0.006 | 0.090 |
5 | 0.400 | 0.026 | 0.010 | 0.160 |
6 | 0.500 | 0.033 | 0.017 | 0.250 |
7 | 0.600 | 0.039 | 0.023 | 0.360 |
8 | 0.700 | 0.046 | 0.032 | 0.490 |
9 | 1,000 | 0.066 | 0.066 | 1,000 |
n = 9 | C = 3,800 | A = 0.249 | AC = 0.158 | C 2 = 2,400 |
nnn
n A i C i A i C i
a =i 1 i 1 i 1=
9.0,158 0,249.3,800
= 0.0665
n n 2
9.2,400 3,800 2
i
i
n C 2 C
i 1
i 1
yes
A C 2 A . C C
iiii
i 0.249.2.400 0.158.3.800
b =i 1 i 1 i 1 i 1=
= - 0.00039
n n 2
9.2,400 3,800 2
i
i
n C 2 C
i 1
i 1
The regression equation obtained is: A = 0.0665C - 0.00039 (C is ppm Cu concentration) replace A = 0.023
C = 0.352 ppm = 0.352 g/ml
Cu content:
0.352 g / ml .5 ml0.01123 grams
= 157 gCu/gram FFDT.
Lesson 4:An analyst has given the results of data for constructing a standard curve for phosphorus analysis using flame atomic absorption spectroscopy:
ppm P
2130 | 4260 | 6400 | 8530 | |
Absorbance | 0.048 | 0.110 | 0.173 | 0.230 |
To determine the purity of the Na 2 HPO 4 sample , dissolve 2.469 grams of the sample in water, transfer it to a 100.00 ml volumetric flask and make up to the mark. The atomic absorption of the resulting color is 0.135. Determine the purity of the Na 2 HPO 4 sample .
Prize:
Proceed to construct the standard line, linear regression according to the least squares principle A = aC + b:
Status
Content phosphorus (C) | Absorbance (A) | AC | C 2 | |
1 | 2130 | 0.048 | 102,2400 | 4536900 |
2 | 4260 | 0.110 | 468,6000 | 18147600 |
6400 | 0.173 | 1107,2000 | 40960000 | |
4 | 8530 | 0.230 | 1961,9000 | 72760900 |
n =4 | C = 21320 | A = 0.561 | AC = 3639.940 | C 2 = 136405400 |